. 2025 Jan 6;24(1):6.
doi: 10.1186/s12933-024-02541-3.

NLRP3 inflammasome-modulated angiogenic function of EPC via PI3K/ Akt/mTOR pathway in diabetic myocardial infarction

Affiliations

NLRP3 inflammasome-modulated angiogenic function of EPC via PI3K/ Akt/mTOR pathway in diabetic myocardial infarction

Jia-Peng Li et al. Cardiovasc Diabetol. .

Abstract

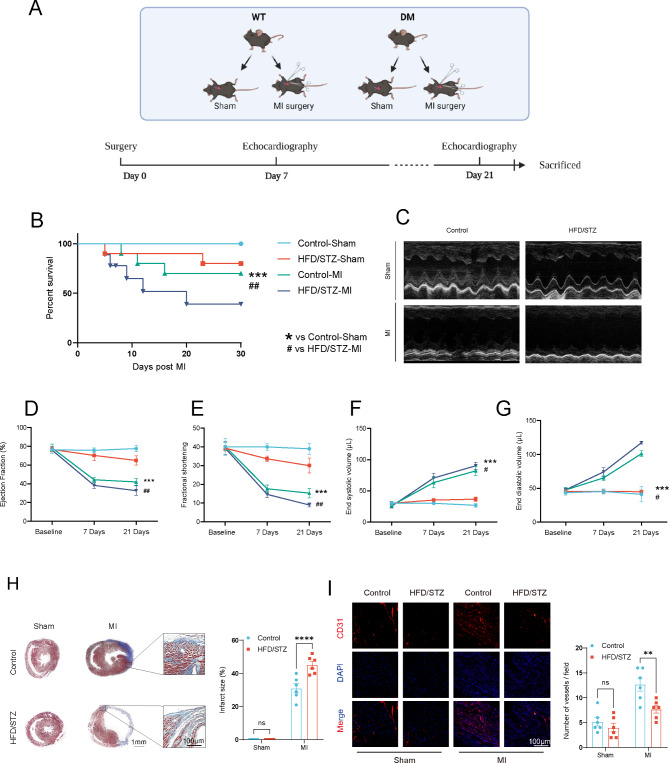
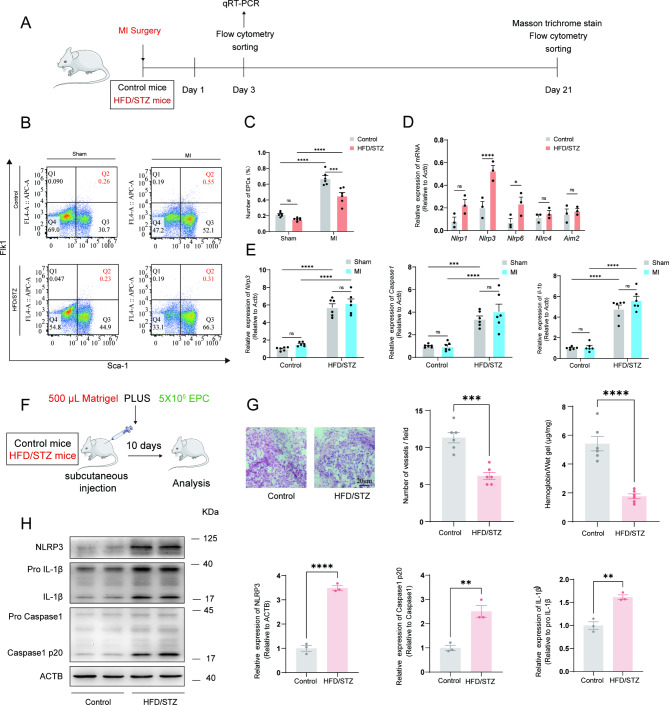
Background: Inflammatory diseases impair the reparative properties of endothelial progenitor cells (EPC); however, the involvement of diabetes in EPC dysfunction associated with myocardial infarction (MI) remains unknown.

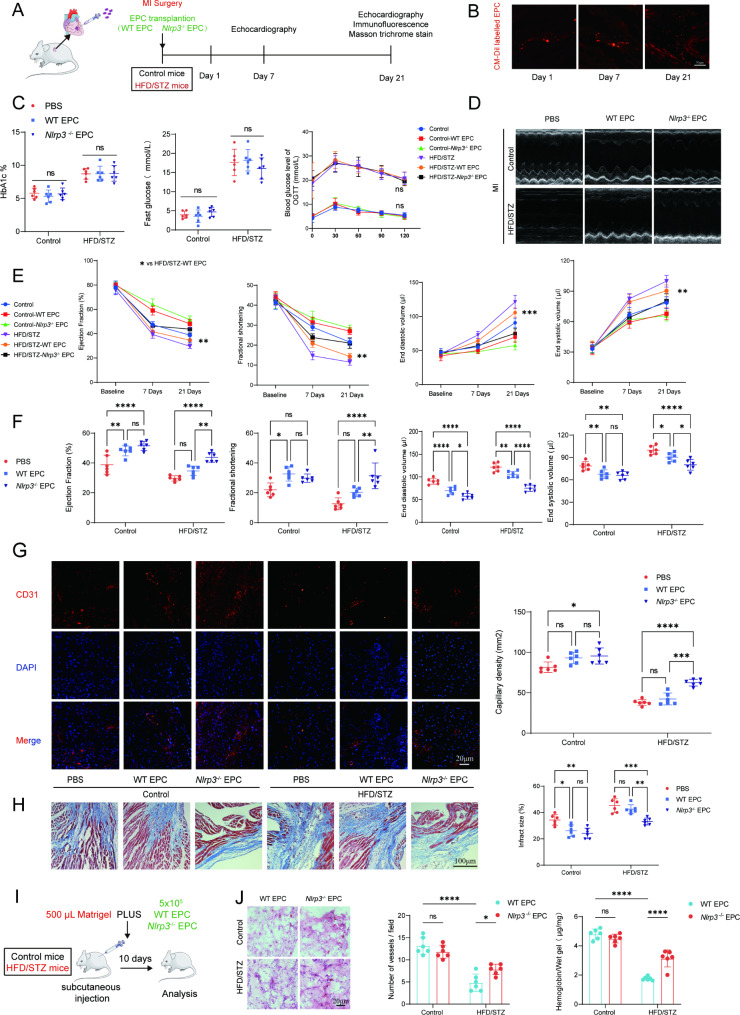
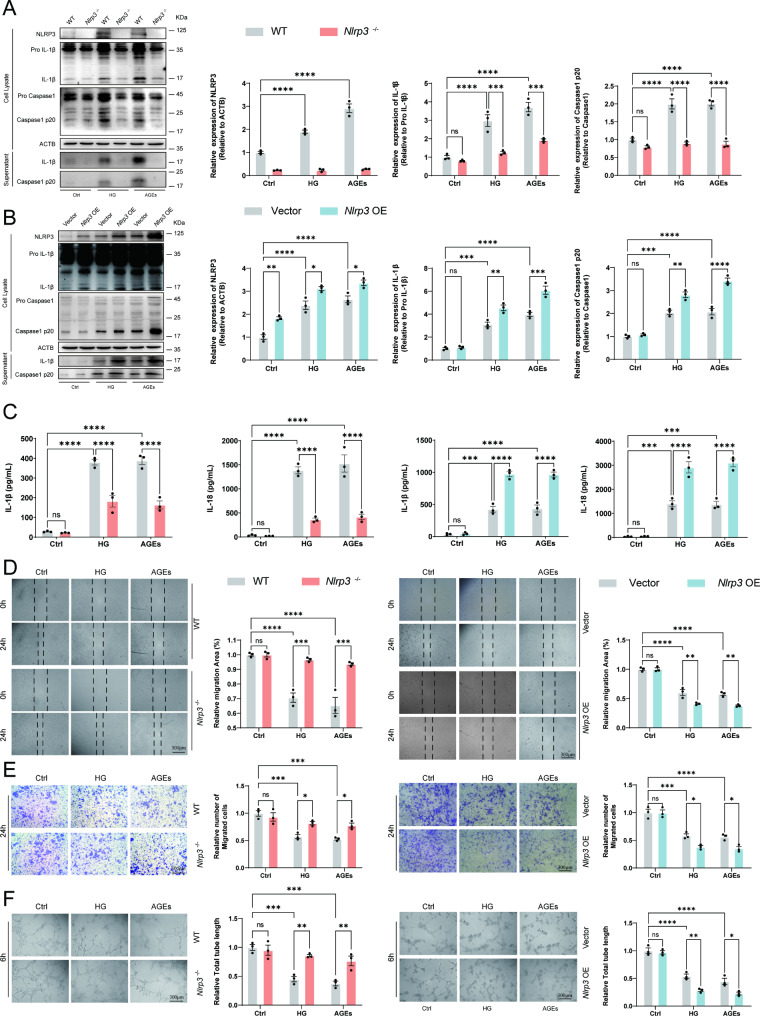
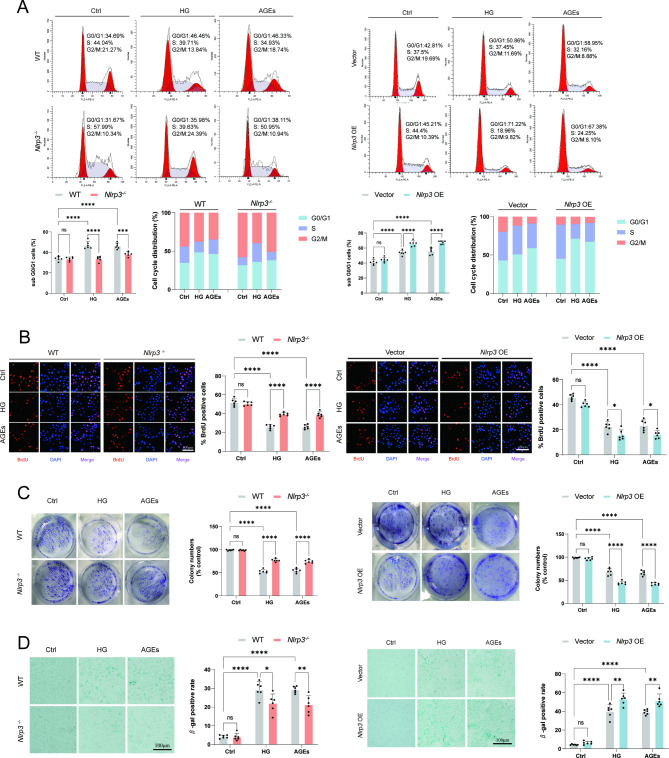
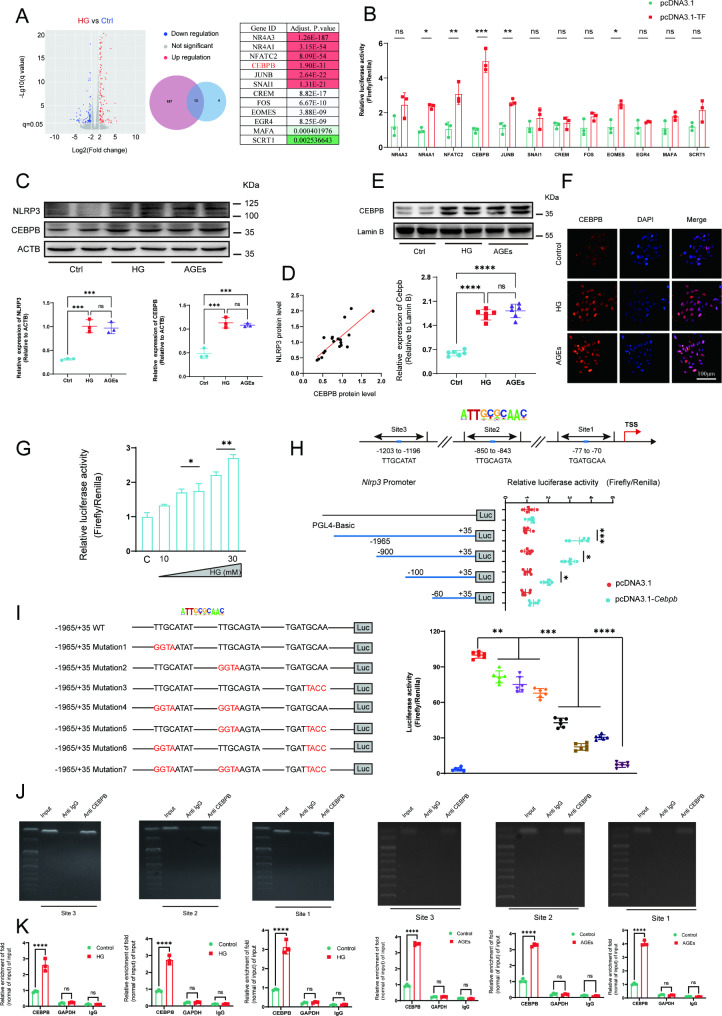
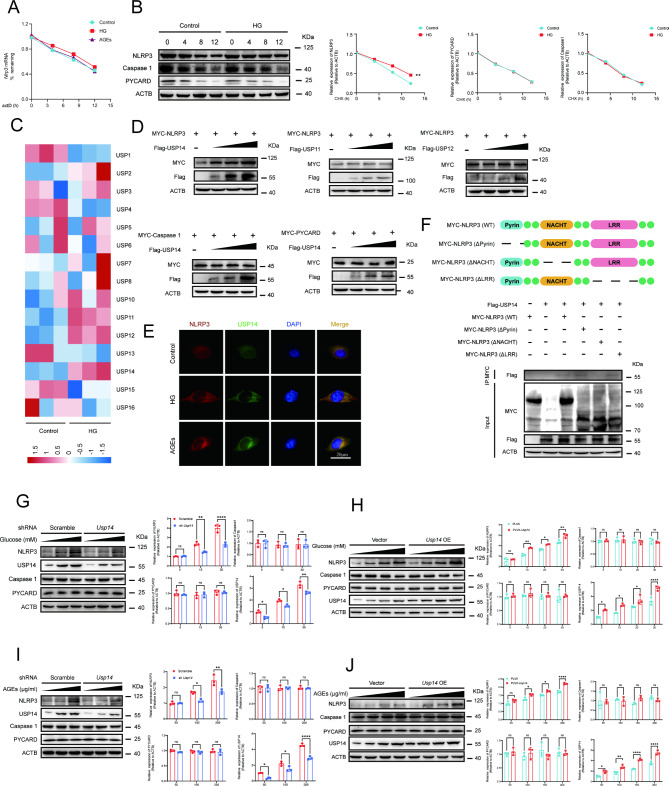
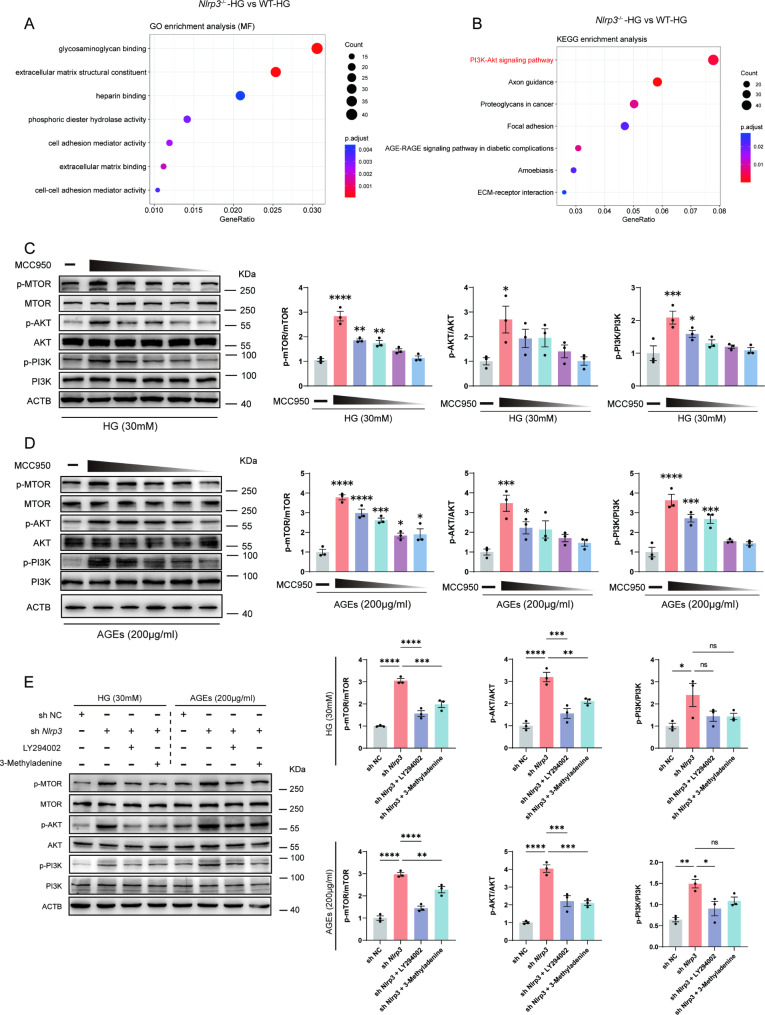
Methods: A model was established combining high-fat diet (HFD)/streptozotocin (STZ)-induced diabetic mice with myocardial infarction. The therapeutic effects of transplanted wild-type EPC, Nlrp3 knockout EPC, and Nlrp3 overexpression EPC were evaluated. Chip and Luciferase assay revealed CEBPB regulated the transcriptional expression of Nlrp3 as a transcription factor in EPC stimulated by high glucose (HG) or advanced glycation end products (AGEs). CO-IP results suggested that USP14 selectively suppressed NLRP3 degradation. KEGG enrichment revealed PI3K/ Akt/mTOR signaling showed striking significance in the entire pathway.

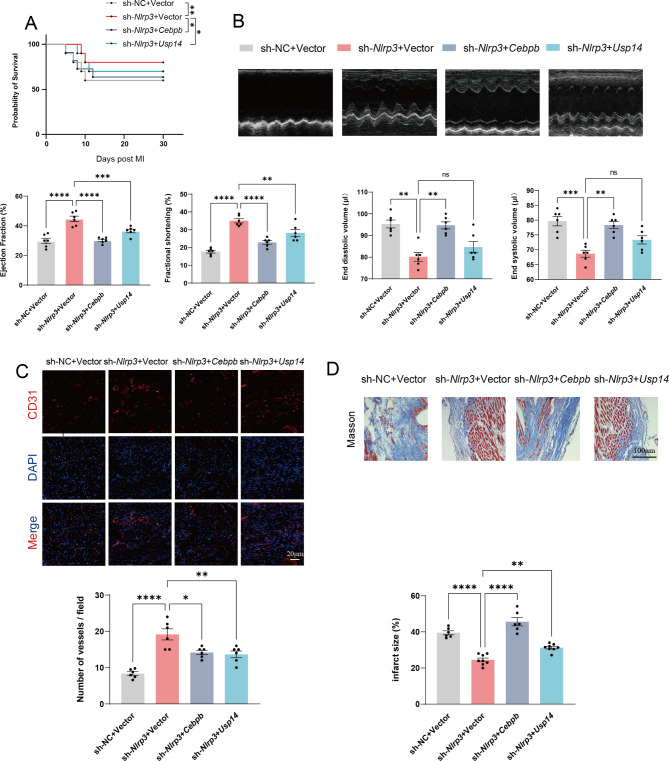
Results: In our study, wild-type, Nlrp3 knockout and Nlrp3 overexpressed EPC, intracardiac injections effectively improved cardiac function, increased angiogenesis, and reduced infarct size in mice with myocardial infarction. However, in the HFD/STZ-induced diabetic mice model combined with myocardial infarction, Nlrp3 knockout EPC significantly restored angiogenic capacity. Mechanically, CEBPB regulated the transcriptional level of Nlrp3 as a transcription factor in EPC. Meanwhile, we found that USP14 selectively suppressed NLRP3 protein degradation through the USP motif on the NACHT domain in mediating inflammasome activation. Cardiac functional outcomes in recipient mice after intramyocardial injection of shNlrp3 EPC overexpressing CEBPB or USP14 validated the modulation of EPC function by regulating Nlrp3 transcription or post-translational modification. Furthermore, KEGG enrichment and validation at the protein levels revealed PI3K/ Akt/mTOR cascade might be a downstream signal for NLRP3 inflammasome.

Conclusion: Our study provides a new understanding of how diabetes affected progenitor cell-mediated cardiac repair and identifies NLRP3 as a new therapeutic target for improving myocardial infarction repair in inflammatory diseases.

Keywords: Angiogenesis; Diabetes; Endothelial progenitor cell; Myocardial infarction; NLRP3 inflammasome.


Conflict of interest statement

Declarations. Consent for publication: All authors consent for the publication of this study. Competing interests: The authors declare no competing interests.

Figures

Fig. 1
Fig. 1
Impaired cardiac function and promoted left ventricular remodeling after permanent myocardial ischemia in HFD/STZ-induced diabetic mice. (A) a diagram of the experimental protocol. (B) Short-term survival curve after myocardial infarction and the indicated treatments (n = 10–12 mice/group). (C) Representative short-axis M-mode echocardiograms of the left ventricle in the control-Sham, HFD/STZ-Sham, control-MI, and HFD/STZ-MI groups. Left ventricular function was assessed by measurements of ejection fraction (D), LV fractional shortening (E), end diastolic volume (F), end systolic volume (G), and at day 7 and day 21 after MI (n = 6 mice/group). (H) Representative images and quantitative infarct size in Masson’s trichrome stained mice hearts on day 21 after MI (n = 6 mice/group). (I) Representative endothelial CD31 staining at the infarction border zone sections. *p < 0.05, **p < 0.01, ***p < 0.001 vs. Control-sham, # p < 0.05, ## p < 0.01, ### p < 0.001 vs. Control-MI group. Similar results were obtained from three independent experiments
Fig. 2
Fig. 2
Reduced EPC mobilization and activated NLRP3 inflammasome in HFD/STZ-induced diabetic mice. (A) a diagram of the experimental protocol. (B) FACS analysis on peripheral blood mononuclear cells for EPC mobilization in groups. (C) The bar graph showed that EPC mobilization was impaired in HFD/STZ-induced diabetic mice as compared with control mice (n = 6 mice/group). (D) Nlrp1, Nlrp3, Nlrp6, Nlrc4 and Aim2 mRNA expression (RT-PCR) in flow cytometry-sorted EPC were quantified at 3 days after MI. (E) Nlrp3, Caspase1, and Il-1b mRNA expression (RT-PCR) in flow cytometry-sorted EPC were quantified at 3 days after MI. mRNA expression normalized to Actb and depicted as fold change versus control. (F) a diagram of the matrigel plug protocol. (G) Representative HE photographs of matrigel plugs removed from mice 10 days after injection (n = 6 mice/group). The relative amounts of hemoglobin extracted from the excised matrigel plugs and the number of blood vessels in matrigel plugs (n = 6 mice/group). (H) Relative NLRP3, Caspase1 p20, and IL-1β protein expression levels in EPC extracted from the excised matrigel plugs (n = 3 mice/group). * p < 0.05, ** p < 0.01, *** p < 0.001, **** p < 0.0001. These experiments were repeated independently at least three times with similar results
Fig. 3
Fig. 3
Intramyocardial injectionNlrp3 knockout EPC improved cardiac function and restrained left ventricular remodeling after permanent myocardial ischemia in HFD/STZ-induced diabetic mice. (A) a diagram of the transplanted experimental protocol. (B) Representative images showing that the fluorescence signal observed in the heart of myocardial ischemia mice on days 1, 7 and 21 after injection of Dil-labeled EPC. (C) Fasting glucose, oral glucose tolerance test and HbA1c in HFD/STZ-induced diabetic myocardial infarction mice followed by intramyocardial injection of EPC. (D) Representative short-axis M-mode echocardiograms of the left ventricle at day 21 in the control and HFD/STZ-induced diabetic groups. (E) Left ventricular function after injection of Nlrp3 knockout EPC was assessed by measurements of ejection fraction, LV fractional shortening, end diastolic volume, and end systolic volume at day 7 and day 21 after MI (n = 6 mice/group). (F) Left ventricular function was assessed by measurements of ejection fraction, LV fractional shortening, end diastolic volume, and end systolic volume at day 21 after MI (n = 6 mice/group). (G) Representative endothelial CD31 staining at the infarction border zone sections. (H) Representative images and quantitative infarct size in Masson’s trichrome stained mice hearts on day 21 after MI (n = 6 mice/group). (I) a diagram of the matrigel plug experimental protocol. (J) Representative HE photographs of matrigel plugs removed from mice 10 days after injection. The relative amounts of hemoglobin extracted from the excised matrigel plugs and the number of blood vessels in matrigel plugs. * p < 0.05, ** p < 0.01, *** p < 0.001, **** p < 0.0001. Similar results were obtained from three independent experiments
Fig. 4
Fig. 4
Regulated angiogenesis function of EPC by NLRP3 inflammasome in response to HG or AGEs. (A) Western blot analysis of NLRP3, Caspase1, and IL-1β cleavage in EPC from WT or Nlrp3−/− mice following stimulation with HG (30 mM) or AGEs (200 µg/ml) for 72 h. The supernatant was collected directly after a 72-hour incubation period with high glucose and AGEs. (B) EPC from wild-type mice were transfected with Vector or Nlrp3. Western blot analysis of NLRP3, Caspase1, and IL-1β cleavage in EPC transfected with Vector or Nlrp3 following stimulation with HG (30 mM) or AGEs (200 µg/ml) for 72 h. (C) ELISA analysis of IL-18, and IL-1β in supernatants of EPC from WT or Nlrp3−/− mice and EPC transfected with Vector or Nlrp3 following stimulation with HG (30 mM) or AGEs (200 µg/ml) for 72 h. (D) Wound healing of EPC response to HG (30 mM) or AGEs (200 µg/ml) in vitro. (E) Migration assay with EPC treated with HG (30 mM) or AGEs (200 µg/ml) was performed. (F) The angiogenic function of EPC was evaluated by tube formation assay. *p < 0.05, **p < 0.01, ***p < 0.001, ****p < 0.0001. Representative results from three biologically independent experiments
Fig. 5
Fig. 5
Regulated proliferation function of EPC by NLRP3 inflammasome in response to HG or AGEs. (A) Flow cytometry analysis was conducted on EPC following stimulation with HG (30 mM) or AGEs (200 µg/ml) for 72 h. The representative pattern of the cell cycle distribution of EPC in synchrony after stimulation. The representative pattern of the cell cycle distribution of EPC in synchrony and after stimulation. (B) Representative images of BrdU incorporation status after stimulation with HG (30 mM) or AGEs (200 µg/ml) for 72 h in EPC. Images were generated by merging the DAPI and BrdU channels. (C) Clone formation assay results showed the effects of NLRP3 inflammasome on the proliferation of EPC. (D) Senescence-associated beta-galactosidase staining of EPC following stimulation with HG (30 mM) or AGEs (200 µg/ml) for 72 h. *p < 0.05, **p < 0.01, ***p < 0.001, ****p < 0.0001. Similar results were obtained from three independent experiments
Fig. 6
Fig. 6
CEBPB initiated the transcription ofNlrp3by directly binding to the promoter region ofNlrp3. (A) The volcano map of DEGs in EPC at the transcriptional level following stimulation with HG (30 mM) or not for 72 h (∣log2fold change∣ > 1 and FDR < 0.05). Venn diagram based on the overlapping DEGs between upregulated genes and mouse transcription factor. Differentially expressed transcription factors and adjust P.value in HG vs. Control group. (B After transfection with various transcription factors, luciferase reporter gene assays using the Nlrp3 promoter were performed in EPC. (C) Relative NLRP3 and CEBPB protein levels in EPC following stimulation with HG (30 mM) or AGEs (200 µg/ml) for 72 h. (D) Correlation between NLRP3 levels and CEBPB levels in EPC. (E) Western blot of nuclear extracts obtained from EPC following stimulation with HG (30 mM) or AGEs (200 µg/ml) for 72 h was performed to investigate the expression of CEBPB. Each density of CEBPB was normalized with that of LAMIN B. (F) Representative immunofluorescence imaging of CEBPB nuclear translocation after stimulation with HG (30 mM) or AGEs (200 µg/ml) for 72 h. (G) Luciferase reporter assay in EPC using Nlrp3 promoter after stimulation with different concentrations of glucose (10, 15, 20, 25, 30mM) for 72 h. (H) Putative binding sites of CEBPB in the promoter region of Nlrp3. TSS, transcriptional start site. Luciferase reporter assay in EPC using different fragments of Nlrp3 promoter after transfection with Cebpb. (I) A series of luciferase reporter constructs harbouring site-directed mutations in the CEBPB binding sites of the Nlrp3 promoter region were assayed for promoter activity in EPC. Luciferase reporter assay in EPC using different mutations on site1, site2 and site3 respectively. (Site3: TTGCATAT to GGTAATAT, Site2: TTGCAGTA to GGTAAGTA, Site1: TGATGCAA to TGATTACC). (J) ChIP-PCR analysis of EPC following stimulation with HG (30 mM) or AGEs (200 µg/ml) for 72 h. PCR primers were designed to surround the predicted CEBPB-binding sites 1–3 in the Nlrp3 promoter. Nonspecific IgG was used as a control. * p < 0.05, ** p < 0.01, *** p < 0.001, **** p < 0.0001. These experiments were repeated independently three times with similar results
Fig. 7
Fig. 7
USP14 interacted with NLRP3 and inhibited NLRP3 protein degradation. (A) The expression of Nlrp3 mRNA at 0,4,8 and 12 h post-stimulation was determined by qRT-PCR and normalized to the 18 S rRNA. (B) Immunoblot analysis of extracts from EPC stimulated with HG (30 mM) for 72 h, followed by treatment with cycloheximide for various times (CHX, 100 ug/mL). NLRP3, PYCARD, and Caspase1 expression levels were quantitated by measuring band intensities and normalized to ACTB. (C) Heatmap showing the expression of USP family genes identified in control EPC vs. HG (30 mM) treated EPC. (D) MYC-Nlrp3 was transfected in EPC, as well as graded amounts of FLAG-Usp14, FLAG-Usp11 and FLAG-Usp12. The protein level of NLRP3 were detected by western blot. MYC-Caspase1, and MYC-Pycard were transfected in EPC, as well as graded amounts of FLAG-Usp14. The protein level of Caspase1, and PYCARD were detected by western blot. (E) EPC was stimulated with HG (30 mM) or AGEs (200 µg/ml) for 72 h, then fixed and incubated with a secondary antibody. Colocalization between USP14 and NLRP3 was examined by confocal microscopy. Confocal imaging results are representative of three independent experiments. (F) Schematic diagram of NLRP3 and its truncation mutants. MYC-tagged Nlrp3 or its mutants along with Flag-Usp14 were individually transfected into EPC. The cell lysates were immunoprecipitated with anti-MYC antibodies and then immunoblotted with anti-Flag antibodies. Similar results were obtained from three independent experiments. (G) Western blot analysis of NLRP3, USP14, Caspase1, and PYCARD in wildtype (WT) or Usp14 knockdown EPC following stimulation with a gradient concentration of glucose (5, 15,30mM) for 72 h. (H) Western blot analysis of NLRP3, USP14, Caspase1, and PYCARD in EPC transfected with Vector or Nlrp3 following stimulation with a gradient concentration of glucose (5, 10, 20,30mM) for 72 h. (I) Western blot analysis of NLRP3, USP14, Caspase1, and PYCARD in wildtype (WT) or Usp14 knockdown EPC following stimulation with a gradient concentration of AGEs (50, 100, 200 µg/ml) for 72 h. (J) Western blot analysis of NLRP3 USP14, Caspase1, and PYCARD in EPC transfected with Vector or Nlrp3 following stimulation with a gradient concentration of AGEs (50, 100, 150, 200 µg/ml) for 72 h. *p < 0.05, **p < 0.01, ***p < 0.001, ****p < 0.0001. These experiments were repeated independently at least three times with similar results
Fig. 8
Fig. 8
CEBPB and USP14 regulated cardiac Function by modulating NLRP3 inflammasome in vivo. (A) Short-term survival curve after myocardial infarction and the indicated treatments. (B) Representative short-axis M-mode echocardiograms of the left ventricle at baseline and day 21 in the HFD/STZ-induced diabetic mice with myocardial infarction groups. Left ventricular function was assessed by measurements of ejection fraction, LV fractional shortening, end diastolic volume, and end systolic volume. (C) Representative endothelial CD31 staining at the infarction border zone sections. (D) Representative images and quantitative infarct size in Masson’s trichrome stained mice hearts on day 21 after MI (n = 6 mice/group). *p < 0.05, **p < 0.01, ***p < 0.001, ****p < 0.0001. These experiments were repeated independently at least three times with similar results
Fig. 9
Fig. 9
NLRP3 inflammasome activation inhibited angiogenesis via PI3K/Akt/mTOR pathway in EPC. (A) GO enrichment analysis of the known molecular function in wild-type and Nlrp3 knockout EPC stimulated with high glucose (30mM) for72h. (B) KEGG enrichment analysis of the known oncogenic or metabolic pathways in wild-type and Nlrp3 knockout EPC stimulated with high glucose (30mM) for72h. (C) Western blot analysis of p-MTOR, MTOR, p-AKT, AKT, p-PI3K, PI3K protein levels in EPC pretreated with MCC950 (10µM, 8µM, 4µM, 2µM, 1µM) for 6 h in response to HG (30 mM). (D) Western blot analysis of p-MTOR, MTOR, p-AKT, AKT, p-PI3K, PI3K protein levels in EPC pretreated with MCC950 (10µM, 8µM, 4µM, 2µM, 1µM) for 6 h in response to AGEs (200 µg/ml). (E) Western blot analysis of p-MTOR, MTOR, p-AKT, AKT, p-PI3K, PI3K protein levels in EPC pretreated with shNlrp3, LY294002 (20µM) for 12 h, and 3-methyladenine (5 Mm) for 12 h. *p < 0.05, **p < 0.01, ***p < 0.001, ****p < 0.0001 vs. Control. These experiments were repeated independently three times with similar results

References

    1. Kivimaki M, Steptoe A. Effects of stress on the development and progression of cardiovascular disease. Nat Rev Cardiol. 2018;15(4):215–29. - PubMed
    1. Nemet I, Saha PP, Gupta N, et al. A cardiovascular disease-linked gut microbial metabolite acts via adrenergic receptors. Cell. 2020;180(5):862–77. e22. - PMC - PubMed
    1. Van Waes JA, Nathoe HM, De Graaff JC, et al. Myocardial injury after noncardiac surgery and its association with short-term mortality. Circulation. 2013;127(23):2264–71. - PubMed
    1. Smilowitz NR, Gupta N, Guo Y, et al. Perioperative acute myocardial infarction associated with non-cardiac surgery. Eur Heart J. 2017;38(31):2409–17. - PubMed
    1. Smilowitz NR, Gupta N, Ramakrishna H, et al. Perioperative major adverse cardiovascular and cerebrovascular events associated with noncardiac surgery. JAMA Cardiol. 2017;2(2):181–7. - PMC - PubMed

Publication types

MeSH terms

Substances

LinkOut - more resources