. 2025 Jan 6;26(1):4.
doi: 10.1186/s13059-024-03468-4.

Resolving the source of branch length variation in the Y chromosome phylogeny

Affiliations

Resolving the source of branch length variation in the Y chromosome phylogeny

Yaniv Swiel et al. Genome Biol. .

Abstract

Background: Genetic variation in the non-recombining part of the human Y chromosome has provided important insight into the paternal history of human populations. However, a significant and yet unexplained branch length variation of Y chromosome lineages has been observed, notably amongst those that are highly diverged from the human reference Y chromosome. Understanding the origin of this variation, which has previously been attributed to changes in generation time, mutation rate, or efficacy of selection, is important for accurately reconstructing human evolutionary and demographic history.

Results: Here, we analyze Y chromosomes from present-day and ancient modern humans, as well as Neandertals, and show that branch length variation amongst human Y chromosomes cannot solely be explained by differences in demographic or biological processes. Instead, reference bias results in mutations being missed on Y chromosomes that are highly diverged from the reference used for alignment. We show that masking fast-evolving, highly divergent regions of the human Y chromosome mitigates the effect of this bias and enables more accurate determination of branch lengths in the Y chromosome phylogeny.

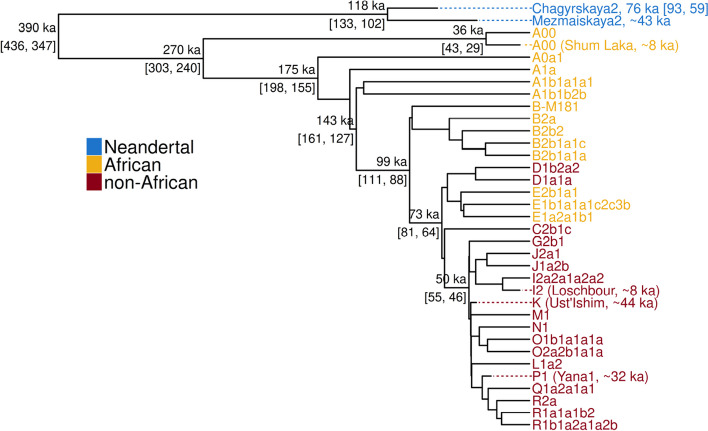
Conclusion: We show that our approach allows us to estimate the age of ancient samples from Y chromosome sequence data and provide updated estimates for the time to the most recent common ancestor using the portion of the Y chromosome where the effect of reference bias is minimized.

Keywords: Ancient DNA; Generation time; Molecular dating; Mutation rate; Reference bias; Sequence alignment; Y chromosome.


Conflict of interest statement

Declarations. Ethics approval and consent to participate: All sequencing data used in this study were previously published. Consent for publication: Not applicable. Competing interests: The authors declare no competing interests.

Figures

Fig. 1
Fig. 1
a Structure of the hg19 Y chromosome showing the different sequence classes using coordinates from [20]. The black vertical lines represent the uniquely mappable positions used for the analysis (see the “Materials and methods” section). The legend indicates the number of uniquely mappable positions and the proportion of each sequence class included in the analysis. b Neighbor-joining tree of a Y chromosome phylogeny comprising two Neandertals [1, 15], four ancient humans [–14] and twenty nine present-day humans [7, 9, 10] with associated relative branch length differences (i.e., the difference in branch length normalized by the total number of sites used for the comparison) compared to a present-day non-African Y chromosome (R1b1a2a1a2b). The haplogroup names are taken from the respective publications. The colors indicate the population of origin. The ancient individuals and their estimated ages are marked in bold. The crosses denote the expected relative branch length differences for the ancient individuals based on their estimated ages and assuming a constant mutation rate of 7.34×10⁻¹⁰ mutations/bp/year [1]. The error bars represent 95% confidence intervals (CIs) computed by resampling branch lengths from a Poisson distribution as described in Petr et al. [1]
Fig. 2
Fig. 2
a Mutation rates (in units of mutations/bp/year) required to explain the branch lengths of the Y chromosomes that are highly diverged from the human reference. The dashed lines and percentages represent the branch shortening relative to the R1b1a2a1a2b branch (or the expected length given the age for Mezmaiskaya 2). The colors indicate the branches of the tree and their corresponding mutation rate. b Percentage change in branch length as a function of the past male generation time (x-axis) compared to the branch length assuming a male generation time of 32 years, a large value within the range of the estimated male generation time in modern populations [22]. The dashed lines correspond to the change in branch length assuming a generation time of 28 or 36 years
Fig. 3
Fig. 3
a Relative branch length differences compared to a present-day non-African lineage (G2b1) using variants called from alignments to three different reference genomes (shown with different colors). The error bars correspond to 95% CIs computed by resampling branch lengths from a Poisson distribution. b Branch lengths for three present-day A lineages (A00, A0a1, and A1a, as indicated in each panel) since their last common ancestor with a present-day non-African lineage (G2b1) using variants called from alignments to two different reference genomes (shown with different colors). The solid lines represent the branch length of the respective A lineage and the dashed lines represent the branch length of the G2b1 lineage. The results with the alignments to the T2T reference genome are similar to those obtained with the hg19 reference, and are not shown for simplicity
Fig. 4
Fig. 4
Comparing the number of mutations on divergent Y chromosomes to non-divergent Y chromosomes for different maximum human-chimp sequence divergence filters (lower x-axis). The upper x-axis represents the average number of positions (in Mb) used for each comparison. The colors correspond to the three divergent Y chromosomes (A00, A0a1, and B-M181). The shaded area indicates the divergence filters that minimize the branch length variation while maximizing the proportion of the Y chromosome available for further analysis. The error bars denote 95% CIs computed by resampling branch lengths from a Poisson distribution
Fig. 5
Fig. 5
a Trees depicting the lineages used to estimate the TMRCA of all modern humans and the TMRCA of modern humans and Neandertals. The lineage of the radiocarbon dated ancient modern human, Ust’Ishim, used to calculate the mutation rate, is also shown. b TMRCA estimates between the Y chromosomes on the x-axis and 16 non-African Y chromosomes. Each dot represents the TMRCA with one non-African Y chromosome. The top plot shows the TMRCAs estimated by measuring the non-African branch, while the bottom plot shows the TMRCAs estimated by measuring the A00 branch. The dots in color represent the TMRCA estimates based on the the filtered Y, while the dots in gray represent the TMRCAs estimated using the unfiltered Y chromosome. The vertical lines denote 95% CIs computed by resampling branch lengths from a Poisson distribution. The dashed horizontal lines represent the mean TMRCAs computed over all non-African Y chromosomes and the solid horizontal lines show overall 95% CIs
Fig. 6
Fig. 6
Y chromosome phylogeny reconstructed with BEAST. The TMRCA estimates, as well as the estimated age of Chagyrskaya 2 (shown in the branch label), and their respective 95% HPD intervals are indicated on the tree. The ages of the other ancient samples were set to the estimated radiocarbon dates. The haplogroups from different populations are highlighted with different colors. The branches are to scale, in thousands of years (ka)
Fig. 7
Fig. 7
Estimating the age of the radiocarbon dated A00 individual (radiocarbon date 8 ka) using molecular dating of the Y chromosome with BEAST. Phylogenies based on the filtered (a) and the unfiltered (b) Y chromosome are shown. The branches corresponding to 22 Y chromosomes included in the analysis (Additional file 1: Table S1) were collapsed. The TMRCA estimates and their 95% HPD intervals are indicated on the tree. The age of the A00 individual, along with its associated 95% HPD interval, is indicated in the branch label

References

    1. Petr M, Hajdinjak M, Fu Q, Essel E, Rougier H, Crevecoeur I, et al. The Evolutionary History of Neanderthal and Denisovan Y Chromosomes. Science. 2020;369(6511):1653–6. 10.1126/science.abb6460. - PubMed
    1. Wei W, Ayub Q, Chen Y, McCarthy S, Hou Y, Carbone I, et al. A Calibrated Human Y-chromosomal Phylogeny Based on Resequencing. Genome Res. 2013;23(2):388–95. 10.1101/gr.143198.112. - PMC - PubMed
    1. Scozzari R, Massaia A, Trombetta B, Bellusci G, Myres NM, Novelletto A, et al. An Unbiased Resource of Novel SNP Markers Provides a New Chronology for the Human Y Chromosome and Reveals a Deep Phylogenetic Structure in Africa. Genome Res. 2014;24(3):535–44. 10.1101/gr.160788.113. - PMC - PubMed
    1. Hallast P, Batini C, Zadik D, Maisano Delser P, Wetton JH, Arroyo-Pardo E, et al. The Y-Chromosome Tree Bursts into Leaf: 13,000 High-Confidence SNPs Covering the Majority of Known Clades. Mol Biol Evol. 2015;32(3):661–73. 10.1093/molbev/msu327. - PMC - PubMed
    1. Barbieri C, Hübner A, Macholdt E, Ni S, Lippold S, Schröder R, et al. Refining the Y Chromosome Phylogeny with Southern African Sequences. Hum Genet. 2016;135(5):541–53. 10.1007/s00439-016-1651-0. - PMC - PubMed

LinkOut - more resources