

Regional antimicrobial resistance gene flow among the One Health sectors in China
- PMID: 39763003
- PMCID: PMC11705761
- DOI: 10.1186/s40168-024-01983-x
Regional antimicrobial resistance gene flow among the One Health sectors in China
Abstract
Background: Antimicrobial resistance poses a significant threat to global health, with its spread intricately linked across human, animal, and environmental sectors. Revealing the antimicrobial resistance gene (ARG) flow among the One Health sectors is essential for better control of antimicrobial resistance.
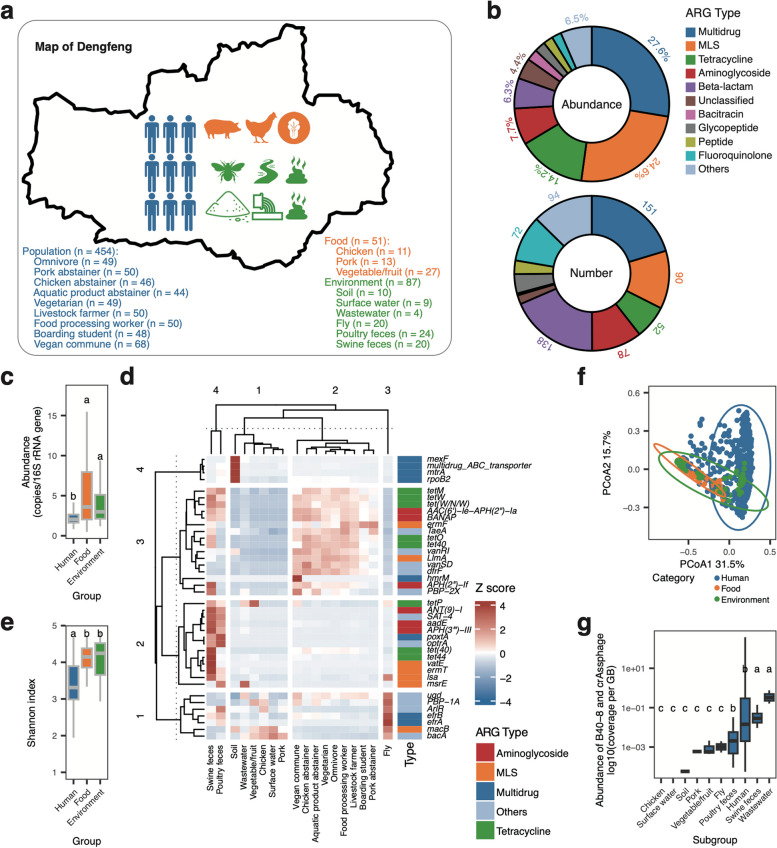
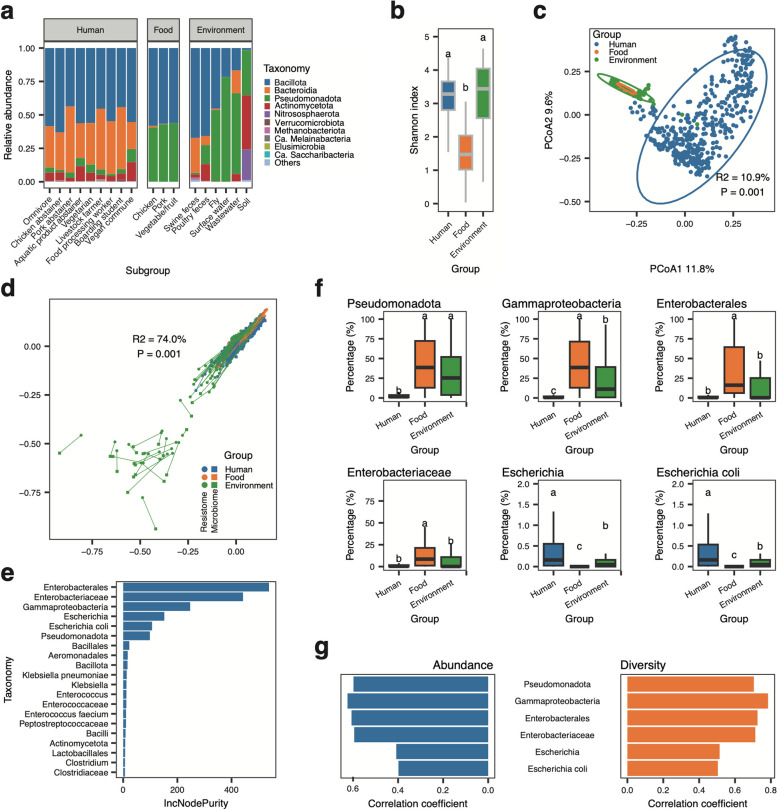
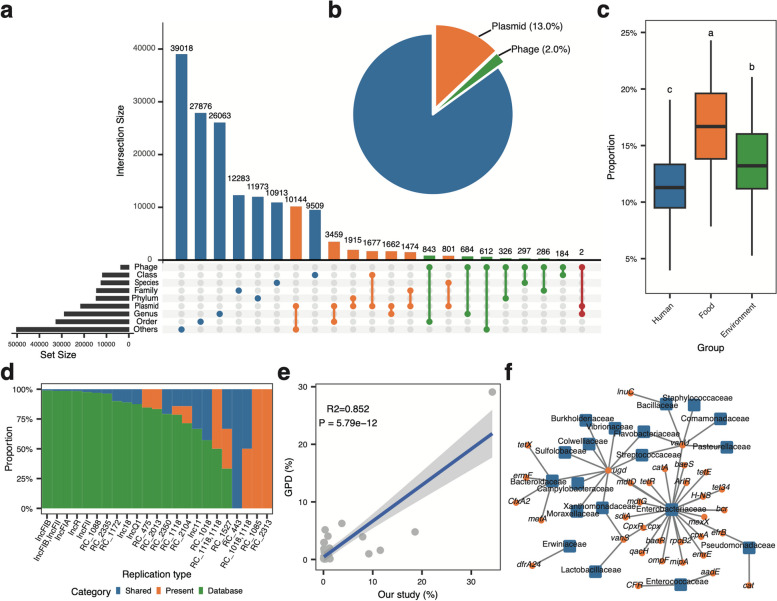
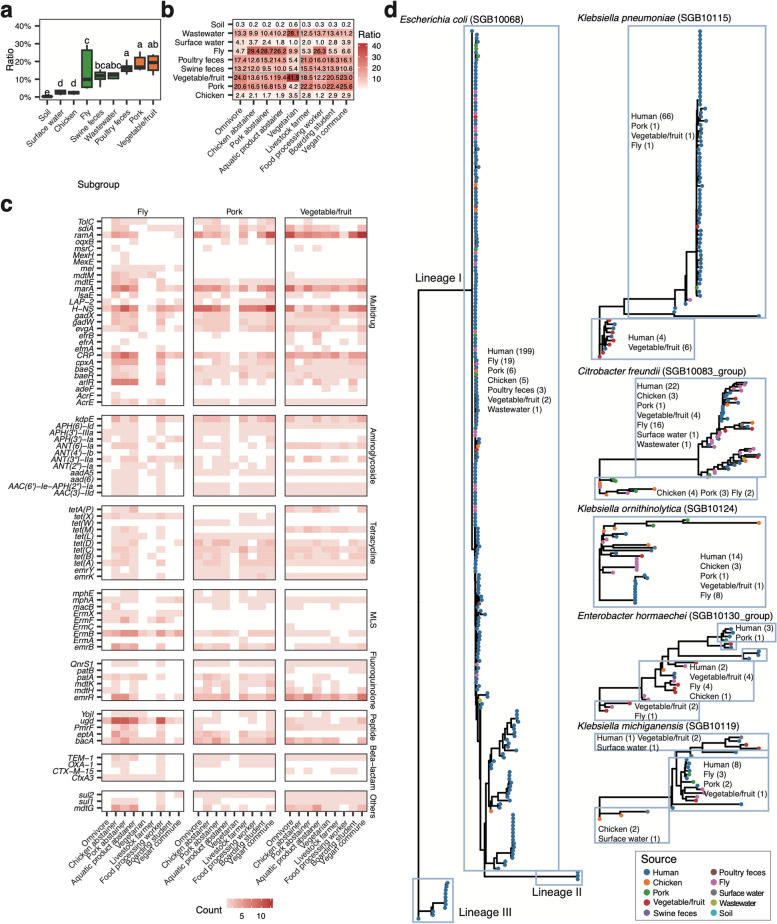
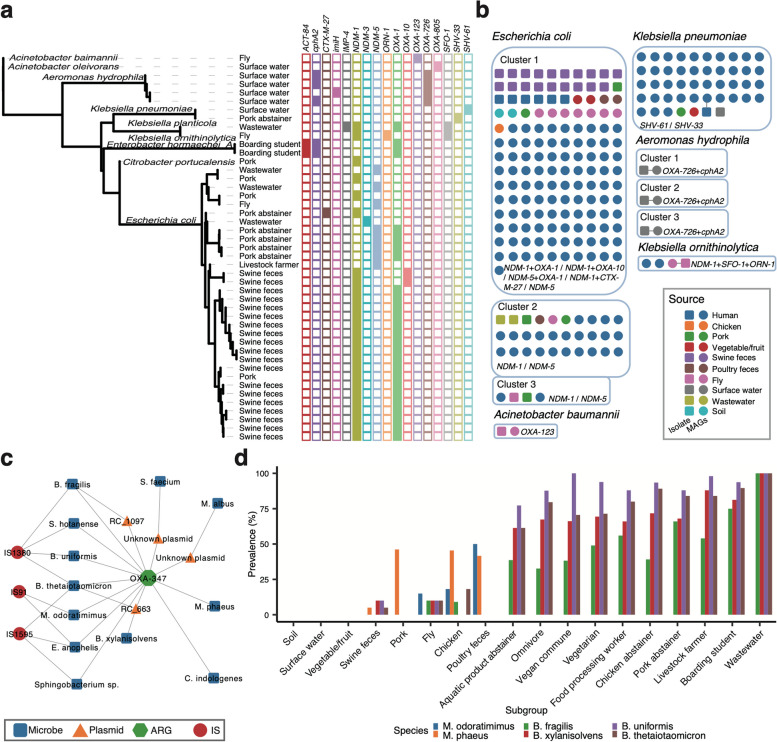
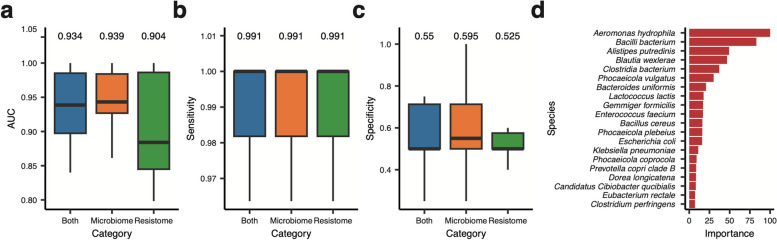
Results: In this study, we investigated regional ARG transmission among humans, food, and the environment in Dengfeng, Henan Province, China by combining large-scale metagenomic sequencing with culturing of resistant bacterial isolates in 592 samples. A total of 40 ARG types and 743 ARG subtypes were identified, with a predominance of multidrug resistance genes. Compared with microbes from human fecal samples, those from food and environmental samples showed a significantly higher load of ARGs. We revealed that dietary habits and occupational exposure significantly affect ARG abundance. Pseudomonadota, particularly Enterobacteriaceae, were identified as the main ARG carriers shaping the resistome. The resistome in food samples was found more affected by mobile genetic elements (MGEs), whereas in environmental samples, it was more associated with the microbial composition. We evidenced that horizontal gene transfer (HGT) mediated by plasmids and phages, together with strain transmission, particularly those associated with the Enterobacteriaceae members, drive regional ARG flow. Lifestyle, dietary habits, and occupational exposure are all correlated with ARG dissemination and flies and food are important potential sources of ARGs to humans. The widespread mobile carbapenemase gene, OXA-347, carried by non-Enterobacteriaceae bacteria in the human gut microbiota, requires particular attention. Finally, we showed that machine learning models based on microbiome profiles were effective in predicting the presence of carbapenem-resistant strains, suggesting a valuable approach for AMR surveillance.
Conclusions: Our study provides a full picture of regional ARG transmission among the One Health sectors in a county-level city in China, which facilitates a better understanding of the complex routes of ARG transmission and highlights new points of focus for AMR surveillance and control. Video Abstract.
Keywords: Antimicrobial resistance gene; Carbapenemase; Mobile genetic element; One Health; Transmission pathway.
© 2025. The Author(s).
Conflict of interest statement
Declarations. Ethics approval and consent to participate: This study was conducted in compliance with the recommendations of the Declaration of Helsinki and the Ethics Committee of the Institute of Infectious Disease Prevention and Control, Henan Center for Disease Control and Prevention (ethical approval number: 2015-YM-006–02). Consent for publication: Not applicable. Competing interests: The authors declare no competing interests.
Figures
Similar articles
-
Metagenomic analysis of human, animal, and environmental samples identifies potential emerging pathogens, profiles antibiotic resistance genes, and reveals horizontal gene transfer dynamics.Sci Rep. 2025 Apr 9;15(1):12156. doi: 10.1038/s41598-025-90777-8. Sci Rep. 2025. PMID: 40204742 Free PMC article.
-
The interplay between mobilome and resistome in Staphylococcus aureus.mBio. 2024 Oct 16;15(10):e0242824. doi: 10.1128/mbio.02428-24. Epub 2024 Sep 17. mBio. 2024. PMID: 39287446 Free PMC article.
-
Assessing antimicrobial resistance in pasture-based dairy farms: a 15-month surveillance study in New Zealand.Appl Environ Microbiol. 2024 Nov 20;90(11):e0139024. doi: 10.1128/aem.01390-24. Epub 2024 Oct 23. Appl Environ Microbiol. 2024. PMID: 39440981 Free PMC article.
-
Good microbes, bad genes? The dissemination of antimicrobial resistance in the human microbiome.Gut Microbes. 2022 Jan-Dec;14(1):2055944. doi: 10.1080/19490976.2022.2055944. Gut Microbes. 2022. PMID: 35332832 Free PMC article. Review.
-
Genetic diversity and risk factors for the transmission of antimicrobial resistance across human, animals and environmental compartments in East Africa: a review.Antimicrob Resist Infect Control. 2020 Aug 6;9(1):127. doi: 10.1186/s13756-020-00786-7. Antimicrob Resist Infect Control. 2020. PMID: 32762743 Free PMC article. Review.
References
-
- Hernando-Amado S, Coque TM, Baquero F, Martínez JL. Defining and combating antibiotic resistance from One Health and Global Health perspectives. Nat Microbiol. 2019;4:1432–42. - PubMed
-
- Liu J-H, Liu Y-Y, Shen Y-B, Yang J, Walsh TR, Wang Y, et al. Plasmid-mediated colistin-resistance genes: mcr. Trends Microbiol. 2024;32:365–78. - PubMed
-
- Walsh TR, Weeks J, Livermore DM, Toleman MA. Dissemination of NDM-1 positive bacteria in the New Delhi environment and its implications for human health: An environmental point prevalence study. Lancet Infect Dis. 2011;11:355–62. - PubMed
-
- Liu YY, Wang Y, Walsh TR, Yi LX, Zhang R, Spencer J, et al. Emergence of plasmid-mediated colistin resistance mechanism MCR-1 in animals and human beings in China: A microbiological and molecular biological study. Lancet Infect Dis. 2016;16:161–8. - PubMed
MeSH terms
Substances
Grants and funding
LinkOut - more resources
Full Text Sources
Medical
