

This is a preprint.
Uncovering the Biological Toll of Neighborhood Physical Disorder: Links to Metabolic and Inflammatory Biomarkers in Older Adults
- PMID: 39763552
- PMCID: PMC11703287
- DOI: 10.1101/2024.12.23.24319571
Uncovering the Biological Toll of Neighborhood Physical Disorder: Links to Metabolic and Inflammatory Biomarkers in Older Adults
Abstract
Background: Neighborhood physical disorder has been linked to adverse health outcomes, yet longitudinal assessments of its relationship with metabolic and inflammatory biomarkers in older adults remain limited. This study examined the association between patterns of neighborhood physical disorder exposure and biomarkers among older adults.
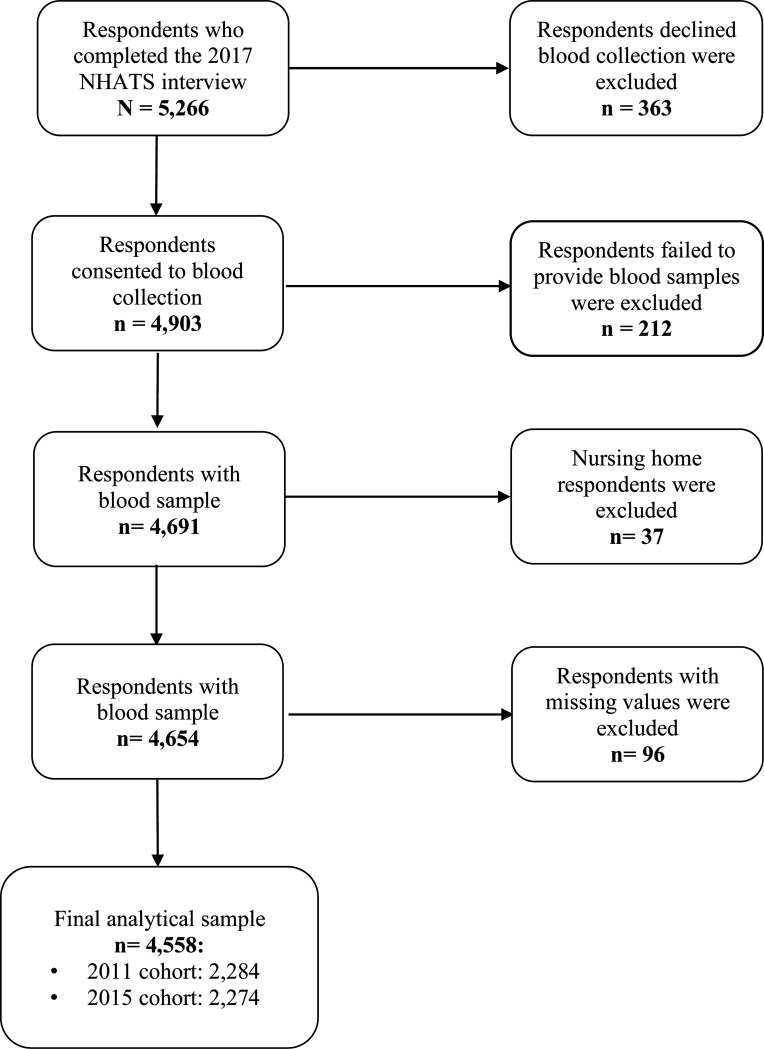
Methods: We included community-dwelling Medicare beneficiaries with 2017 biomarker data from the National Health and Aging Trends Study (n = 4,558). Neighborhood physical disorder from 2011 to 2016 was assessed using interviewer reports of neighborhood characteristics. Latent class analysis was employed to identify longitudinal patterns of exposure. Inverse probability weighted linear regression models were used to examine associations between physical disorder patterns and five biomarkers, including body mass index (BMI), waist circumference, hemoglobin A1C (HbA1c), high-sensitivity C-reactive protein (hsCRP), and interleukin-6 (IL-6).
Results: Four classes of neighborhood physical disorder emerged: stable low exposure (85%), increased exposure (4%), decreased exposure (8%), and stable high exposure (3%). Regression findings indicate that residing in neighborhoods with stable high exposure was significantly associated with higher levels of BMI (b = 0.06, p<0.05), HbA1c (b = 0.09, p<0.05), hsCRP (b = 0.21, p < 0.05), and IL-6 (b = 0.22, p < 0.05), compared to those with stable low exposure. Older adults with increased exposure and decreased exposure also exhibited elevated risks in multiple metabolic and inflammation biomarkers.
Conclusions: Persistent exposure to neighborhood physical disorder is associated with higher levels of metabolic and inflammatory biomarkers, underscoring the need for targeted clinical screening and neighborhood initiatives to promote healthy aging in place.
Keywords: Latent class analysis; Metabolic and inflammation biomarkers; Neighborhood physical disorder.
Conflict of interest statement
Conflict of Interest: The authors declare that there is no conflict of interest.
Figures


References
-
- Sampson RJ, Raudenbush SW. Seeing Disorder: Neighborhood Stigma and the Social Construction of “Broken Windows.” Soc Psychol Q. 2004;67(4):319–342. doi: 10.1177/019027250406700401 - DOI
-
- Glymour MM, Mujahid M, Wu Q, White K, Tchetgen Tchetgen EJ. Neighborhood Disadvantage and Self-Assessed Health, Disability, and Depressive Symptoms: Longitudinal Results From the Health and Retirement Study. Annals of Epidemiology. 2010;20(11):856–861. doi: 10.1016/j.annepidem.2010.08.003 - DOI - PMC - PubMed
-
- Gustafsson PE, San Sebastian M, Janlert U, Theorell T, Westerlund H, Hammarström A. Life-Course Accumulation of Neighborhood Disadvantage and Allostatic Load: Empirical Integration of Three Social Determinants of Health Frameworks. Am J Public Health. 2014;104(5):904–910. doi: 10.2105/AJPH.2013.301707 - DOI - PMC - PubMed
Publication types
Grants and funding
LinkOut - more resources
Full Text Sources
Research Materials