. 2025 Jan 6;7(1):fcae459.
doi: 10.1093/braincomms/fcae459. eCollection 2025.

Contributions of connectional pathways to shaping Alzheimer's disease pathologies

Affiliations

Contributions of connectional pathways to shaping Alzheimer's disease pathologies

Salma Bougacha et al. Brain Commun. .

Abstract

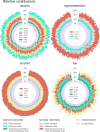
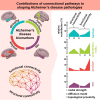
Four important imaging biomarkers of Alzheimer's disease, namely grey matter atrophy, glucose hypometabolism and amyloid-β and tau deposition, follow stereotypical spatial distributions shaped by the brain network of structural and functional connections. In this case-control study, we combined several predictors reflecting various possible mechanisms of spreading through structural and functional pathways to predict the topography of the four biomarkers in amyloid-positive patients while controlling for the effect of spatial distance along the cortex. For each biomarker, we quantified the relative contribution of each predictor to the variance explained by the model. We also compared the contribution between apolipoprotein E-ɛ4 carriers and non-carriers. We found that topological proximity to areas of maximal pathology through the functional connectome explained significant parts of variance for all biomarkers and that functional pathways totalized more than 30% of contributions for hypometabolism and amyloid load. By contrast, atrophy and tau load were mainly predicted by structural pathways, with major contributions from inter-regional diffusion. The ɛ4 allele modulated contributions to the four biomarkers in a way consistent with compromised brain connectomics in carriers. Our approach can be used to assess the contribution of concurrent mechanisms in other neurodegenerative diseases and the possible modifying impact of relevant factors on this contribution.

Keywords: Alzheimer’s disease; functional connectivity; pathology spreading; relative importance analysis; structural connectivity.


Conflict of interest statement

The authors report no competing interests.

Figures
Graphical Abstract
Graphical Abstract
Figure 1
Figure 1
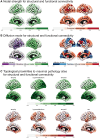
Graph metrics extracted from structural and functional connectivity networks. (A) Nodal strength for structural and functional connectivity. (B) Diffusion modes for structural and functional connectivity, with the associated diffusion clusters. (C) Topological proximity to the maximal pathology sites for structural and functional connectivity. Values have been linearly transformed to 0 minimum and 1 maximum to ease visual comparisons.
Figure 2
Figure 2
Relative contributions. Stacked bars represent the explained variance attributed to each predictor. Contributions with negative confidence intervals lower bound are grouped into the ‘non-significant’ bars. Significant contributions from the confounding variables (extracted from the cortical distance network) are grouped into the ‘cortical distance’ bars. Legend values are the average contributions across all cross-validation test sets. Fluctuations reflect variability across 200 random samples out of the 1000 cross-validation test samples. The contributors are ordered from interior to exterior according to their increasing magnitude of average contribution (except for the ‘non-significant’ bars placed at the bottom of the stacks). The maximal pathology sites are biomarker-specific and considered as proxies for epicentres.
Figure 3
Figure 3
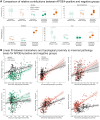
Comparison of APOE-ɛ4-positive and negative groups. (A) Comparison of predictors’ significant contributions. Participants (n = 212, except for the tau-PET sample where n = 74) were evenly distributed across the APOE-ɛ4 carrier and non-carrier groups. Groups were marched for age, sex, education and clinical status, and compared using Fisher–Pitman permutation test. P-values were corrected for multiple comparisons using the Bonferroni correction and are reported as Pcorrected < 0.05 by multiplying the original P-value by the number of comparisons. Atrophy: stat = −0.46, Pcorrected = 3.22; stat = −32.7, Pcorrected < 0.000; stat = −15.1, Pcorrected < 0.000; stat = 16.0, Pcorrected < 0.000 and stat = 30.2, Pcorrected < 0.000; for structural and diffusions modes, structural nodal strength, structural and functional topology proximities, respectively. Hypometabolism: stat = −1.45, Pcorrected = 0.46; stat = −11.1, Pcorrected < 0.000 and stat = 31.9, Pcorrected < 0.000; for structural diffusion mode, functional node strength and functional topology proximity, respectively. Amyloid: stat = −38.4, Pcorrected < 0.000; stat = −37.0, Pcorrected < 0.000 and stat = 46.4, Pcorrected < 0.000; for functional nodal strength, structural and functional topology proximities, respectively. Tau: stat = −52.3, Pcorrected < 0.000; stat = −44.0, Pcorrected < 0.000; stat = 0.12, Pcorrected = 3.63 and stat = 40.9, Pcorrected < 0.000; for structural diffusion mode, structural nodal strength, structural and functional topology proximities, respectively. (B) Linear fit between biomarkers and topological proximity to maximal pathology areas. Participants (n = 212 except for tau-PET were n = 74) were evenly distributed across the APOE-ɛ4 carrier and non-carrier groups. Biomarkers were estimated as W-score from all participants. Topological proximity was computed as the inverse of the average shortest path length across all the maximal pathology areas. APOE, apolipoprotein E.

References

    1. Saper CB, Wainer BH, German DC. Axonal and transneuronal transport in the transmission of neurological disease: Potential role in system degenerations, including Alzheimer’s disease. Neuroscience. 1987;23(2):389–398. - PubMed
    1. Seeley WW, Crawford RK, Zhou J, Miller BL, Greicius MD. Neurodegenerative diseases target large-scale human brain networks. Neuron. 2009;62(1):42–52. - PMC - PubMed
    1. Lehmann M, Madison CM, Ghosh PM, et al. . Intrinsic connectivity networks in healthy subjects explain clinical variability in Alzheimer’s disease. Proc Natl Acad Sci U S A. 2013;110(28):11606–11611. - PMC - PubMed
    1. Buckner RL, Snyder AZ, Shannon BJ, et al. . Molecular, structural, and functional characterization of Alzheimers disease: Evidence for a relationship between default activity, amyloid, and memory. J Neurosci. 2005;25(34):7709–7717. - PMC - PubMed
    1. Hansson O, Grothe MJ, Strandberg TO, et al. . Tau pathology distribution in Alzheimer’s disease corresponds differentially to cognition-relevant functional brain networks. Front Neurosci. 2017;11(MAR):167. - PMC - PubMed

LinkOut - more resources