. 2024 Dec 23:15:1509051.
doi: 10.3389/fimmu.2024.1509051. eCollection 2024.

Effects of chemoradiotherapy on surface PD-L1 expression in esophageal cancer and its implications for immunotherapy

Affiliations

Effects of chemoradiotherapy on surface PD-L1 expression in esophageal cancer and its implications for immunotherapy

Lovis Hampe et al. Front Immunol. .

Abstract

Background: Esophageal cancer has a poor prognosis despite treatment advancements. Although the benefit of neoadjuvant chemoradiotherapy (CRT) followed by adjuvant immunotherapy is evident, the effects of CRT on PD-L1 expression in esophageal cancer are not well understood. This study examines the impact of neoadjuvant CRT on PD-L1 surface expression in esophageal cancer both in vitro and in vivo considering its implications for immunotherapy.

Methods: PD-L1 expression dynamics were assessed in esophageal adenocarcinoma (EAC) and esophageal squamous cell carcinoma (ESCC) cell lines (OE-33, FLO-1, KYSE-180) treated with Carboplatin, Paclitaxel, radiotherapy (RT), and CRT. PD-L1 expression was measured by flow cytometry at 48- and 72 hours post-treatment. Temporal changes of surface PD-L1 were further investigated in KYSE-180 cells following RT, up to 168h after treatment. Additionally, PD-L1 expression was analyzed via immunohistochemistry in histological samples from 19 patients (9 EAC, 10 ESCC) treated with neoadjuvant CRT according to the CROSS-scheme.

Results: PD-L1 expression was upregulated the most by Carboplatin, a combination of chemotherapy, or CRT in all cell lines. Higher irradiation doses were more effective in inducing PD-L1 expression, while Paclitaxel alone did not consistently increase PD-L1. The ESCC cell line KYSE-180 showed the highest relative PD-L1 increase. Measurement of PD-L1 kinetics revealed a transient upregulation of surface PD-L1, which peaked at 72 hours post-treatment and subsequently returned to baseline levels by 168 hours. In vivo, data demonstrated no significant PD-L1 expression changes when comparing pre- and post-treatment levels.

Conclusions: Chemotherapy, RT, and CRT can induce PD-L1 expression in various esophageal cancer cell lines. However, neoadjuvant CRT according to the CROSS protocol does not significantly induce PD-L1 in vivo. Considering the difference in time between pre- and post-therapeutic measurements, these findings suggest that PD-L1 upregulation due to neoadjuvant therapy may be transient in vivo as well. This highlights the potential benefit of administering immunotherapy in a neoadjuvant setting.

Keywords: CROSS; checkmate-577; esophageal cancer; immunotherapy; programmed-death-ligand-1.


Conflict of interest statement

The authors declare that the research was carried out without any commercial or financial relationships that could be interpreted as a potential conflict of interest. The author(s) declared that they were an editorial board member of Frontiers, at the time of submission. This had no impact on the peer review process and the final decision.

Figures
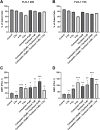
Figure 1
Figure 1
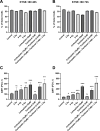
Number of gated cells (A, B) and surface PD-L1 expression (C, D) were analyzed via flow cytometry in low baseline PD-L1 EAC cell line FLO-1, 48 and 72 hours after treatment. Delta mean fluorescence intensity (ΔMFI) was calculated by subtracting the mean fluorescence intensity of anti-PD-L1 samples from the respective isotype control samples. FlowJo v10.10 software was used to analyze at least 10,000 events. Statistical significance is indicated as follows: *p < 0.05; **p < 0.01; ***p < 0.001, with error bars representing the standard error of the mean (SEM). ns stands for "not significant".
Figure 2
Figure 2
Number of gated cells (A, B) and surface PD-L1 expression (C, D) were analyzed via flow cytometry in mid baseline PD-L1 ESCC cell line KYSE-180, 48 and 72 hours after treatment. Delta mean fluorescence intensity (ΔMFI) was calculated by subtracting the mean fluorescence intensity of anti-PD-L1 samples from the respective isotype control samples. FlowJo v10.10 software was used to analyze at least 10,000 events. Statistical significance is indicated as follows: *p < 0.05; **p < 0.01; ***p < 0.001, with error bars representing the standard error of the mean (SEM). ns stands for "not significant".
Figure 3
Figure 3
Cell block of KYSE-180 ESCC cell line stained with an anti-PD-L1 antibody via immunohistochemistry at 72-hour timepoint after treatment (A, B). Untreated control (A) is depicted next to treated sample (B) (Carboplatin 10μM, Paclitaxel 1nm, 4Gy). Images are shown at 10x magnification. CRT, chemoradiotherapy.
Figure 4
Figure 4
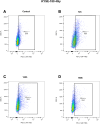
Pseudocolor plots illustrating the dynamic changes in surface PD-L1 expression at 72 hours (B), 120 hours (C), and 168 hours (D), compared to the untreated control (A), following exposure to 4 Gy radiotherapy in the EAC cell line KYSE-180. Gating was performed based on the corresponding isotype control for treatment condition, displayed in Supplementary Figure 13 .
Figure 5
Figure 5
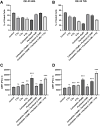
Number of gated cells (A, B) and surface PD-L1 expression (C, D) were analyzed via flow cytometry in high baseline PD-L1 EAC cell line OE-33, 48 and 72 hours after treatment. Delta mean fluorescence intensity (ΔMFI) was calculated by subtracting the mean fluorescence intensity of anti-PD-L1 samples from the respective isotype control samples. FlowJo v10.10 software was used to analyze at least 10,000 events. Statistical significance is indicated as follows: *p < 0.05; **p < 0.01; ***p < 0.001, with error bars representing the standard error of the mean (SEM). ns stands for "not significant".
Figure 6
Figure 6
Representative images of immunohistochemical staining with anti-PD-L1 antibody in esophageal cancer patients (A, B). A PD-L1 positive sample (A) is shown next to a negative sample (B). All images are shown at 10x magnification.
Figure 7
Figure 7
Alteration in PD-L1 surface expression in n = 19 patients treated with neoadjuvant chemoradiotherapy according to CROSS protocol. Scores as stated (A) Tumor Proportion Score, (B) Combined Positive Score, (C) Immune Cells. Wilcoxon signed rank test was used for statistical analysis with statistical significance set as p < 0,05. CRT, chemoradiotherapy.

References

    1. Uhlenhopp DJ, Then EO, Sunkara T, Gaduputi V. Epidemiology of esophageal cancer: update in global trends, etiology and risk factors. Clin J Gastroenterol. (2020) 13:1010–21. doi: 10.1007/s12328-020-01237-x - DOI - PubMed
    1. Liu C, Ma Y, Qin Q, Wang P, Luo Y, Xu P, et al. . Epidemiology of esophageal cancer in 2020 and projections to 2030 and 2040. Thorac Cancer. (2022) 14:3–11. doi: 10.1111/1759-7714.14745 - DOI - PMC - PubMed
    1. Alsop BR, Sharma P. Esophageal cancer. Gastroenterol Clinics North America. (2016) 45:399–412. doi: 10.1016/j.gtc.2016.04.001 - DOI - PubMed
    1. Siegel RL, Miller KD, Fuchs HE, Jemal A. Cancer statistics, 2021. CA: A Cancer J Clin. (2021) 71:7–33. doi: 10.3322/caac.21654 - DOI - PubMed
    1. Eyck BM, van Lanschot JJB, Hulshof MCCM, van der Wilk BJ, Shapiro J, van Hagen P. Ten-year outcome of neoadjuvant chemoradiotherapy plus surgery for esophageal cancer: the randomized controlled CROSS trial. JCO. 20. (2021) 39:1995–2004. doi: 10.1200/JCO.20.03614 - DOI - PubMed

MeSH terms

Supplementary concepts