[Preprint]. 2024 Dec 17:2024.12.17.628970.
doi: 10.1101/2024.12.17.628970.

Deep mutational scanning of rabies glycoprotein defines mutational constraint and antibody-escape mutations

Affiliations

Deep mutational scanning of rabies glycoprotein defines mutational constraint and antibody-escape mutations

Arjun K Aditham et al. bioRxiv. .

Update in

Abstract

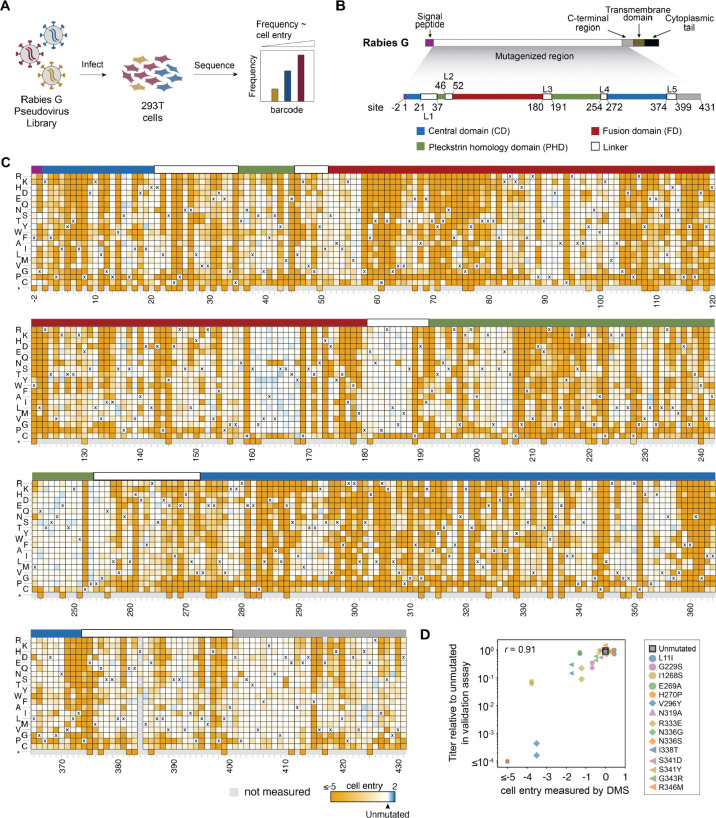
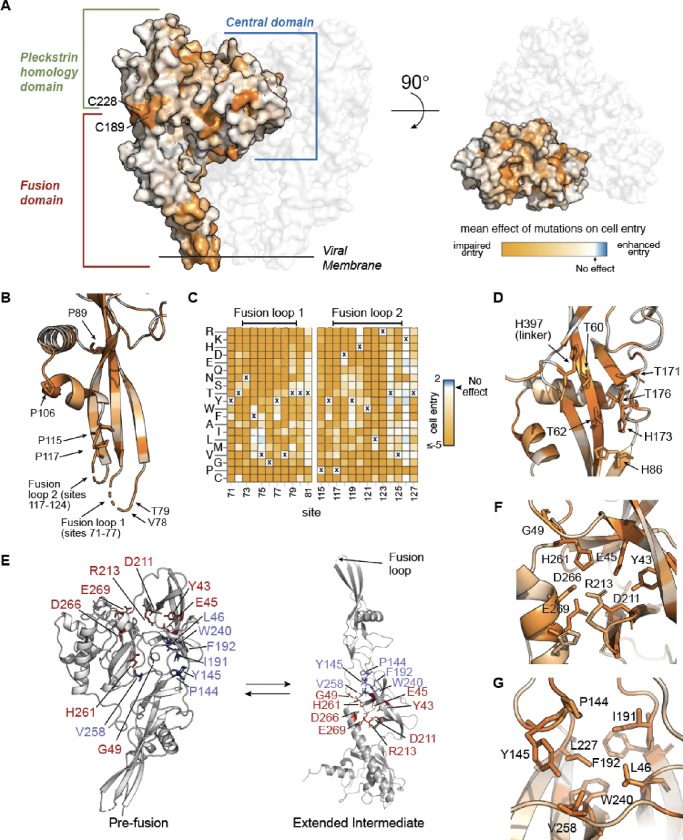
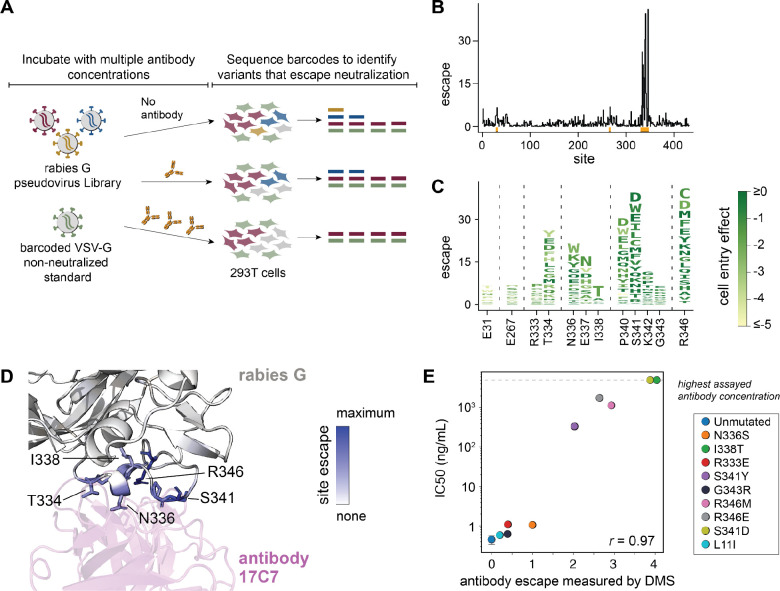
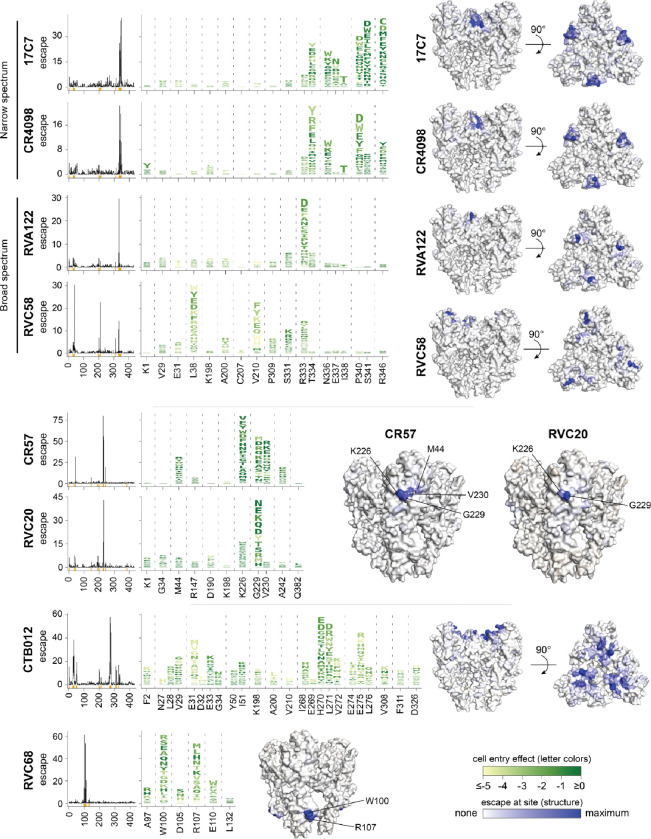
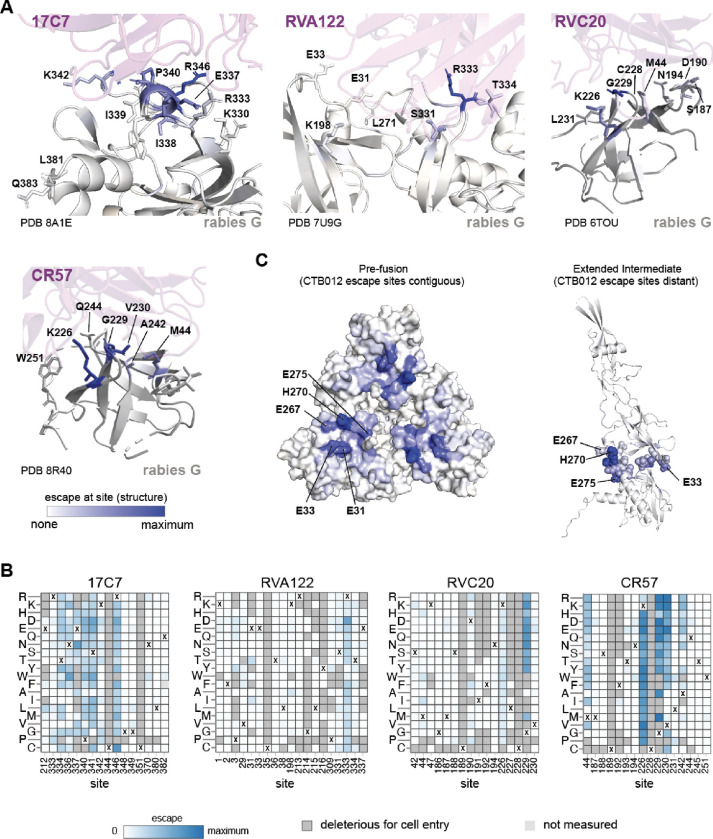
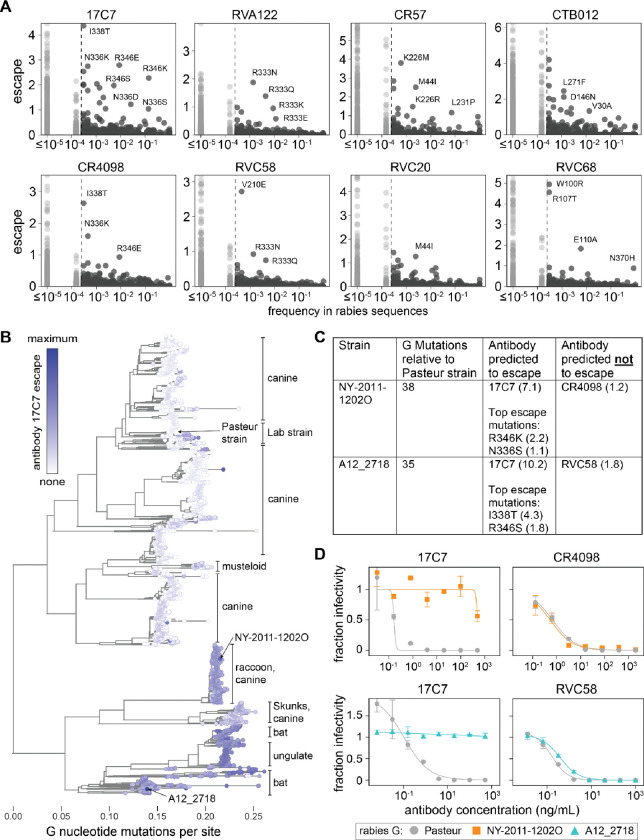
Rabies virus causes nearly 60,000 human deaths annually. Antibodies that target the rabies glycoprotein (G) are being developed as post-exposure prophylactics, but mutations in G can render such antibodies ineffective. Here, we use pseudovirus deep mutational scanning to measure how all single amino-acid mutations to G affect cell entry and neutralization by a panel of antibodies. These measurements identify sites critical for rabies G's function, and define constrained regions that are attractive epitopes for clinical antibodies, including at the apex and base of the protein. We provide complete maps of escape mutations for eight monoclonal antibodies, including some in clinical use or development. Escape mutations for most antibodies are present in some natural rabies strains. Overall, this work provides comprehensive information on the functional and antigenic effects of G mutations that can help inform development of stabilized vaccine antigens and antibodies that are resilient to rabies genetic variation.


Conflict of interest statement

Competing interests JDB consults on topics related to viral evolution for Apriori Bio, Invivyd, the Vaccine Company, Pfizer, and Moderna. JDB, AKA, and CER are inventors on Fred Hutch licensed patents related to viral deep mutational scanning. N.P.K. is a cofounder, shareholder, paid consultant, and chair of the scientific advisory board of Icosavax, Inc. The King lab has received unrelated sponsored research agreements from Pfizer and GlaxoSmithKline.

Figures

Figure 1.
Figure 1.. Deep mutational scanning of rabies G.
(A) We create libraries of pseudoviruses expressing different mutants of G on their surface and encoding identifying nucleotide barcodes in their genomes. These libraries are used to infect cells in various conditions, and barcodes from viruses that successfully infect are deep sequenced to quantify the effects of mutations. (B) Schematic showing region of rabies G mutagenized in our libraries. We use the conventional numbering scheme where site 1 is assigned to the first site of ectodomain. In this numbering scheme, we mutagenized from site −2 to site 431. (C) Effects of mutations on G-mediated cell entry. Each column of the heatmap shows the effects of different amino acids at that site on cell entry, with the amino acid identity in the unmutated Pasteur strain G indicated with a “X”. Mutations that impair cell entry are colored orange, mutations that do not affect cell entry are white, and mutations that enhance cell entry are blue. Gray indicates mutations that were not reliably measured in the deep mutational scanning. The overlay bar indicates the regions of G. See https://dms-vep.org/RABV_Pasteur_G_DMS/cell_entry.html for an interactive version of this heatmap. (D) Validation of deep mutational scanning measurements of mutational effects on cell entry. For each of the 16 mutations (which were chosen to span a range of cell entry effects), the x-axis shows the effect measured in the deep mutational scanning (DMS) while the y-axis shows the titers of individual pseudoviruses generated with that G protein mutant relative to the unmutated parent. Two independent validation measurements of the titers were made for each mutation, hence there are two points per mutation in the plot. The r indicates the Pearson correlation.
Figure 2.
Figure 2.. Functional constraints in the context of rabies G’s structure
(A) Pre-fusion G structure (PDB: 7U9G) with two transparent protomers and one protomer colored by mean effect of all mutations at each site on cell entry. Sites are colored orange when mutations impair cell entry, and white when they have no effect. See https://dms-vep.org/RABV_Pasteur_G_DMS/cell_entry.html#mutation-effects-on-structure-of-g for interactive structural visualizations of the effects of mutations. (B) Zoomed view of the fusion domain of a single protomer of pre-fusion G with sites colored by the mean effects of mutations on cell entry. The fusion loops are not resolved in the structure and are modeled as dashed cartoon loops. (C) Heatmaps showing the effects on cell entry of all mutations in the fusion loops and flanking sites. The parental amino-acid identities in the Pasteur strain G are indicated with “X.” (D) Zoomed view of a single protomer of pre-fusion G highlighting the histidine cluster and structurally adjacent threonines that may act as a pH sensor. Sites are colored by the mean effect mutations on cell entry as in (A). (E) A single promoter of G shown in both the pre-fusion protomer and extended intermediate conformations (PDB 6LGW), with sites highlighted in panel F shown in red and sites highlighted in panel G shown in blue. (F) Zoomed view of the extended intermediate conformation showing sites that form polar interactions in this conformation. Sites are colored by the mean effects of mutations on cell entry as in (A). (G) Zoomed view of the extended intermediate conformation showing sites that form hydrophobic interactions in this conformation. Sites are colored by the mean effects of mutations on cell entry as in (A).
Figure 3.
Figure 3.. Deep mutational scanning of how G mutations affect antibody neutralization, as applied to antibody 17C7.
(A) Workflow for mapping effects of mutations on antibody neutralization. The rabies G pseudovirus library is mixed with a “non-neutralized standard” consisting of barcoded VSV-G pseudovirus, then this pool is incubated with different concentrations of antibody and used to infect 293T cells. Barcodes are recovered from infected cells and deep sequenced to quantify the ability of each variant to infect cells at each antibody concentration. The VSV-G non-neutralized standard pseudovirus is not affected by anti-rabies G antibodies, and so is used to convert the sequencing counts into the fraction of each variant that is neutralized at each antibody concentration. (B) Line plot showing the total escape caused by mutations at each site in G for antibody17C7. See https://dms-vep.org/RABV_Pasteur_G_DMS/escape.html for interactive visualizations of escape. Orange marks near the x-axis indicate sites zoomed in the logo plot in panel (C). (C) Logo plot with the height of each letter proportional to the escape caused by mutation to that amino acid for key sites of escape from antibody 17C7. The letters are colored according to the effect of each mutation on cell entry. (D) Structure of 17C7 and rabies G (PDB: 8A1E) with G colored by the total escape caused by mutations at each site (blue indicates sites where mutations cause the most escape). The antibody is shown in purple. (E) Validation assays comparing the escape measured in the deep mutational scanning (DMS) versus the IC50s measured in standard pseudovirus neutralization assays against antibody 17C7 for nine different single amino-acid mutants of G. Raw neutralization curves are in Fig S5. The mutations tested in these validation assays were chosen to span a range of escape values as measured in the deep mutational scanning. Pseudovirus with unmutated rabies G was measured in triplicate, and mean ± standard deviation is plotted.
Figure 4.
Figure 4.. Comprehensive maps of escape mutations for eight monoclonal antibodies.
For each antibody, the line plot shows the total escape caused by all mutations at that site; orange marks near the x-axis indicate sites zoomed in the logo plots. The logo plots show the escape caused by individual mutations at key sites, with letter heights proportional to escape value for mutation to that amino acid and letters colored according to the effects of mutations on cell entry (see color scale at the bottom right of the figure). The structures show pre-fusion rabies G (PDB: 7U9G) with residues colored by the total escape caused by mutations at each site (see color scale at bottom right of the figure). See Fig 5 for additional structural renderings of antibodies with experimentally solved structures in complex with G. See https://dms-vep.org/RABV_Pasteur_G_DMS/escape.html for interactive heatmaps and structure-based visualizations of escape.
Figure 5.
Figure 5.. Mutations at only some of the antibody contact sites in G mediate escape.
(A) G colored by extent of antibody escape at each site as measured in deep mutational scanning for the four antibodies with experimentally determined structures in complex with G (PDB 8A1E, 7U9G, 6TOU, and 8R40). The antibodies are shown in magenta. The color scale for G is defined at the lower left of the panel: white indicates no escape at the site, and blue indicates strong escape at the site. (B) Escape values for each mutation for all sites in G that contact each antibody in the experimentally determined structural complex. A site in G is defined as being in contact if any atom is within 4Å of the antibody. Mutations are colored white to blue based on the escape values measured in deep mutational scanning. Mutations that are too deleterious for cell entry to reliably measure their effect on antibody neutralization are shown in dark grey. The small number of mutations in light gray (eg. Q382F and K226H) have no measured escape due to insufficient coverage in the library. The amino-acid identity in the unmutated Pasteur G is indicated with a “X” for each site. (C) Structures of rabies G in pre-fusion (PDB 7U9G) and extended intermediate (PDB6LGW) conformations colored with sites colored by the total escape from the CTB012 antibody. Escape sites are contiguous in pre-fusion rabies G but more distant in extended intermediate conformation. For visibility, key sites are shown in spheres in the extended intermediate. Color scale is the same as for (A).
Figure 6.
Figure 6.. Naturally occurring antibody-escape mutations in rabies G.
(A) Frequency of each G amino-acid mutation among naturally occurring rabies sequences versus the escape caused by that mutation in the deep mutational scanning of the Pasteur strain G. Each panel shows escape from a different antibody. Dashed vertical lines indicate mutations observed at least two times in natural strains; points in light gray indicate rare mutations. Mutations not observed in natural strains are assigned a frequency of 10−5 to enable plotting on a log scale. See https://dms-vep.org/RABV_Pasteur_G_DMS/natural_seqs.html for an interactive version of this plot which allows mouseover of individual points to see the mutation identities. (B) Phylogenetic tree of all publicly available 7,122 rabies G sequences colored by escape from antibody 17C7 as predicted by the summing the experimentally measured effects of all mutations relative to the Pasteur strain. White indicates no escape and blue indicates strong escape. See https://nextstrain.org/groups/jbloomlab/dms/rabies-G for interactive Nextstrain phylogenies showing the predicted escape of all strains for each antibody. The tree is rooted by Gannoruwa bat lyssavirus (Accession: NC_031988.1), a non-rabies lyssavirus also in Phylogroup I. Strains experimentally tested in validation neutralization assays are labeled. Common hosts for different clades are labeled. The interactive Nextstrain phylogenies provides the option to label all strains by host. (C) For validation neutralization assays, we identified antibodies predicted to be escaped or neutralized by two different natural strains. The table summarizes the strains and antibodies used in the validation assays. The numbers in parentheses after the antibody names and mutations in the last two columns are the escape values from the deep mutational scanning. (D) Neutralization curves of pseudovirus expressing G from the Pasteur, NY-2011–12012O, or A12_2718 strains against the indicated antibodies. Points indicate the mean ± standard error of technical duplicates.

References

    1. Fooks A.R., Banyard A.C., Horton D.L., Johnson N., McElhinney L.M., and Jackson A.C. (2014). Current status of rabies and prospects for elimination. Lancet 384, 1389–1399. 10.1016/S0140-6736(13)62707-5. - DOI - PMC - PubMed
    1. Mollentze N., Biek R., and Streicker D.G. (2014). The role of viral evolution in rabies host shifts and emergence. Current Opinion in Virology 8, 68–72. 10.1016/j.coviro.2014.07.004. - DOI - PMC - PubMed
    1. Fisher C.R., Streicker D.G., and Schnell M.J. (2018). The spread and evolution of rabies virus: conquering new frontiers. Nat Rev Microbiol 16, 241–255. 10.1038/nrmicro.2018.11. - DOI - PMC - PubMed
    1. Singh R., Singh K.P., Cherian S., Saminathan M., Kapoor S., Manjunatha Reddy G.B., Panda S., and Dhama K. (2017). Rabies – epidemiology, pathogenesis, public health concerns and advances in diagnosis and control: a comprehensive review. Veterinary Quarterly 37, 212–251. 10.1080/01652176.2017.1343516. - DOI - PubMed
    1. Hampson K., Coudeville L., Lembo T., Sambo M., Kieffer A., Attlan M., Barrat J., Blanton J.D., Briggs D.J., Cleaveland S., et al. (2015). Estimating the Global Burden of Endemic Canine Rabies. PLoS Negl Trop Dis 9, e0003709. 10.1371/journal.pntd.0003709. - DOI - PMC - PubMed

Publication types

LinkOut - more resources