[Preprint]. 2024 Dec 17:2024.12.15.628587.
doi: 10.1101/2024.12.15.628587.

Molecular and spatial analysis of ganglion cells on retinal flatmounts: diversity, topography, and perivascularity

Affiliations

Molecular and spatial analysis of ganglion cells on retinal flatmounts: diversity, topography, and perivascularity

Nicole Y Tsai et al. bioRxiv. .

Update in

Abstract

Diverse retinal ganglion cells (RGCs) transmit distinct visual features from the eye to the brain. Recent studies have categorized RGCs into 45 types in mice based on transcriptomic profiles, showing strong alignment with morphological and electrophysiological properties. However, little is known about how these types are spatially arranged on the two-dimensional retinal surface-an organization that influences visual encoding-and how their local microenvironments impact development and neurodegenerative responses. To address this gap, we optimized a workflow combining imaging-based spatial transcriptomics (MERFISH) and immunohistochemical co-staining on thin flatmount retinal sections. We used computational methods to register en face somata distributions of all molecularly defined RGC types. More than 75% (34/45) of types exhibited non-uniform distributions, likely reflecting adaptations of the retina's anatomy to the animal's visual environment. By analyzing the local neighborhoods of each cell, we identified perivascular RGCs located near blood vessels. Seven RGC types are enriched in the perivascular niche, including members of intrinsically photosensitive RGC (ipRGC) and direction-selective RGC (DSGC) subclasses. Orthologous human RGC counterparts of perivascular types - Melanopsin-enriched ipRGCs and ON DSGCs - were also proximal to blood vessels, suggesting their perivascularity may be evolutionarily conserved. Following optic nerve crush in mice, the perivascular M1-ipRGCs and ON DSGCs showed preferential survival, suggesting that proximity to blood vessels may render cell-extrinsic neuroprotection to RGCs through an mTOR-independent mechanism. Overall, our work offers a resource characterizing the spatial profiles of RGC types, enabling future studies of retinal development, physiology, and neurodegeneration at individual neuron type resolution across the two-dimensional space.

Keywords: MERFISH; neuronal types; neuroprotection; perivascular neurons; retinal ganglion cells; spatial transcriptomics.


Conflict of interest statement

DECLARATION OF INTERESTS The authors declare no conflicts of interest.

Figures

Figure 1.
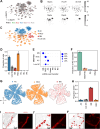
Figure 1.. Spatial transcriptomics of the ganglion cell layer (GCL) in thin retinal flatmount sections.
A. Illustration of mouse retina showing retinal ganglion cell (RGC) types (colors) in the GCL. Axons of RGCs project through the optic nerve to the rest of the brain. B. Schematic of a GCL flatmount showing RGCs and displaced amacrine cells (dACs) in various colors and non-neuronal cells, including blood vessels (NNs, red). C. Schematic of flatmount preparation. The dissected retina is flattened on filter paper via relieving cuts and cryo-sectioned into ~12μm thick sections. RGC types are highlighted in flatmount and sectional views. D. UMAP visualization of adult RGC diversity based on scRNA-seq atlas (Tran et al., 2019), MERFISH gene panel consisting of 140 genes optimized for RGC classification based on scRNA-seq atlas, and confusion matrix showing the performance of an XGBoost classifier trained on these genes. E. Validation accuracies of XGBoost classifier trained on various gene selection approaches. The validation of our 140-gene panel was compared to a 140-gene panel from random subsets of 2000 highly variable genes (HVGs). In addition, varying numbers of genes (45, 90, 135, 180) were selected by picking differentially expressed genes from each of the 45 clusters. Error bars: ±1 SD (n=10 random gene subsets). F. Overview of segmentation workflow. Cellpose is applied to identify cell somata from optical sections (left), which are stitched together for the final segmentation (right). Red denotes cells identified in the third optical section, while blue denotes additional cells identified in the other optical sections. G. Transcripts are visualized in an individual tissue section with the segmentation masks. Dots correspond to unique transcripts. Transcript colors correspond to marker genes for RGCs (Rbpms, Slc17a6; orange) and dACs (Chat, Tfap2a, Tfap2b; blue). H. As in G, highlighting transcripts for specific groups of RGC types. a-RGCs (Spp1), ipRGCs (Opn4 and Eomes), ON-OFF DSGCs (Cartpt).
Figure 2.
Figure 2.. MERFISH-based categorization of retinal ganglion cells (RGCs), displaced amacrine cells (dACs), and non-neuronal cells (NNs) in 2D flatmounts.
A. 2D visualization of cellular diversity in the MERFISH datasets. Cells are colored by their sample of origin (n=6 replicates). B. Same as A, with each cell shaded by marker gene expression level. Top row panels correspond to RGC markers Rbpms, Pou4f1, and Slc17a6. Bottom row panels correspond to AC markers Tfap2a, Tfap2b, and Chat. Note that while all ACs express Tfap2a and Tfap2b, Chat marks ON- starburst amacrine cells (ON-SACs). C. Same as A, with cells colored by their class of origin. RGCs and dACs are colored orange and blue, respectively, based on panel B. Non-neuronal cells (NNs, red) were identified using the XGBoost classifier (see Figure S2C). Low-quality cells (11%) are shown in grey. D. Quantification of RGC, AC, and NN proportions across replicates (dots). E. Confusion matrix comparing cell class assignments based on marker genes and XGBoost classification. Each row is normalized to add to a total of 100%. Notably, there are no assignments to horizontal cells (HCs), Photoreceptors (PRs), and bipolar cells (BCs), which are absent in the GCL. F. Composition of dAC subtypes grouped by neurotransmitter profiles, showing dominance of GABAergic ACs (n=6 replicates). G. Example retina displayed three times, highlighting RGCs (orange), ACs (blue), and the NNs (red) with axes indicating orientation. H. Proportions for each cell class categorized as CD31+ cells in MERFISH samples confirm the reliable assignment of CD31+ cells onto blood vessels (mean ± SD; n=6 replicates). I. Three regions (I, I’, I’’) highlighting blood vessels that can be traced using MERFISH. In each case, the left panel highlights NNs (red) among segmented cells, and the right panel shows immunostaining for CD31, an endothelial cell marker, in the same region.
Figure 3.
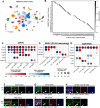
Figure 3.. MERFISH-based RGC type classification and histological validation of ipRGC types.
A. UMAP visualization of 35 MERFISH-based RGC clusters. B. Confusion matrix showing transcriptomic correspondence between MERFISH clusters 1–35 (rows) and RGC types C1-C45 (columns) defined previously using scRNA-seq (Tran et al., 2019). Darker grey shading indicates higher correspondence, quantified by the Jaccard Index. C-E. Dotplots comparing the transcriptomic fingerprints for three RGC subclasses between MERFISH (red) and scRNA-seq (blue), including clusters corresponding to Spp1+ αRGC types (panel C), Opn4+ ipRGC types (panel D); and DSGC types (panel E). The size of each dot corresponds to the fraction of cells in each group expressing the gene, and the color is the average expression level. Note that in panel E, C16 contains both dorsal (D)- and ventral (V)-preferring ON-OFF DSGCs, while C10 contains D, V, and nasal-temporal (NT)-preferring ON DSGCs. F-G. Fluorescent in situ hybridization (ISH) using the Opn4-Cre; LSL-YFP line for ipRGC clusters (Ecker et al., 2010), C33 and C40, corresponding to M1a and M1b. Tbx20+NmbYFP+ C33 (M1a) RGCs (panel F) and Tbx20+Nmb+ YFP+ C40 (M1b) RGCs (panel G) exhibit OFF dendrites characteristic of M1 ipRGCs. H. Immunohistochemistry (IHC) experiments show that Tbx20+ Spp1YFP+ RGCs (M1a/b) are OFF laminating. I-J. Same as H, showing that Tbx20+Spp1+YFP+ C31 (M2) RGCs are ON laminating with small soma size (panel I), while Tbx20Spp1+ YFP+ C43 (M4) are ON laminating with large soma size (panel J). K. ISH showing that Serpine2+ YFP+ C22 (M5) RGCs are ON laminating. Scale bars in panels F–K, 5 μm.
Figure 4.
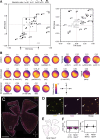
Figure 4.. Topographic distributions of RGC types
A. Scatter plot of the Dorsal/Ventral (D/V, top to bottom, Y-axis) and Nasal/Temporal (T/N, X-axis, left to right) scores for RGC types. See Methods for details of the score calculations. Statistically significant deviations (Welch’s t-test, Benjamini-Hochberg correction) are highlighted in black, with larger dots for lower p-values. The inset (right) zooms in on types near the origin. Figures S5A and B show the variation in these scores across biological replicates and show that randomized somal distributions achieve a mean zero score. B. Representative RGC-type distributions grouped by uniform, temporal, ventral, or dorsal biases, with adjusted density plots accounting for sampling inhomogeneity. The distribution of Starburst Amacrine Cell (SAC) is also illustrated. Figures S6A and S6B show individual cell locations for RGC types. C-D. Wholemount ISH for Opn4 (yellow) and Nmb (purple) marking C40 cells, with D/V and T/N orientations (panel C). The magnified view (panel D) shows Nmb+ cells as a subset of Opn4+ cells. Scale bars: 1mm in C; 100μm in D. n =6. E. Ventrally biased spatial distribution of Nmb+Opn4+ cells in panel C. F. Comparison of D/V scores (left) and T/N scores (right) for C40 (Nmb+Opn4+) between MERFISH and FISH. Statistical significance was assessed using the Welch’s t-test.
Figure 5.
Figure 5.. Identification and characterization of perivascular RGC types.
A. Schematic showing three retinal vascular plexuses, with the superficial layer (SL) sharing the same 2D space with RGCs in the GCL. B. Permutation test schematic: random shuffling of RGC type labels generates a null distribution (right) to test the proximity of each RGC type to CD31+ blood vessels. C. Permutation test results highlighting that perivascular RGC types (adjusted p < 0.01) are enriched in two major RGC subclasses: ipRGCs (C40, C33, C43) and DSGCs (C24, Temporal- ON-OFF DSGCs; and C10, ON DSGCs). D-H. Validation of perivascular enrichment: Hoxd10-GFP (C10, C24 in D), Nts-GFP (C24 in E), and Opn4TdTomato (C40, C33 in F) confirmed perivascular RGCs. In contrast, Foxp2-RGCs (G) and Hb9-RGCs (C16 in H) were not enriched in the perivascular space. Scale bars: 25μm. I: Perivascular distance measurements of RGC subclasses, grouped by proximity to vessels (0–1, 1–10, >10μm). N=4 animals each, Two-Way ANOVA tests, p<0.0001 (****). J-M. ISH in the macular region of the human prenatal retina (GW22–23) showing perivascular enrichment of OPN4+ ipRGCs (J, hRGC12) and BNC2+ ON DSGCs (K, hRGC11) (Yan et al., 2020b), compared to non-enriched FOXP2+ F-RGCs (L, hRGC6, hRGC7). Distance for each group of human RGC subsets was quantified (M). Scale bars: 20μm. N=3 human samples each, One-Way ANOVA test, p<0.001(***). N-O. Schematic illustration of ONC experiments for mouse retina 2 weeks post crush (wpc) (N). Quantifications (O) showing that Post-ONC survival of Hoxd10-GFP (C10, C24), Opn4-TdTomato (C40, C33), at 2 weeks post crush (wpc) was higher than the average of Foxp2-RGCs (C3, C4, C28, C32, C38), or Hb9-GFP RGCs (C16), correlating with their perivascular distribution. N= 4 animals in each condition, One-Way ANOVA, p<0.0001 (****).

References

    1. Ahnelt P.K., Fernandez E., Martinez O., Bolea J.A., and Kubber-Heiss A.. 2000. Irregular S-cone mosaics in felid retinas. Spatial interaction with axonless horizontal cells, revealed by cross correlation. J Opt Soc Am A Opt Image Sci Vis. 17:580–588. - PubMed
    1. Aranda M.L., and Schmidt T.M.. 2021. Diversity of intrinsically photosensitive retinal ganglion cells: circuits and functions. Cell Mol Life Sci. 78:889–907. - PMC - PubMed
    1. Badea T.C., Cahill H., Ecker J., Hattar S., and Nathans J.. 2009. Distinct roles of transcription factors brn3a and brn3b in controlling the development, morphology, and function of retinal ganglion cells. Neuron. 61:852–864. - PMC - PubMed
    1. Baden T., Berens P., Franke K., Roman Roson M., Bethge M., and Euler T.. 2016. The functional diversity of retinal ganglion cells in the mouse. Nature. 529:345–350. - PMC - PubMed
    1. Bae J.A., Mu S., Kim J.S., Turner N.L., Tartavull I., Kemnitz N., Jordan C.S., Norton A.D., Silversmith W.M., Prentki R., Sorek M., David C., Jones D.L., Bland D., Sterling A.L.R., Park J., Briggman K.L., Seung H.S., and Eyewirers. 2018. Digital Museum of Retinal Ganglion Cells with Dense Anatomy and Physiology. Cell. 173:1293–1306 e1219. - PMC - PubMed

Publication types