[Preprint]. 2024 Dec 21:2024.12.20.629776.
doi: 10.1101/2024.12.20.629776.

A Vulnerable Subtype of Dopaminergic Neurons Drives Early Motor Deficits in Parkinson's Disease

Affiliations

A Vulnerable Subtype of Dopaminergic Neurons Drives Early Motor Deficits in Parkinson's Disease

Akira Fushiki et al. bioRxiv. .

Abstract

In Parkinson's disease, dopaminergic neurons (DANs) in the midbrain gradually degenerate, with ventral substantia nigra pars compacta (SNc) DANs exhibiting greater vulnerability. However, it remains unclear whether specific molecular subtypes of ventral SNc DANs are more susceptible to degeneration in PD, and if they contribute to the early motor symptoms associated with the disease. We identified a subtype of Sox6+ DANs, Anxa1+, which are selectively lost earlier than other DANs, and with a time course that aligns with the development of motor symptoms in MitoPark mice. We generated a knock-in Cre mouse line for Anxa1+ DANs and showed differential anatomical inputs and outputs of this population. Further, we found that the inhibition of transmitter release in Anxa1+ neurons led to bradykinesia and tremor. This study uncovers the existence of a selectively vulnerable subtype of DANs that is sufficient to drive early motor symptoms in Parkinson's disease.

Keywords: Parkinson’s disease; cell types; dopamine; motor symptoms; neurodegeneration; tremor; vulnerability.


Conflict of interest statement

Declaration of interests The authors declare no competing interests.

Figures
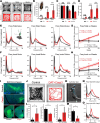
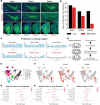
Figure1.
Figure1.. Progressive development of PD-like motor deficits in MitoPark mice
A. Cumulative trajectories of a representative MitoPark mouse and their control at different stages (8, 16 and 24wks) in the open-field test (black: control animals, red: MitoPark mice). B-D. Behavioral characterization of MitoPark mice and their littermate controls at each stage. (B) Immobility time: MitoPark mice at later stages spent significantly more time immobile compared to controls. The inset shows tracking performed using DeepLabCut. (C) Average speed during mobility: the speed of MitoPark mice was significantly lowered in 16 and 24wks. (D) Number of stops: the number of pauses in MitoPark mice showed significant differences compared to the controls. Statistical significance was determined by two-sided Mann–Whitney U-test (***p < 0.001; ns = not statistically significant). Error bars show 95% confidence intervals. MitoPark 8weeks, n=6; Littermate controls 8weeks, n=6; MitoPark 16weeks, n=12; Littermate controls 16weeks, n=8; MitoPark 24weeks, n=9; Littermate controls 24weeks, n=15. E-H. Frequency analysis of total time (E) or immobility periods (F) at different ages of the animals. Mitopark mice showed a pronounced increase in the power of acceleration oscillations at the 12–18Hz range that becomes more prominent in the later stages. (G, H) The scatter plots show the correlation between age and mean power in the 12–18Hz frequency band for Mitopark mice and control animals during total period (G) or immobile period (H). Pearson’s correlation coefficient reveals a strong positive correlation during both the total period (G: red, r=0.88, p<0.001) and the immobile period (H: red, r=0.77, p<0.01) in MitoPark mice. The solid line represents the linear regression model (G: red, y = 6.3e-03x + 0.036, R² = 0.78; H: red, y = 5.6e-03x + 0.036, R² = 0.60), demonstrating a statistically significant relationship between the two variables in MitoPark mice. MitoPark 8weeks, n=3; Littermate controls 8weeks, n=3; MitoPark 16weeks, n=4; Littermate controls 16weeks, n=3; MitoPark 24weeks, n=5; Littermate controls 24weeks, n=6. I-O. Injections of Casp3 virus in the SNc of DAT-Cre mice led to the similar phenotype of MitoPark mice 24 weeks. (I) The images demonstrated a specific reduction in dopamine neurons (DANs) within the SNc, as confirmed by staining with anti-TH antibody (green). (J-M) The DAT-Casp3 animals showed motor deficits characterized by diminished movement speed, increased incidences of halting and reduced the frequency of rearing behaviors. Statistical significance was determined by two-sided Mann–Whitney U-test (*p < 0.05; ns = not statistically significant). Error bars show 95% confidence intervals. DAT-Casp3 animals, n=5; Controls, n=5. (N, O) The virus injection led to the presentation of the same 12–18Hz oscillation seen in MitoPark mice at 24 weeks.
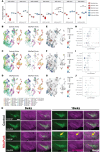
Figure 2.
Figure 2.. Progressive degeneration of dopamine neurons in MitoPark mice
A-C. TH immunohistochemistry of MitoPark mice and their littermate controls at 8, 16 and 24 weeks. (A) Histological images of the mice at each stage. Scale bars: 400μm for the substantia nigra (top) and 1mm for the striatum (bottom). (B-C) MitoPark mice exhibited a gradual and preferential loss of DANs in the substantia nigra, and their projections (each n=1). D. The workflow for single-nucleus RNA (snRNA) sequencing commenced with the collection of all tissues from the ventral midbrain (red dashed lines). The tissue samples underwent nuclei isolation, followed by the selection of DAPI+ nuclei. These nuclei were subsequently processed using the 10x Genomics platform for sequencing. E. UMAP visualization of snRNA-seq data from the ventral midbrain. Data are combined across all animals (MitoPark mice and their controls) and classified by the Allen Brain Cell (ABC) Atlas class annotations. Nuclei that are limited in number or belong to infrequent categories are designated as ‘others.’ F. Feature plot showing expression of marker genes used to label the main class of cells: Th (DANs), Slc17a6 (excitatory neurons) and Slc32a1 (inhibitory neurons). G-I. Dots and whiskers represent odds-ratio (OR) with 95% confidence interval (CI) obtained from MASC. OR estimates of major cell types associated with MitoPark mice (color; false discovery rate (FDR)-adjusted P<0.05). (G) MitoPark 16 weeks versus their littermate controls; 21_MB_Dopa (OR=−0.95, FDR-adjusted P<0.05). (H) MitoPark 24 weeks versus their littermate controls; 21_MB_Dopa (OR=−1.26, FDR-adjusted P<0.05). (I) MitoPark 16 weeks versus 8 weeks; 21_MB_Dopa (OR=−0.51, FDR-adjusted P=0.057).
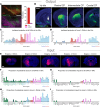
Figure3.
Figure3.. Subtype-specific degeneration within the dopaminergic populations
A. UMAP representation of 18,611 dopamine neuron nuclei, colored by the supertype annotation of the Allen Brain Cell (ABC) Atlas. In supertype annotation of the ABC Atlas, DANs are largely classified into 8 types. B. Representative feature plots showing gene expression associated with dopamine used to label the main class of cells. C. Distribution of dopamine subtype proportions across MitoPark and their control animals. 0882_Sox6 is mostly affected among other dopamine neuron subtypes. Statistical significance was determined by two-way ANOVA (p-value indicates the interaction effect between genotype and age) followed by Tukey’s HSD test for multiple comparisons (*p < 0.05, **p < 0.01, ***p < 0.001, ****p < 0.0001). D-F. Odds-ratio estimates of each dopamine subpopulation in (D) MitoPark 16 weeks versus their littermate controls; 0882_Sox6 (OR=−1.72, FDR-adjusted P<0.05), 0880_Megf11 (OR=1.00, FDR-adjusted P<0.05) and 0883_Cck (OR=1.13, FDR-adjusted P<0.05). (E) MitoPark 24 weeks versus their littermate controls; 0882_Sox6 (OR=−2.49, FDR-adjusted P<0.05), 0887_Synpr (OR=1.76, FDR-adjusted P<0.05) and 0880_Megf11 (OR=1.31, FDR-adjusted P<0.05). (F) MitoPark 16 weeks versus 8 weeks; 0882_Sox6 (OR=−0.93, FDR-adjusted P=0.057).
Figure4.
Figure4.. A subset of Sox6+ population is more vulnerable than others in MitoPark mice
Differential abundance analysis for the dopamine clusters of MitoPark mice and their littermate controls. The analysis reveals a subtype-specific reduction in MitoPark mice at a later stage. A. Distribution of Sox6+ dopamine subtype proportions across MitoPark and their control animals. 3857_Anxa1 is significantly affected among other dopamine neuron subtypes at 16 and 24 weeks. Statistical significance was determined by two-way ANOVA (p-value indicates the interaction effect between genotype and age) followed by Tukey’s HSD test for multiple comparisons (*p < 0.05, **p < 0.01, ***p < 0.001, ****p < 0.0001). B-D. UMAP plots showing the dopamine subpopulations including MitoPark mice and their littermate controls (n=8 at each stage and genotype). Forty-three clusters are annotated by the Allen Brain Cell (ABC) Atlas. E-G. Neighborhood (Nhood) graphs with the results from Milo differential abundance testing between MitoPark mice and controls (E:16 weeks, F: 24 weeks), and between MitoPark mice at different stages (G: 8 and 16 weeks). Nodes represent neighborhoods, colored by their log fold change compared to their controls (blue: less abundant, red: more abundant, gray: non-differentially abundant). Graph edges show the number of cells shared between two neighborhoods. H-J. Beeswarm plots display the distribution of log-fold changes in cell abundance. Dots representing neighborhoods that overlap with the same cell populations are grouped together. Colors are represented similarly to E-G. K. Histological images representing 8 and 16 weeks of MitoPark mice reveal that significant cell depletion in the ventral region, particularly in the rostral part of the SNc (TH: green, ALDH1A1: magenta). Scale bar 400μm.
Figure5.
Figure5.. Input-output circuit architecture of Anxa1+ DANs in the SNc
A. In the Anxa1-Cre line, the majority of neurons within the SNc are positive for Th and negative for Calbindin1 (TH, red; CALB1, magenta; n=2). Scale bars: 400μm. B. Axonal projections of Anxa1+ DANs in the SNc. They preferentially project to dorsal striatum that integrates sensorimotor information from cortical and thalamic regions. Scale bars: 1mm. C-D. Brain regions to which all DANs or Anxa1+ DANs in the SNc project, measured as the fraction of neurites found within those brain structures defined Allen brain atlas (each n=3). Blue horizontal line indicates dorsal striatum and the red line indicates ventral striatum. E. Representative images of rabies infected cells (tdTomato). Rabies virus was injected in the SNc of Anxa1-Cre counterstained with DAPI in blue. Scale bar 1mm. F-I. Statistical analysis of the whole-brain distribution of ipsilateral (left) or contralateral (right) monosynaptic inputs to all DANs (F, G) or Anxa1+ dopamine neuron subtype (H, I) in the SNc. Average proportion of tdTomato-labeled neurons in approximately 50 brain regions, each with more than 200 cells, was greater than 0.2% of the total input to DANs in DAT-Cre mice (n=7) and Anxa1-Cre mice (n=5; 4 animals for Anxa1-Cre+ and 1 animal for DAT-Flp+;Anxa1-Cre+). Brain areas are color-coded by the Allen Brain Atlas. [Acronym] ACAd5, Anterior cingulate area, dorsal part, layer 5; ACAv5, Anterior cingulate area, ventral part, layer 5; ACB, Nucleus accumbens; AId5, Agranular insular area, dorsal part, layer 5; AId6a, Agranular insular area, dorsal part, layer 6a; APN, Anterior pretectal nucleus; BLAa, Basolateral amygdalar nucleus, anterior part; CEAc, Central amygdalar nucleus, capsular part; CEAl, Central amygdalar nucleus, lateral part; CEAm, Central amygdalar nucleus, medial part; CPc_d, Caudal Caudoputamen, dorsal; CPc_i, Caudal Caudoputamen, intermediate; CPc_v, Caudal Caudoputamen, ventral; CPi_dl, Intermediate Caudoputamen, dorsolateral; CPi_dm, Intermediate Caudoputamen, dorsomedial; CPi_vl, Intermediate Caudoputamen, ventrolateral; CPi_vm, Intermediate Caudoputamen, ventromedial; CPr_imd, Rostral Caudoputamen, intermediate dorsal; CPr_imv, Rostral Caudoputamen, intermediate ventral; CPr_l, Rostral Caudoputamen, lateral; CPr_m, Rostral Caudoputamen, medial; EW, EdingerWestphal nucleus; FF, Fields of Forel; FS, Fundus of striatum; Gpe, Globus pallidus, external segment; Gpi, Globus pallidus, internal segment; HY, Hypothalamus; IF, Interfascicular nucleus raphe; IPRL, Interpeduncular nucleus, rostrolateral; LHA, Lateral hypothalamic area; MB, Midbrain; MOp5, Primary motor area, Layer 5; MOp6a, Primary motor area, Layer 6a; MOs5, Secondary motor area, layer 5; MOs6a, Secondary motor area, layer 6a; MRN, Midbrain reticular nucleus; MT, Medial terminal nucleus of the accessory optic tract; ORBl5, Orbital area, lateral part, layer 5; OT, Olfactory tubercle; PAG, Periaqueductal gray; PAL, Pallidum; PIL, Posterior intralaminar thalamic nucleus; PL5, Prelimbic area, layer 5; PN, Paranigral nucleus; PP, Peripeduncular nucleus; PST, Preparasubthalamic nucleus; PSTN, Parasubthalamic nucleus; RL, Rostral linear nucleus raphe; RN, Red nucleus; RR, Midbrain reticular nucleus, retrorubral area; RSPd5, Retrosplenial area, dorsal part, layer 5; RSPv5, Retrosplenial area, ventral part, layer 5; SCdg, Superior colliculus, motor related, deep gray layer; Scig, Superior colliculus, motor related, intermediate gray layer; Sciw, Superior colliculus, motor related, intermediate white layer; SI, Substantia innominata; SNr, Substantia nigra, reticular part; SPFp, Subparafascicular nucleus, parvicellular part; SSpbfd5, Primary somatosensory area, barrel field, layer 5; SSpll5, Primary somatosensory area, lower limb, layer 5; SSpm5, Primary somatosensory area, mouth, layer 5; SSpul5, Primary somatosensory area, upper limb, layer 5; SSs5, Supplemental somatosensory area, layer 5; STN, Subthalamic nucleus; STR, Striatum; TEa5, Temporal association areas, layer 5; VISC5, Visceral area, layer 5; VTA, Ventral tegmental area; ZI, Zona incerta
Figure6.
Figure6.. Inhibition of Anxa1+ DANs leads to motor deficits resembling early onset PD-like symptoms
A. In the Anxa1-Cre line, targeted expression of the tetanus toxin light chain (TeLC) specifically eliminated dopamine synaptic transmission in the dorsal striatum (white arrows). Scale bars: 1mm for the striatum (top) and 400μm for the substantia nigra (bottom). B-D. Behavioral characterization of Anxa1-TeLC animals. (B) Cumulative trajectories of a representative Anxa1-TeLC mouse and their control in the open-field test (black: a control animal, red: Anxa1-TeLC mouse). (C) Anxa1-TeLC animals demonstrated slowed movement; however, there were no significant differences observed in terms of immobility duration or the frequency of stops. The frequency of rearing behaviors in the Anxa1-TeLC animals was significantly reduced. Statistical significance was determined by two-sided Mann–Whitney U-test (**p < 0.01, *p < 0.05; ns = not statistically significant). Error bars show 95% confidence intervals. Anxa1-TeLC animals, n=5; Controls, n=4. (D) This figure shows the probability density function (PDF) for stop duration (left) and move duration (right), with duration (in seconds) on the x-axis and probability density on the y-axis. There is no significant difference in the density of stop or move durations between Anxa1-TeLC and control animals. E. Anxa1-TeLC animals showed the similar 12–18Hz oscillation seen in MitoPark mice at 16 weeks.

References

    1. Barrett M.J., Wylie S.A., Harrison M.B., and Wooten G.F. (2011). Handedness and motor symptom asymmetry in Parkinson’s disease. J Neurol Neurosurg Psychiatry 82, 1122–1124. 10.1136/jnnp.2010.209783. - DOI - PMC - PubMed
    1. Hirsch E.C., Graybiel A.M., and Agid Y. (1988). Melanized dopaminergic neurons are differentially affected in Parkinson’s disease. Nature 334, 345−−348. - PubMed
    1. HORNYKIEWICZ O. (1963). [The tropical localization and content of noradrenalin and dopamine (3-hydroxytyramine) in the substantia nigra of normal persons and patients with Parkinson’s disease]. Wien Klin Wochenschr 75, 309—312. - PubMed
    1. Poulin J.F., Gaertner Z., Moreno-Ramos O.A., and Awatramani R. (2020). Classification of Midbrain Dopamine Neurons Using Single-Cell Gene Expression Profiling Approaches. Preprint at Elsevier Ltd, https://doi.org/10.1016/j.tins.2020.01.004 https://doi.org/10.1016/j.tins.2020.01.004. - DOI - DOI - PMC - PubMed
    1. Azcorra M., Gaertner Z., Davidson C., He Q., Kim H., Nagappan S., Hayes C.K., Ramakrishnan C., Fenno L., Kim Y.S., et al. (2023). Unique functional responses differentially map onto genetic subtypes of dopamine neurons. Nat Neurosci 26, 1762–1774. 10.1038/s41593-023-01401-9. - DOI - PMC - PubMed

Publication types

LinkOut - more resources