[Preprint]. 2024 Dec 16:2024.12.12.628190.
doi: 10.1101/2024.12.12.628190.

A precision oncology-focused deep learning framework for personalized selection of cancer therapy

Affiliations

A precision oncology-focused deep learning framework for personalized selection of cancer therapy

Casey Sederman et al. bioRxiv. .

Abstract

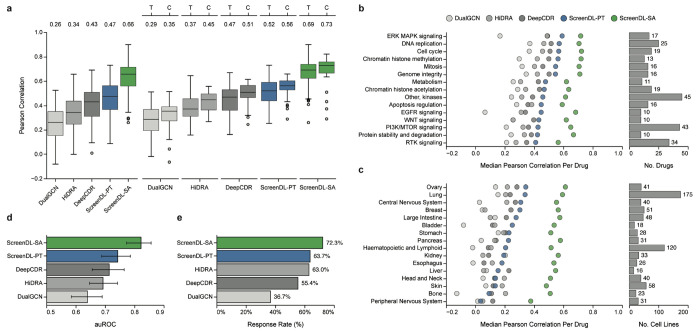
Precision oncology matches tumors to targeted therapies based on the presence of actionable molecular alterations. However, most tumors lack actionable alterations, restricting treatment options to cytotoxic chemotherapies for which few data-driven prioritization strategies currently exist. Here, we report an integrated computational/experimental treatment selection approach applicable for both chemotherapies and targeted agents irrespective of actionable alterations. We generated functional drug response data on a large collection of patient-derived tumor models and used it to train ScreenDL, a novel deep learning-based cancer drug response prediction model. ScreenDL leverages the combination of tumor omic and functional drug screening data to predict the most efficacious treatments. We show that ScreenDL accurately predicts response to drugs with diverse mechanisms, outperforming existing methods and approved biomarkers. In our preclinical study, this approach achieved superior clinical benefit and objective response rates in breast cancer patient-derived xenografts, suggesting that testing ScreenDL in clinical trials may be warranted.


Conflict of interest statement

Competing Interests Statement University of Utah may license the models described herein to for-profit companies, which may result in tangible property royalties to members of the Welm labs who developed the models. M.T.L. is a Manager in StemMed Holdings L.L.C., a limited partner in StemMed Ltd., and holds an equity stake in Tvardi Therapeutics. The other authors declare no conflicts.

Figures

Extended Data Fig. 1:
Extended Data Fig. 1:. Performance in our previously reported collection of 16 high-risk/metastatic PDXO models.
Performance comparison of ScreenDL-PT with two existing DL-based CDRP models, DeepCDR and HiDRA. Box plots represent the distribution of Pearson correlations between observed and predicted response per drug. Median values for each model are denoted in the upper margin.
Extended Data Fig. 2:
Extended Data Fig. 2:. In vitro functional testing in PDXOs predicts in vivo PDX response.
a. Boxplots of observed Zd response from raw PDXO screening stratified by whether or not the originating PDX line achieved clinical benefit after treatment with the corresponding therapy. Clinical benefit was defined as stable disease or better by mRECIST criteria. The p-value denotes the significance of a two-sided Mann-Whitney U test comparing observed Zd responses across groups. b. Bar graph representing observed Zd responses for the indicated drugs in PDXO lines. Color denotes whether or not the originating PDX showed clinical benefit after treatment with the corresponding therapy. An observed Zd below the 30th percentile of Zd values for a given therapy (corresponding to the top 30% most sensitive PDXOs for a given drug) was predictive of clinical benefit in the originating PDX line (p = 0.005, Fisher exact test).
Extended Data Fig. 3:
Extended Data Fig. 3:. ScreenDL provides superior predictive power for drugs included in cell line pretraining.
Drug-level performance of each ScreenDL variant and two existing DL models in breast cancer PDXOs stratified by whether or not drugs were included in cell line pretraining. Box plots represent the distribution of Pearson correlations between observed and predicted response per drug. Median values for each model are denoted in the upper margin. All models achieved superior performance for drugs included in cell line pretraining. We note that only drugs included in cell line pretraining were considered for ScreenAhead in PDXOs.
Extended Data Fig. 4:
Extended Data Fig. 4:. Systematic comparison of informed drug selection algorithms.
a. Performance comparison of ScreenDL-PT (blue) and ScreenDL-SA (green) when adding an increasing number of randomly selected drugs to the ScreenAhead drug set. Box plots represent the distribution of Pearson correlations between observed and predicted response per drug. Median values are denoted in the upper margin. b. tSNE embeddings of drugs based on observed cell line responses. Colors indicate groups of drugs recovered by k-means clustering. Drugs selected for ScreenAhead using principal feature analysis are outlined in black. c. Percentage of drugs for which informed drug selection using either agglomerative clustering (A), metadata-based selection using drug target pathway annotations (M), or principal feature analysis (P) outperforms random selection. d. Pairwise comparison of informed drug selection algorithms. Per-drug performance was quantified as the Pearson correlation between observed and predicted response and drug-level performance was compared with Wilcoxon signed-rank tests. Circles are colored according to the negative log10 p-value and significant tests are outlined. The winner of each pairwise comparison is labeled within each circle.
Extended Data Fig. 5:
Extended Data Fig. 5:. ScreenAhead leverages knowledge of global drug sensitivity encoded in partial pre-screening data.
a. Correlation between global drug sensitivity (GDS) and response to individual therapies in cancer cell lines. For each cell line, GDS was defined as the mean Zd response across all screened drugs. Only a subset of 30 cell lines and 60 drugs are shown for readability. Colors indicate individual cell lines. The reported Pearson correlation represents the correlation between GDS and individual Zd values across the entire cell line dataset. b. Correlation between global drug sensitivity (GDS) and response to individual therapies in breast cancer PDXO models. For each PDXO, GDS was defined as the mean Zd response across all drugs. Only a subset of 30 PDXO lines and 60 drugs are shown for readability. Colors indicate individual PDXO lines. The reported Pearson correlation represents the correlation between GDS and individual Zd values across the entire PDXO dataset. c. ScreenDL-SA performance in cell lines when performing ScreenAhead tumor-specific fine-tuning using either the original Zd values (ScreenDL-SA (Zd)) or mean-filled Zd values for 20 drugs (ScreenDL-SA (GDS)). By replacing Zd values with a cell line’s mean Zd across the 20 ScreenAhead drugs, we effectively remove any drug-specific information and only provide knowledge of GDS during ScreenAhead tumor-specific fine-tuning. Box plots represent the distribution of Pearson correlations between observed and predicted response per drug. Median values for each ScreenDL variant are denoted in the upper margin. d. Mean absolute error (MAE) between observed and predicted Zd in cell lines for each ScreenDL variant and three existing DL models. The MAE of each model is binned by the expected MAE of a GDS-only model (i.e., a model that outputs a tumor’s GDS regardless of drug features; see Supplementary Text 2). ScreenAhead improves performance, even for cell line-drug pairs for which GDS is not highly predictive.
Extended Data Fig. 6:
Extended Data Fig. 6:. ScreenAhead leverages learned drug-drug functional relationships to improve predictions for unscreened therapies.
a. Mean absolute error (MAE) of Zd predictions in cell lines for ScreenDL-PT and ScreenDL-SA. Each cell line-drug pair was assigned to a bin according to the maximum functional similarity with the 20 drugs used for ScreenAhead tumor-specific fine-tuning in the corresponding cell line (see Supplementary Text 3). After assigning each response to a bin (x-axis), the MAE of Zd predictions for ScreenDL-PT and ScreenDL-SA was computed for each bin (y-axis). ScreenAhead provided outsized performance gains in cell line-drug pairs for which the drug had a higher maximum functional similarity with drugs in the ScreenAhead drug set. b. Change in MAE after ScreenAhead (ScreenDL-SA vs ScreenDL-PT) for each bin. c. Pearson correlation between observed and predicted Zd responses for 20 drugs (5-fluorouracil, leflunomide, epirubicin, piperlongumine, vinblastine, oxaliplatin, docetaxel, gemcitabine, cytarabine, cisplatin, alisertib, afatinib, erlotinib, dabrafenib, alpelisib, trametinib, olaparib, nilotinib, fulvestrant, and irinotecan) in cell lines when including an increasing number of functionally related therapies in ScreenAhead tumor-specific fine-tuning. For each interested drug, we compared the performance of ScreenDL-PT at baseline to that achieved by ScreenDL-SA when including an increasing number of functionally related therapies in the ScreenAhead drug set. Performance significantly improved with the inclusion of just one functionally related therapy. Additional improvement was observed upon inclusion of each additional functionally related agent. d,e. tSNE plots of ScreenDL-PT’s drug subnetwork embeddings colored by annotations of drug biological mechanism (d) or protein targets (e).
Extended Data Fig. 7:
Extended Data Fig. 7:. The combination of domain-specific fine-tuning and ScreenAhead tumor-specific fine-tuning is necessary for optimal performance.
Drug-level performance of ScreenDL-SA with (+FT) and without (−FT) prior domain-specific fine-tuning. Box plots represent the distribution of Pearson correlations between observed and predicted response per drug. Median values for each model are denoted in the upper margin. Performance is shown across all drugs (left) and stratified according to whether or not the tested drugs were screened in cell lines and thus included in cell line pretraining (right). The performance of ScreenDL-PT and ScreenDL-FT are shown for reference.
Fig. 1:
Fig. 1:. Deep learning-based integration of tumor omic and functional data for precision treatment selection with ScreenDL.
a. Model Architecture: ScreenDL takes a tumor’s transcriptomic profile and a drug’s chemical structure as input and predicts z-score ln(IC50) values. b. Data Sources and Training Schema: During initial general-purpose pretraining, ScreenDL extracts generalizable associations between tumor omics and drug response from large-scale cell line pharmaco-omic databases (blue). During subsequent domain-specific fine-tuning, ScreenDL leverages pharmaco-omic data from breast cancer PDXOs to adapt to a more clinically relevant response prediction context (purple). Finally, patient-specific fine-tuning with ScreenAhead generates a personalized response prediction model optimized for the N-of-1 precision oncology context (green). c. Clinical Workflow: When a new patient enters the functional precision oncology pipeline, a biopsy is taken, and RNA sequencing is performed. In parallel, a patient-derived organoid model is established, and functional drug screening is performed. The resulting multimodal data is integrated with prior knowledge through patient-specific fine-tuning with ScreenAhead. Predicted drug responses are then used to select an optimal treatment.
Fig. 2:
Fig. 2:. ScreenDL enables accurate response prediction in never-before-seen cell lines.
a. Comparison of the drug level-prediction accuracies achieved by ScreenDL-PT and ScreenDL-SA with those of three existing DL-based CDRP models. Box plots represent the distribution of Pearson correlations between observed and predicted response per drug. Median values for each model are denoted in the upper margin. Drug-level performance is stratified by drug type for a subset of drugs (n = 213) which were manually annotated as either: chemotherapies (C), n = 34; or targeted agents (T), n = 179. b. Performance stratified according to drug biological mechanisms. Points represent the median Pearson correlation coefficient per drug. Bars indicate the number of training drugs per biological mechanism. Only mechanisms with at least 10 drugs are shown. c. Drug-level performance stratified according to cell line tissue types. Points represent the median Pearson correlation per drug amongst cell lines from the corresponding tissue. Bars indicate the number of training cell lines per tissue. Only tissues with at least 10 cell lines are shown. d. Median area under the receiver operating characteristic curve (auROC) across drugs for ScreenDL-PT, ScreenDL-SA, and three existing DL models. For each drug, sensitive tumors were defined as cell lines with an observed response falling below the 30th percentile of observed ZD values. Error bars denote interquartile ranges. e. Cell line response rates to drugs selected by different DL models.
Fig. 3:
Fig. 3:. ScreenDL achieves accurate response prediction in high-risk/metastatic breast cancer PDXO models.
a. Unsupervised clustering of 29 drugs carried forward for screening in at least 70% of PDXO lines. Only the 48 PDXO lines in which all 29 drugs were screened are included. Color indicates z-score normalized ln(IC50) values (darker red indicates cytotoxicity and darker blue indicates growth). Row and column annotations denote the biological mechanism of screened compounds and the hormone receptor status of each PDXO line, respectively. b. Performance of each ScreenDL variant in our expanded breast cancer PDXO cohort for the subset of 61 drugs included in cell line pretraining compared with that of two existing DL-based CDRP models. Box plots represent the distribution of Pearson correlations between observed and predicted response per drug. Median values for each model are denoted in the upper margin. Drug-level performance is stratified by drug type for a subset of drugs which were manually annotated as either: chemotherapies (C), n = 10; or targeted agents (T), n = 51. c. High-confidence drugs (PCC > 0.5) for ScreenDL-SA (ALL) colored by drug biological mechanisms. d. Drug-level performance stratified according to the biological mechanism of the corresponding therapy. Points represent the median Pearson correlation per drug. Bars indicate the number of training drugs per target pathway. Only biological mechanisms with at least two drugs are shown. e. Median area under the receiver operating characteristic curve (auROC) across drugs for ScreenDL-PT, ScreenDL-SA, and two existing DL models. For each drug, sensitive tumors were defined as PDXOs with an observed response falling below the 30th percentile of observed ZD values for a given drug. Error bars denote interquartile ranges. f. PDXO response rates for drugs selected by different DL models.
Fig. 4:
Fig. 4:. ScreenDL outperforms single- and multi-gene biomarker-only models in cell lines.
a-d. Sensitivity to the BRAF inhibitor dabrafenib in cell lines with and without BRAF mutations compared by a two-sided Mann-Whitney U test (a). Performance of a biomarker only-model (b) compared with ScreenDL-FT (c) and ScreenDL-SA (d). b-d. Lines indicate linear regressions fit to the data. c-d. Performance of ScreenDL-FT and ScreenDL-SA is stratified by genomic subgroups e-h. Sensitivity to the AKT inhibitor capivasertib in PDXOs with and without mutations in PI3KCA, AKT1, and/or PTEN compared by a two-sided Mann-Whitney U test (e). Performance of a biomarker only-model (f) compared with ScreenDL-FT (g) and ScreenDL-SA (h). f-h. Lines indicate linear regressions fit to the data. g-h. Performance of ScreenDL-FT and ScreenDL-SA is stratified by genomic subgroups
Fig. 5:
Fig. 5:. ScreenDL outperforms single- and multi-gene biomarker-only models in advanced/metastatic breast cancer PDXOs.
a-d. Sensitivity to the AKT inhibitor capivasertib in breast cancer PDXOs with and without mutations in PI3KCA, AKT1, and/or PTEN compared by a two-sided Mann-Whitney U test (a). Performance of a biomarker only-model (b) compared with ScreenDL-FT (c) and ScreenDL-SA (d). c-d. Performance of ScreenDL-FT and ScreenDL-SA is stratified by genomic subgroups. e-h. Sensitivity to the PARP inhibitor talazoparib in PDXOs with and without mutations in BRCA1/2 compared by a two-sided Mann-Whitney U test (e). Performance of a biomarker only-model (f) compared with ScreenDL-FT (g) and ScreenDL-SA (h). g-h. Performance of ScreenDL-FT and ScreenDL-SA is stratified by genomic subgroups. i-l. Carboplatin sensitivity in PDXOs with and without mutations in BRCA1/2 compared by a two-sided Mann-Whitney U test (e). Performance of a biomarker only-model (j) compared with ScreenDL-FT (k) and ScreenDL-SA (l). k-l. Performance of ScreenDL-FT and ScreenDL-SA is stratified by genomic subgroups. b-d,f-h,j-l. Lines indicate linear regressions fit to the data. c-d,g-h,k-l. PDXOs without whole exome sequencing (WES) data are indicated in light gray.
Fig. 6:
Fig. 6:. Retrospective validation of our end-to-end precision treatment selection strategy in matched PDX/PDXO models.
a. Retrospective Validation Schema. A PDX’s transcriptomic profile and functional drug screening from matched PDXO lines are integrated into ScreenDL through tumor-specific fine-tuning with ScreenAhead. For each PDX, the drug with the lowest predicted ZD is selected as the optimal treatment and both clinical benefit rate (CBR) and objective response rate (ORR) are quantified using in vivo response in the originating PDX lines. Only the 20 PDX models for which in vivo testing for at least two therapies was carried out in unrelated studies were considered. b. CBR amongst the drugs selected with raw PDXO screening data for 20 PDX lines. Response values were z-score normalized independently for each drug across tumor samples and the drug with the lowest z-score response in the corresponding PDXO line was selected as the optimal precision treatment. Clinical benefit was defined as stable disease (SD) or better by mRECIST criteria. c. CBR amongst drugs selected by DeepCDR for the subset of 15 PDX lines with WES data. d. CBR for drugs selected by each ScreenDL variant for 20 PDX lines compared with those selected by HiDRA. e. ORR amongst the drugs selected with raw PDXO screening data for 20 PDX lines. Objective response was defined as partial or complete response (PR or CR) by mRECIST criteria. f. ORR amongst drugs selected by DeepCDR for the subset of 15 PDX lines with WES data. g. ORR amongst the drugs selected by each ScreenDL variant for 20 PDX lines compared with those selected by HiDRA. b-g. Solid lines correspond to the CBR (b-d) or ORR (e-g) achieved by random drug selection. Dashed lines correspond to the maximum and minimum achievable CBR (b-d) or ORR (e-g) based on the observed PDX screening data. PDXO screening was not performed for a subset of drugs evaluated in PDX lines, resulting in changes in the CBR/ORR achieved by random drug selection, as well as the minimum/maximum achievable CBR/ORR when using either DL models or raw PDXO screening data. h. Waterfall plot showing changes in tumor volume quantified as the mean BestAvgResponse across mice (see Methods) for PDX lines treated with optimal precision therapies selected by ScreenDL-SA. i. Waterfall plot showing changes in tumor volume quantified as the mean BestAvgResponse across mice for PDX lines treated with drugs that were not selected as optimal precision therapies by ScreenDL-SA. h,i. Color indicates mRECIST classifications for each PDX-drug pair. Positive changes in tumor volume are capped at 100%.

References

    1. Suehnholz S. P. et al. Quantifying the Expanding Landscape of Clinical Actionability for Patients with Cancer. Cancer Discov. 14, 49–65 (2024). - PMC - PubMed
    1. Zehir A. et al. Mutational landscape of metastatic cancer revealed from prospective clinical sequencing of 10,000 patients. Nat. Med. 23, 703–713 (2017). - PMC - PubMed
    1. Haslam A., Kim M. S. & Prasad V. Updated estimates of eligibility for and response to genome-targeted oncology drugs among US cancer patients, 2006-2020. Ann. Oncol. 32, 926–932 (2021). - PubMed
    1. Marquart J., Chen E. Y. & Prasad V. Estimation of the Percentage of US Patients With Cancer Who Benefit From Genome-Driven Oncology. JAMA Oncol 4, 1093–1098 (2018). - PMC - PubMed
    1. Flaherty K. T. et al. Molecular Landscape and Actionable Alterations in a Genomically Guided Cancer Clinical Trial: National Cancer Institute Molecular Analysis for Therapy Choice (NCI-MATCH). J. Clin. Oncol. 38, 3883–3894 (2020). - PMC - PubMed

Publication types

LinkOut - more resources