[Preprint]. 2024 Dec 20:2024.12.17.628905.
doi: 10.1101/2024.12.17.628905.

The PRMT5-splicing axis is a critical oncogenic vulnerability that regulates detained intron splicing

Affiliations

The PRMT5-splicing axis is a critical oncogenic vulnerability that regulates detained intron splicing

Colin E Fowler et al. bioRxiv. .

Update in

Abstract

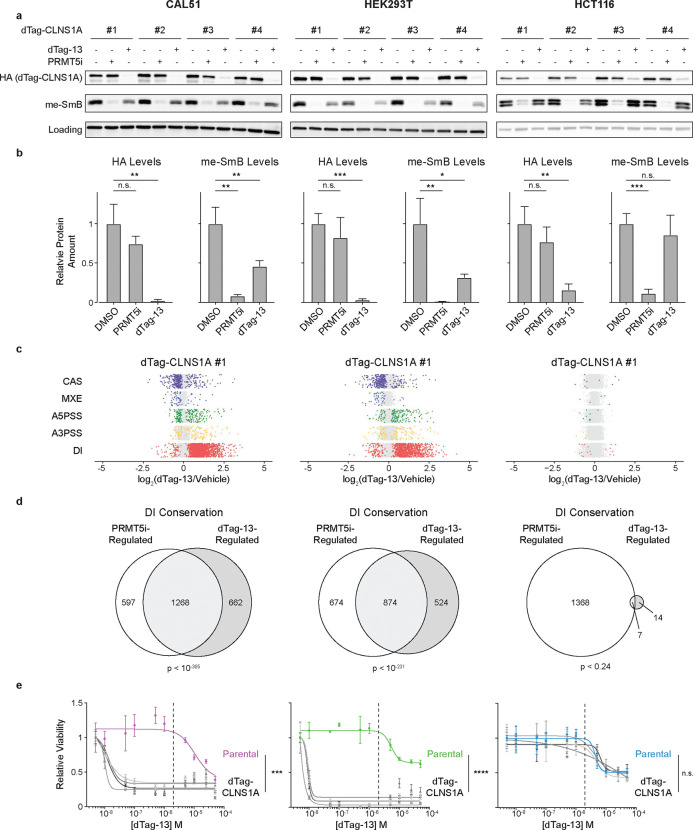
Protein arginine methyltransferase 5 (PRMT5) is a promising cancer target, yet it's unclear which PRMT5 roles underlie this vulnerability. Here, we establish that PRMT5 inhibition induces a special class of unspliced introns, called detained introns (DIs). To interrogate the impact of DIs, we depleted CLNS1A, a PRMT5 cofactor that specifically enables Sm protein methylation. We found that many, but not all, cell lines are CLNS1A-dependent and established that loss of viability is linked to loss of Sm protein methylation and DI upregulation. Finally, we discovered that PRMT5-regulated DIs, and the impacted genes, are highly conserved across human, and also mouse, cell lines but display little interspecies conservation. Despite this, human and mouse DIs have convergent impacts on proliferation by affecting essential components of proliferation-regulating complexes. Together, these data argue that the PRMT5-splicing axis, including appropriate DI splicing, underlies cancer's vulnerability to PRMT5 inhibitors.

Keywords: CLNS1A; PRMT5; detained introns; methylosome; splicing.


Conflict of interest statement

Declaration of Interests The authors declare no competing interests.

Figures

Figure 1.
Figure 1.. PRMT5 inhibition causes formation of DIs specifically in the nucleus.
a-c. U87 cells were treated with vehicle or 10 nM JNJ-64619178 (PRMT5i) for 3 days and polyA+ mRNA was deep sequenced and analyzed to identify and quantify exon-based alternative splicing (AS) events, including DIs, as shown in the schematic (a). b. Dots represent individual events for each AS type, with color denoting ones that are significantly (padj<0.05, color) or not significantly (gray) altered by treatment. c. Proportion of each AS event type that is significantly (padj<0.05) altered by treatment. Number above bar shows total number of significant events. d. Quantification of DI isoform induction levels and sub-cellular localization after 3-day vehicle or 10 nM PRMT5i treatment followed by cellular fractionation. Each dot represents a specific DI-containing isoform, where the x-axis value represents the proportion of reads in the vehicle versus PRMT5i-treated samples and the y-axis value represents the proportion of reads in the nuclear versus cytoplasmic fraction. e. Expression tracks of the DI in DNA2, along with its adjacent exons, present in whole cell, nuclear or cytoplasmic fractions from U87 cells after 3-day vehicle or 10 nM PRMT5i treatment. Red regions indicate intronic reads and gray regions exonic reads. f. Relative abundance of DNA2 (Left) or EIF4E (Right) DIs in U87 cells after 3-day vehicle or 10 nM PRMT5i treatment that were also transfected with two individual siRNAs targeting UPF1 or a non-targeting siRNA for 2 days prior to harvest. p=n.s., Student’s t-test.
Figure 2.
Figure 2.. PRMT5 regulates a conserved set of DIs across multiple human cell lines.
a. Human cell lines used for AS analysis, including cancer/tissue of origin and driver mutations/constructs. b. Proportion of each AS event type that show significantly altered levels in the indicated cell line in response to 3-day treatment with 10 nM JNJ-64619178 (PRMT5i) compared to vehicle control (padj<0.05). Number to the right of each bar represents the total number of significant AS events for that cell line. c. Relative expression of individual DIs across all human cell lines after 3-day vehicle or PRMT5i treatment. Each column represents a specific DI that is significantly up- or down-regulated by PRMT5i-treatment in at least one cell line. Coloring represents Z-score normalized intron counts, where red indicates higher relative expression and blue indicates lower relative expression. d. Similarity matrix of the indicated class of AS event that was significantly altered by PRMT5i treatment. Each square represents the similarity between the two intersecting human cell lines, with coloring indicating percent similarity (Dice Similarity Score) and square size indicating the number of similar events. e. Bar charts of DI conservation across the 7 tested human cell lines. The bar length represents the number of significant PRMT5i-upregulated DIs (padj<0.05, log2FC>0) for each cell line and the color denotes the number of cell lines in which a given DI is conserved across. The number to the right of the bar represents the total number of significant DIs in each line. f. Enriched GO terms from the KW Biological Process gene set for significantly PRMT5i-upregulated DIs in each cell line (padj<0.05, log2FC>0). Terms are displayed if they are significant in at least one cell line (FDR<0.01). Color represents enrichment score, while size inversely correlates with significance value.
Figure 3.
Figure 3.. Generation of endogenous dTag-CLNS1A in multiple human cell lines to specifically inhibit the PRMT5-splicing axis.
a. Schematic indicating how use of the dTag-CLNS1A degron system specifically separates disruption of the methylosome from other PRMT5 functions. b. Western blot analyses of representative dTag-CLNS1A clones for CAL51, HEK293T, and HCT116 cells, alongside parental controls with antibodies against CLNS1A, the inserted HA tag, or loading control GAPDH. Asterisk (*) marks a non-specific band. c. Dose response curves for three parental cell lines treated with dTag-13 for 6 days. Data are mean ± SD of 3 technical replicates/line. Indicated p-values represent the most significant comparison between the respective drug concentration and vehicle-treated cells. Vertical dashed line represents the concentration above which dTag-13 has off-target effects. ****p<0.0001, Student’s t-test. d. Western blot analyses of HA-CLNS1A and loading control GAPDH in four CAL51, HEK293T, and HCT116 dTag-CLNS1A clones treated with either vehicle or 1 μM dTag-13 for 3 days.
Figure 4.
Figure 4.. Loss of Sm protein methylation correlates with increased DI formation and decreased viability.
a. Western blot analyses of HA-CLNS1A, methyl-SmB, and GAPDH (CAL51 and HEK293T) or HSP90 (HCT116) as a loading control in four CAL51, HEK293T, and HCT116 dTag-CLNS1A clones treated with either vehicle, 10 nM JNJ-64619178 (PRMT5i), or 1 μM dTag-13 for 3 days. b. Quantification of HA (Left) and methyl-SmB (Right) levels from a, normalized to loading control. Data are mean ± SD of 4 biological replicates. *p<0.05, **p<0.01, and ***p<0.001, Welch’s t-test. c. Quantification of indicated classes of AS event in dTag-CLNS1A #1 for CAL51, HEK293T, and HCT116 treated with vehicle or 1 μΜ dTag-13 for 3 days. Dots represent individual events, denoting ones that are significantly (padj<0.05, color), or not significantly (gray), altered by dTag-13 treatment. d. Overlap of DIs in CAL51, HEK293T, and HCT116 cells that were significantly altered by dTag-13-induced CLNS1A depletion versus PRMT5i treatment, compared to their vehicle controls (padj<0.05). Overlap significance was calculated using a hypergeometric test. e. Dose response curves of four dTag-CLNS1A clones versus parental controls for the indicated CAL51, HEK293T, and HCT116 lines after a 6-day treatment with dTag-13. Data represents mean ± SD of 3 technical replicates. ***p<0.001 and ****p<0.0001, Student’s t-test.
Figure 5.
Figure 5.. HCT116 cells are CLNS1A-independent until PRMT5 activity is decreased.
a. Western blot analyses of HA-CLNSIA, methyl-SmB, and HSP90 as loading control in HCT116 dTag-CLNS1A #1 (Left) and #2 (Right) maintained in 1 μM dTag-13 for the indicated number of days. b. Representative western blot analysis of CLNS1A, methyl-SmB, and loading control GAPDH levels in HCT116 sgCtrl and four sgCLNS1A clones (n=4 biological replicates). c. Relative proliferation of HCT116 sgCtrl and four sgCLNS1A clones through analyses of cumulative population doubling over a 6-day period. Data represents mean ± SD of 10 technical replicates. d. Dose response curve of HCT116 sgCtrl and indicated representative sgCLNS1A clones treated with the PRMT5i JNJ-64619178 for 6 days. Data represents mean ± SD of 3 technical replicates. **p<0.01 and ***p<0.001, Student’s t-test. e. Dose response curve of HCT116 parental or two dTag-CLNS1A clones treated with or without 1μM dTag-13 in combination with the indicated concentrations of JNJ-64619178 (PRMT5i) for 6 days. Data represents mean ± SD of 3 technical replicates. **p<0.01 and ***p<0.001, Student’s t-test. f. Western blot to assess levels of HA-tag, SDMA, and loading control HSP90 in extracts from HCT116 dTag-CLNS1A #1 after combination treatment with the indicated concentrations of PRMT5i and dTag-13 for 3 days. Red markings correspond to the dose of PRMT5i used in Figure 5e. g. Relative levels of a representative DI in EIF4E in HCT116 dTag-CLNS1A #1 after combination treatment with the indicated concentrations of PRMT5i and dTag-13 for 3 days. Red markings correspond to the dose of PRMT5i used in Figure 5e. **p<0.01 and ****p<0.0001, Student’s t-test.
Figure 6.
Figure 6.. PRMT5 regulates a conserved set of DIs in multiple mouse cell lines.
a. Summary of mouse cell lines used for AS analysis, including cancer type, driver mutations, and PRMT5i used. b. Proportion of each AS event type that is significantly different in indicated cell line after 3-day PRMT5i treatment compared to vehicle control (padj<0.05). Number above bar represents the total number of significant AS events. c. Relative expression of individual DIs across all mouse cell lines after 3-day vehicle or PRMT5i treatment. Each column represents a specific DI that is significantly upregulated or downregulated by PRMT5i-treatment in at least one cell line. Colors represent column Z-score normalized intron counts, where red indicates higher relative expression and blue indicates lower relative expression. d. Similarity matrix of the indicated class of AS event that was significantly altered by PRMT5i treatment. Each square represents the similarity between the two intersecting murine cell lines. Square coloring indicates percent similarity (Dice Similarity Score), and square size is proportional to the number of similar events. e. Bar charts of DI conservation across all mouse cell lines. Each bar represents the number of PRMT5i-upregulated DIs (padj<0.05, log2FC>0) in each cell line and the color corresponds to the number of cell lines in which a given DI is conserved across. Number to the right of the bar represents the total number of significant DIs in each line. f. Enriched GO terms from the KW Biological Process gene set for PRMT5i-upregualted DIs in each cell line (padj<0.05, log2FC>0). Terms are displayed if they are significant in at least one cell line (FDR<0.01). Color represents enrichment score, while size inversely correlates with significance value.
Figure 7.
Figure 7.. PRMT5-regulated DI identity is not conserved across species, but they occur in genes in similar complexes to regulate proliferation-associated processes.
a. Overlap of common DI-regulated (Left) processes, (Center) genes, and (Right) complexes for PRMT5-regulated DIs in human (H23) and mouse (KP393T5) lung cancer cell lines. Percentages represent the Dice Similarity Score for each comparison. b. Enrichment of DI-regulated biological processes in human and mouse cells. Each pair of bars represents a specific biological process, with the blue bar representing the FDR of the human H23 lung cancer line and the red bar representing the FDR of the mouse KP393T5 lung cancer line. Vertical dashed line represents the significance cutoff (FDR < 0.05). c. Schematic of representative DI-regulated complexes, including the minichromosome maintenance (MCM) and mediator (MED) complexes. Each shape represents a specific complex member, and a color fill of blue, red, purple, or white indicates that the complex member contained a DI in human, mouse, both species, or neither, respectively. d. Sankey plot analysis of convergence of DI-regulated complexes and biological processes. Each line represents a specific DI moving from (Column 1) gene to (Column 2) complexes to (Column 3) biological processes. Line color signifies conservation at the (left) gene or (right) complex level, and thickness corresponds to number of (Left) complexes or (Right) biological processes a given gene is a part of. Column color represents conservation at the level of (Column 1) gene, (Column 2) complexes, and (Column 3) biological processes. Blue indicates unique to human cells, red unique to mouse cells, and purple common to both species. For biological processes, white indicates DIs/complexes that map to non-significant biological processes (FDR>0.05).

References

    1. Stopa N., Krebs J.E., and Shechter D. (2015). The PRMT5 arginine methyltransferase: many roles in development, cancer and beyond. Cellular and Molecular Life Sciences 72, 2041 2059. 10.1007/s00018-015-1847-9. - DOI - PMC - PubMed
    1. Braun C.J., Stanciu M., Boutz P.L., Patterson J.C., Calligaris D., Higuchi F., Neupane R., Fenoglio S., Cahill D.P., Wakimoto H., et al. (2017). Coordinated Splicing of Regulatory Detained Introns within Oncogenic Transcripts Creates an Exploitable Vulnerability in Malignant Glioma. Cancer Cell 32, 411 426.e11. 10.1016/j.ccell.2017.08.018. - DOI - PMC - PubMed
    1. Guccione E., and Richard S. (2019). The regulation, functions and clinical relevance of arginine methylation. Nat Rev Mol Cell Bio 20, 642–657. 10.1038/s41580-019-0155-x. - DOI - PubMed
    1. Chan-Penebre E., Kuplast K.G., Majer C.R., Boriack-Sjodin P.A., Wigle T.J., Johnston L.D., Rioux N., Munchhof M.J., Jin L., Jacques S.L., et al. (2015). A selective inhibitor of PRMT5 with in vivo and in vitro potency in MCL models. Nat Chem Biol 11, 432–437. 10.1038/nchembio.1810. - DOI - PubMed
    1. Engstrom L.D., Aranda R., Waters L., Moya K., Bowcut V., Vegar L., Trinh D., Hebbert A., Smith C.R., Kulyk S., et al. (2023). MRTX1719 is an MTA-cooperative PRMT5 inhibitor that exhibits synthetic lethality in preclinical models and patients with MTAP deleted cancer. Cancer Discov. 13, 2412–2431. 10.1158/2159-8290.cd-23-0669. - DOI - PMC - PubMed

Publication types

LinkOut - more resources