[Preprint]. 2024 Dec 27:2024.12.27.628014.
doi: 10.1101/2024.12.27.628014.

Dendritic cells type 1 control the formation, maintenance, and function of tertiary lymphoid structures in cancer

Raphaël Mattiuz  1   2 Jesse Boumelha  1   2   3 Pauline Hamon  1   2   3 Jessica Le Berichel  1   2   3 Abishek Vaidya  1   2   4 Brian Y Soong  1   2 Laszlo Halasz  1   2 Emir Radkevich  1   2   5 Hye Mi Kim  6 Matthew D Park  1   2 Romain Donne  1   2   7   8 Leanna Troncoso  1   2 Darwin D'Souza  1   2   5 Medard Ernest Kaiza  6 Ian P MacFawn  6 Meriem Belabed  1   2 Guillaume Mestrallet  1   2   8   9 Etienne Humblin  1   2 Raphaël Merand  1   2   5 Clotilde Hennequin  1   2 Giorgio Ioannou  1   2 Sinem Ozbey  1   2 Igor Figueiredo  1   2 Samarth Hegde  1   2 Alexander Tepper  1   2 Hajer Merarda  1   2 Erika Nemeth  1   2 Simon Goldstein  1   2 Amanda M Reid  1   2 Moataz Noureddine  4   10 Alexandra Tabachnikova  1   2 Jalal Ahmed  1   2 Alexandros D Polydorides  11 Nina Bhardwaj  1   2   8   9 Amaia Lujambio  1   2   7   8 Zhihong Chen  1   2   5 Edgar Gonzalez Kozlova  1   2 Seunghee Kim-Schulze  1   2   5 Joshua D Brody  1   2 Michael Schotsaert  10 Christine Moussion  12 Sacha Gnjatic  1   2 Catherine Sautès-Fridman  13 Wolf Herman Fridman  13 Vladimir Roudko  1   2   5 Brian D Brown  1   2 Thomas U Marron  1   2   9   14 Jason G Cyster  15 Hélène Salmon  16 Tullia C Bruno  6 Nikhil S Joshi  17 Alice O Kamphorst  1   2 Miriam Merad  1   2   5
Affiliations

Dendritic cells type 1 control the formation, maintenance, and function of tertiary lymphoid structures in cancer

Raphaël Mattiuz et al. bioRxiv. .

Abstract

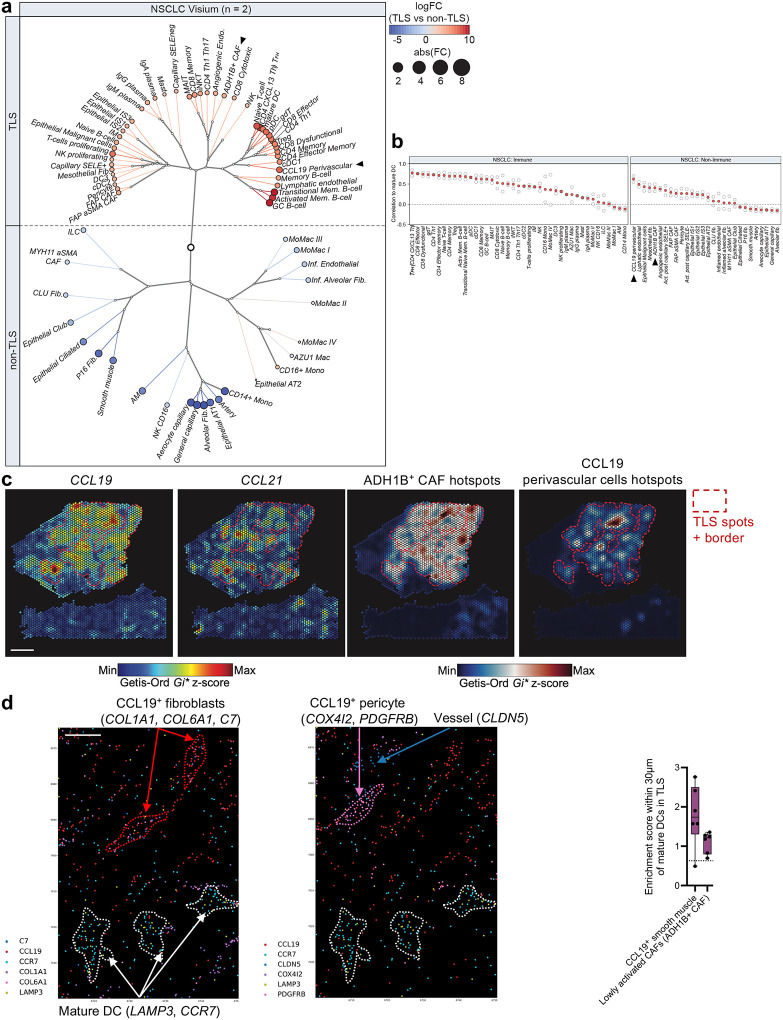
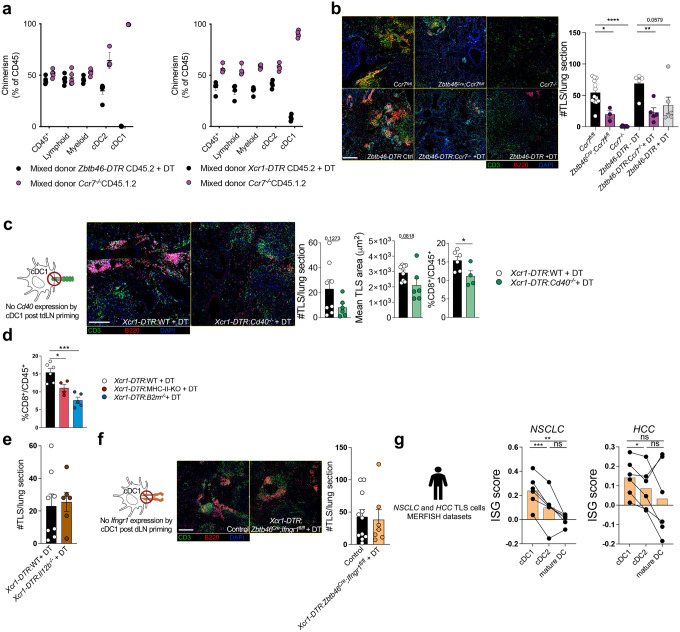
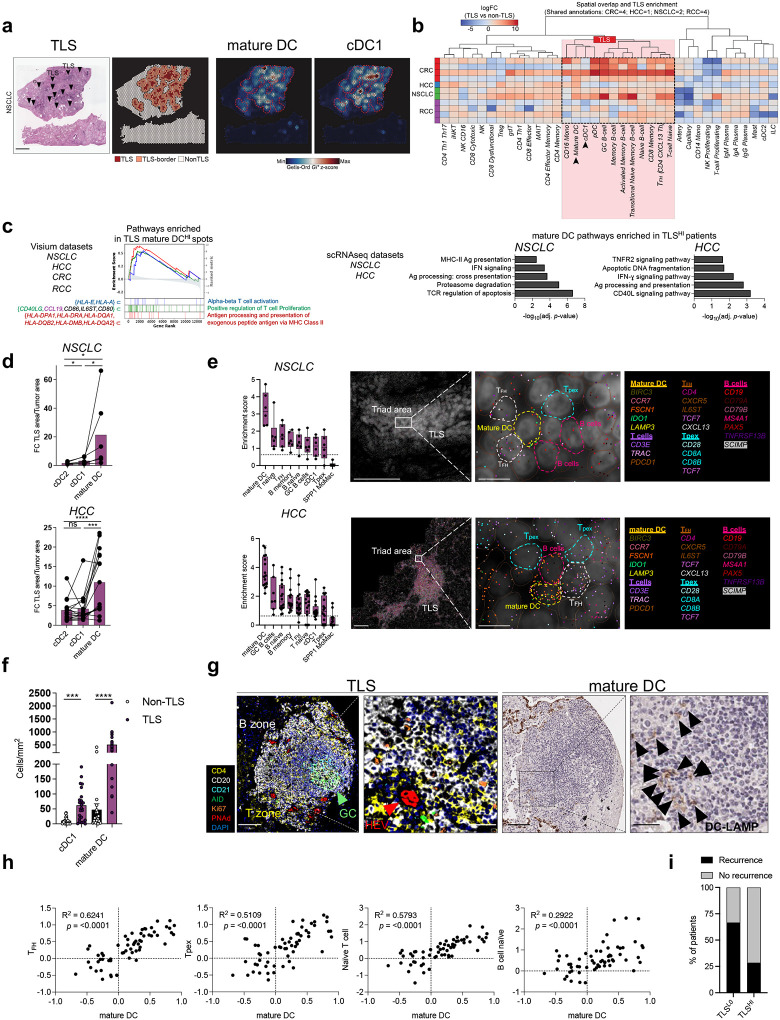
Tertiary lymphoid structures (TLS) are organized immune cell aggregates that arise in chronic inflammatory conditions. In cancer, TLS are associated with better prognosis and enhanced response to immunotherapy, making these structures attractive therapeutic targets. However, the mechanisms regulating TLS formation and maintenance in cancer are incompletely understood. Using spatial transcriptomics and multiplex imaging across various human tumors, we found an enrichment of mature dendritic cells (DC) expressing high levels of CCR7 in TLS, prompting us to investigate the role of DC in the formation and maintenance of TLS in solid tumors. To address this, we developed a novel murine model of non-small cell lung cancer (NSCLC) that forms mature TLS, containing B cell follicles with germinal centers and T cell zones with T follicular helper cells (TFH) and TCF1+PD-1+ progenitor exhausted CD8+ T cells (Tpex). Here we show that, during the early stages of tumor development, TLS formation relies on IFNγ-driven maturation of the conventional DC type 1 (cDC1) subset, their migration to tumor-draining lymph nodes (tdLN), and recruitment of activated T cells to the tumor site. As tumors progress, TLS maintenance becomes independent of T cell egress from tdLN, coinciding with a significant reduction of cDC1 migration to tdLN. Instead, mature cDC1 accumulate within intratumoral CCR7 ligand-enriched stromal hubs. Notably, timed depletion of cDC1 or disruption of their migration to these stromal hubs after TLS are formed alters TLS maintenance. Importantly, we found that cDC1-mediated antigen presentation to both CD4+ and CD8+ T cells and intact CD40 signaling, is critical for the maintenance of TLS, the preservation of the TFH cell pool, the formation of germinal center and the production of tumor-specific IgG antibodies. These findings underscore the key role of mature cDC1 in establishing and maintaining functional TLS within tumor lesions and highlight the potential for cDC1-targeting therapies as a promising strategy to enhance TLS function and improve anti-tumor immunity in patients with cancer.


Figures

Extended Fig. 1 |
Extended Fig. 1 |. Related to Fig. 1
a-d Formalin-fixed paraffin-embedded (FFPE) Visium Spatial Transcriptomics analysis of NSCLC (n = 2), HCC (n = 1), CRC (n = 4), and RCC tumors (n = 4, data from Meylan et al., Immunity, 2022). a Representative Visium HCC, CRC and RCC samples showing pathology-annotated TLS, TLS and border spots (two layers of spots located outside the TLS), and hotspots for mature DC and cDC1 gene signatures. Scale bar, 1mm. b Truthplot heatmap showing the expression of selected genes representative of DC, T cells, B cells, macrophages, and monocytes in TLS spots compared to non-TLS spots across tumor types. c Number of deconvoluted and segmented mature DC per Visium spot in non-TLS (5289, 4670, 1937, and 2103 spots), TLS (3, 128, 187, and 177 spots), and TLS-border spots (14, 177, 770, and 682 spots) across tumor types — respectively HCC, RCC, NSCLC and CRC. d Volcano plot comparing TLS mature DC-high Visium spots compared to TLS mature DC-low spots across tumor types. Mature DC gene signature is labeled. e-g MERFISH analysis of NSCLC (n = 6) and HCC (n = 16) tumors. e Representative entire TLS area showing deconvoluted and segmented mature DC, TFH, and naïve B cells (left). Density of cDC2, cDC1, and mature DC in TLS versus non-TLS areas (right) in NSCLC tumors (top) and HCC tumors (bottom). Scale bars, 5mm (overview) and 200μm (zoom). *p < 0.05; ***p < 0.001; ****p < 0.0001 (paired t-test). f Heatmap showing the expression of selected genes representative of DC, T cells and B cells in NSCLC (top) and HCC (bottom) tumors. g Non-curated cell proximity analysis showing enrichment score for immune populations within 30 μm of mature DC in TLS areas in NSCLC (left) and HCC (right). h Mean UMI of LAMP3 expression in immune populations from NSCLC (n = 32) and HCC (n = 20) tumors analyzed by scRNA-seq. i Representative multiplex IHC (MICSSS) images showing mature DC (DC-LAMP+) and cDC1 (CLEC9A+) in a TLS from an NSCLC tumor (left, representative of 23 patients, scale bar, 200μm) and mature DC, cDC1, cDC2 (CD1c+), and T cells (CD3+) in a TLS from an HCC tumor (right, representative of 6 patients, scale bars, 200μm (overview) and, 50μm (zoom)). j Representative multiplex IF staining of a mature TLS (CD4, CD20, CD21, AID, Ki67, PNAd, DAPI), paired with consecutive DC-LAMP IHC staining of a HGSOC tumor (left). Percentage of mature DC/segmented cells in TLS (n = 61 TLS) versus non-TLS (n = 116 non-TLS) areas (right). ****p < 0.0001 (unpaired t-test). k Density (left) and percentage of mature DC (right) in TLS (n = 42 TLS) versus GC+ TLS (n = 14 GC+ TLS) in NSCLC tumors. ns (unpaired t-test). l-n Bulk transcriptomes paired with TLS annotations in NSCLC (n = 168, including 60 TLSHI patients, from Genentech POPLAR dataset). l Mature DC score in TLS-positive versus TLS-negative patients. m Kaplan-Meier analysis comparing survival probability of TLS-positive versus TLS-negative patients, mature DC-high versus mature DC-low patients, and TLS-positive/mature DC-high patients versus all other patients. n Correlations of bulk RNA-seq gene signatures between mature DC and all depicted populations in TLS-positive patients and in all patients. Gene signatures for different immune cell types were generated from prior literature (Magen et al., 2023). o Percentage of mature DC among mononuclear phagocytes in tumor by scRNA-seq in TLS-high versus TLS-low groups in a neoadjuvant anti-PD-1 trial for HCC patients (n = 14 patients).
Extended Fig. 2 |
Extended Fig. 2 |. Related to Fig. 2
a Immunofluorescence analysis of KPAR1.3, KP-HELLO, and KP-HELLO-2 TLS (CD3, B220, DAPI staining), with quantification of TLS number and mean area, at d15 for KP-HELLO and KP-HELLO-2, and at d21 for KPAR1.3 (n = 10–14 per group, pooled from two independent experiments). Representative image showing TLS in KP-HELLO and KP-HELLO-2 tumors. Scale bar, 100μm. b Intratumor cDC1 depletion efficiency in Batf3−/− tumor-bearing mice quantified by flow cytometry at d15 (n = 11–14 per group, pooled from two independent experiments). c TLS number quantification in orthotopic Hep-53.4 HCC tumors (at d15 post-engraftment in the liver, n = 6–7 per group) and AKPS CRC tumors (at 6 weeks post-engraftment in the cecum, n = 3–4 per group, representative of two independent experiments) in control versus Batf3−/ mice, based on CD3, B220, and DAPI immunofluorescence staining. d KP-HELLO-2 spheroid infiltration and 3D aggregate formation by TILs as measured by BiPhoton microscopy (T and B cells purified from lung tumor-bearing mice at day 7), quantified as the number of TILs per mm3 of spheroid, in the presence or absence of mature mutuDC (cDC1 cell line) previously exposed to apoptotic KP-HELLO-2 cells (n = 3 spheroids per condition) (left). Total T and B cell number, pooled across conditions, measured by flow cytometry (n = 7 spheroids per condition) (right). *p < 0.05; **p < 0.01; ***p < 0.001; ****p < 0.0001 (unpaired t-test).
Extended Fig. 3 |
Extended Fig. 3 |. Related to Fig. 3
a Percentage of intratumor cDC1/CD45+ (left) and cDC2/CD45+ (right) in Zbtb46-DTR, Xcr1-DTR, and control mice treated or not with DT, in KP-HELLO-2 tumor-bearing mice, quantified by flow cytometry at d15 (n = 6–20 per group, pooled from two independent experiments). b Serum IgM binding to tumor cells ex vivo from naïve, control, Batf3−/−, and Xcr1-DTR mice treated with DT (n = 8–14 per group, pooled from two independent experiments). Sera were collected at d15. c Percentage of Lineage MoMac CD11c+ MHC-II/CD45+ (left), cDC1/CD45+ (middle) and cDC2/CD45+ (right) in tumor-bearing lungs and tdLN (migratory DC), in WT mice treated or not with FLT3-L-Fc at day 8, quantified by flow cytometry at d15 (n = 7–8 per group, representative of two independent experiments). *p < 0.05; ***p < 0.001; ****p < 0.0001 (unpaired t-test).
Extended Fig. 4 |
Extended Fig. 4 |. Related to Fig. 4
a-c Formalin-fixed paraffin-embedded (FFPE) Visium Spatial Transcriptomics analysis of NSCLC (n = 2) a Hierarchical clustering tree (Daylight Tree) representing the co-enrichment of cell types, displaying log fold change (logFC) and absolute fold change in TLS spots versus non-TLS spots across NSCLC immune and non-immune cell types, deconvoluted from scRNA-seq references and segmented. b Spatial correlation with mature DC among immune and non-immune cell types. Arrows indicate ADH1B+ CAFs and CCL19+ perivascular cells. c Representative Visium NSCLC sample showing pathology-annotated TLS and border spots, along with hotspots for CCL19 and CCL21 gene expression and ADH1B+ CAF and CCL19+ perivascular cell gene signatures. Scale bar, 1mm. d MERFISH Spatial Transcriptomics analysis of NSCLC tumors. Representative TLS area illustrating the proximity between mature DC and CCL19 positive stromal cells (n = 1) (left). Scale bar, 10μm. Cell proximity analysis showing the enrichment score for ADH1B+ CAFs and CCL19+ perivascular cells within 30 μm of mature DC in TLS areas (n = 6) (right).
Extended Fig. 5 |
Extended Fig. 5 |. Related to Fig. 4
a Chimerism of donor bone marrow cells (CD45.2+ or CD45.1.2+) expressed as a percentage of total CD45+ cells in the indicated populations in DT-treated mixed bone marrow chimeras Zbtb46-DTR CD45.2:Ccr7−/− CD45.1.2 mice (left, n = 4 per group) and Xcr1-DTR CD45.2:Ccr7−/− CD45.1.2 mice (right, n = 5 per group, representative of two independent experiments) at d15 post-tumor engraftment. b-c, e, f Immunofluorescence analysis of TLS (stained for CD3, B220, and DAPI) and quantification of TLS number at d15 post-tumor engraftment. b Representative images (left) and quantification in Ccr7fl/fl, Zbtb46Cre;Ccr7fl/fl, Ccr7−/− mice, in Zbtb46-DTR bone marrow chimera mice treated or not with DT, and Zbtb46-DTR CD45.2:Ccr7−/− CD45.1.2 mixed bone marrow chimera mice treated with DT (n = 3–13 per group, representative of two independent experiments). Scale bar, 200μm. c Quantification of TLS number and mean area in DT-treated Xcr1-DTR:WT versus Xcr1-DTR:Cd40−/− mixed bone marrow chimera mice (n = 6–8 per group, scale bar, 200μm) and intratumor quantification by flow cytometry at d15 of CD8+ T cells among immune cells. d Intratumor quantification by flow cytometry at d15 of CD8+ T cells among immune cells in DT-treated Xcr1-DTR/WT, Xcr1-DTR:MHC-II-KO and Xcr1-DTR:B2m−/− mixed bone marrow chimera mice (n = 4–6 per group, representative of two independent experiments). b-d *p < 0.05; **p < 0.01; ***p < 0.005; ****p < 0.001 (unpaired t-test). e TLS number in DT-treated Xcr1-DTR:WT versus Xcr1-DTR:Il12b−/− mixed bone marrow chimera mice (n = 6–8 per group). f Representative image and TLS number in control bone marrow chimera versus DT-treated Xcr1-DTR:Zbtb46Cre;Ifngr1fl/fl mixed bone marrow chimera mice (n = 7–11 per group). Scale bar, 200μm. g MERFISH spatial transcriptomics analysis of human NSCLC (n = 6, left) and HCC (n = 6, right) tumors showing normalized ISG gene module scores for cDC1, cDC2, and mature DC within TLS. *p < 0.05; **p < 0.01; ***p < 0.005; (paired t-test).
Fig. 1 |
Fig. 1 |. Mature DC accumulate in TLS across human cancers.
a, b Formalin-fixed paraffin-embedded (FFPE) Visium Spatial Transcriptomics analysis of NSCLC (n = 2), HCC (n = 1), CRC (n = 4), and RCC tumors (n = 4, data from Meylan et al., Immunity, 2022). a Representative Visium NSCLC sample showing pathology-annotated TLS (left, scale bar, 1mm), TLS and border spots (two layers of spots located outside the TLS), and hotspots for mature DC and cDC1 gene signatures (right). b Heatmap displaying log fold change (logFC) in TLS spots versus non-TLS spots across shared immune cell types, deconvoluted from scRNA-seq references and segmented across tumor types. c Gene set enrichment analyses of TLS mature DC-high Visium spots compared to TLS mature DC-low spots across tumor types (left) and of mature DC scRNA-seq clusters from TLS-high patients compared to others in NSCLC and HCC (right) (n = 14 TLSHI and n = 18 TLSLO NSCLC patients; n = 8 TLSHI and n = 6 TLSLLO HCC patients). d, e MERFISH Spatial Transcriptomics analysis of NSCLC (n = 6) and HCC (n = 16) tumors. d Fold change of mature DC, cDC1, and cDC2 populations in TLS versus non-TLS areas in NSCLC (top) and HCC (bottom). *p < 0.05; ***p < 0.001; ****p < 0.0001 (Wilcoxon rank sum test). e Cell proximity analysis showing enrichment score for immune populations within 30 μm of mature DC in TLS areas, with representative TLS area illustrating interactions between mature DC, TFH, Tpex, and B cells in NSCLC (top, scale bars, left 100μm and right 10μm) and HCC (bottom, scale bars, left 200μm and right 10μm). f Quantification of mature DC (DC-LAMP+) and cDC1 (CLEC9A+) densities in non-TLS versus TLS regions by multiplex IHC (MICSSS) in NSCLC patients (n = 23); epithelial cells expressing DC-LAMP were excluded from the analysis. ***p < 0.001; ****p < 0.0001 (paired t-test). g Representative multiplex IF staining of a mature TLS (CD4, CD20, CD21, AID, Ki67, PNAd, DAPI), paired with consecutive DC-LAMP IHC staining of NSCLC tumors. Representative of 14 TLS. Scale bars, 100μm (overview) and 50μm (zoom). h Gene signatures derived from bulk transcriptomes paired with TLS annotations in NSCLC, showing correlations of bulk RNA-seq gene signatures between mature DC and TFH, Tpex, naïve T and B cells in TLS-positive patients (n = 60, from Genentech POPLAR dataset). Gene signatures for different immune cell types were generated from prior literature (Magen et al., 2023). p < 0.0001 (Pearson correlation). i Recurrence status in TLS-high versus TLS-low groups in a neoadjuvant anti-PD-1 trial for patients with HCC (n = 13 patients).
Fig. 2 |
Fig. 2 |. Mature cDC1 control TLS formation.
a Schematic representation of constructs used to generate KP-HELLO-2. b-h Immunofluorescence analysis of representative KP-HELLO-2 TLS at d15 post-engraftment in WT mice. b Staining of B cell and T cell zones with B220 and CD3. Scale bar, 100μm. c GC+-TLS stained with AID, CD19, CD4, CD8, CD21, and Ki67. Representative of 7 mice. Scale bar, 50μm. d Representative images and density quantification of TFH (CD8 PD-1+ TCF1+) and Tpex (CD8+ PD-1+ TCF1+) in TLS and non-TLS areas. Scale bar, 200μm. **p < 0.01 (paired t-test). e Adoptively transferred antigen-specific CD4 T cells (SMARTA CD45.1) stained with CD45.1, PD-1, and CD4; antigen-specific B cells stained with HEL antigen, B220, and GL7. Representative of 10 mice. Scale bar, 100μm. f mature DC (CD11c+ MHC-II+ CCR7+ CD86+) within mature TLS stained with B220, CD4, CD8, TCF1, BCL6, and Ki67. Representative of 2 mice. Scale bar, 100μm. g Inverse correlation between TLS area and tumor area (% of lung area) in WT mice (n = 32). h Representative images of TLS from Xcr1-mCherry-Cre mice showing CD3 and B220 immunofluorescence, paired with consecutive IHC staining for CD11c and mCherry, and quantification of cDC1 density in TLS and non-TLS areas (n = 5 mice). Scale bar, 100μm. i cDC1 maturation status (CD40 and CD86 expression in mScarlet+ cDC1) at d12 post-engraftment (representative of 13 mice from two experiments). Immunofluorescence of TLS (CD3, B220, DAPI, scale bar, 200μm), number and mean size, tumor area assessed by H&E on consecutive sections, scale bar, 1mm, and intratumor quantification of T(PD-1+ CXCR5+ CD4+), GC B cells (CD19+ IgD, IgM, GL7+), TH1 (IFNγ+ CD4+), and CD8+ T cells by flow cytometry on d15 in j Batf3−/− (n = 11–14 per group, pooled from two independent experiments) and m Zbtb46Cre; Ifngr1fl/fl (n = 10–11 per group, representative of two independent experiments) and n Zbtb46Cre; Ccr7fl/fl mice (n = 13–20 per group, pooled from two independent experiments) versus littermate controls. k Gene set enrichment analysis for IFNγ response and DC migration in TLS mature DC-high Visium spots compared to other spots in human NSCLC, HCC, CRC, and RCC slides. l Schematic representation of Ifngr1 and Ccr7 deletion in DC. *p < 0.05; **p < 0.01; ***p < 0.001; ****p < 0.0001 (unpaired t-test).
Fig. 3 |
Fig. 3 |. Mature cDC1 are required locally for TLS maintenance and function.
a-c, g, i, j, l, m Immunofluorescence analysis of TLS (CD3, B220, DAPI staining) and quantification at d15 or as indicated. a T cell egress from tdLN blocked with FTY720 from d-1 to d4, d5 to d9, or d10 to d15 post-tumor engraftment. TLS quantification was performed at day 15 (n = 5–6 per group, representative of two independent experiments). Scale bar, 200μm. b, c TLS formation kinetics (n = 6–7 per timepoint, representative of two independent experiments), with b H&E staining on consecutive sections showing vessels, scale bar, 100μm, and c kinetic analysis of immune populations in tumor and tdLN by flow cytometry, including percentages of DC uptaking tumor debris (mScarlet+) (left) and their maturation (CD40+ CD86+) (right). d Tumor-antigen-specific, T-bet+, and TFH (PD-1+ CXCR5+) cells among CD4+ T cells. e CD8+ PD-1+ T cells, subdivided into CD39+ TCF1 and CD39 TCF1+ populations, among immune cells. f GC B cells among B cells (left) and kinetics of serum IgG and IgM binding to tumor cells ex vivo at the indicated time points (right). g-k DC or cDC1 depletion using DT from d8 to d15 in DTR mice. g TLS quantification in Zbtb46-DTR, Xcr1-DTR and control mice treated or not with DT (n = 8–14 per group, pooled from two independent experiments). Scale bar, 200μm. h Quantification of intratumor TFH cells among CD4+ T cells at d15 in Xcr1-DTR mice treated with DT versus control mice (n = 14–25 per group, pooled from four independent experiments). i, j GC+-TLS staining (AID, CD19, CD4, CD8, CD21, and Ki67) in Xcr1-DTR mice treated with DT versus control mice, i with zoom depicting follicular DC (CD19 CD21+) within GC+-TLS and proportions of mice with ≥1 GC+-TLS (n = 3–7 per group, 196 TLS analyzed, including 7 GC+-TLS) per whole lung slide. Scale bar, 100μm. j AID, Ki67 and CD8 staining within TLS and quantification of CD8+ T cells, Ki67+ cells, and AID+ Ki67+ B cells in TLS of Xcr1-DTR mice treated with DT versus control mice (n = 3 per group, 229 TLS analyzed). Scale bar, 100μm. k Serum IgG binding to tumor cells ex vivo from naïve, control, Batf3−/−, and Xcr1-DTR treated with DT mice (n = 8–14 per group, pooled from two independent experiments). Sera were collected at d15. l TLS quantification in Xcr1-DTR mice treated with FTY720 starting at d8 and with or without DT starting at d9 (n = 6–8 per group). Scale bar, 200μm. m TLS quantification in WT mice treated or not with FLT3-L-Fc at d8 (n = 7–8 per group, representative of two independent experiments). Scale bar, 200μm. a, g, h, j-m *p < 0.05; **p < 0.01; ***p < 0.001; ****p < 0.0001 (unpaired t-test). n Overall survival of Xcr1-DTR mice treated with DT (from d8 to d15) versus control mice (n = 21–29 per group, pooled from three independent experiments), with all mice reaching the humane endpoint by d15 post-engraftment. ****p < 0.0001 (Log-rank (Mantel-Cox) test).
Fig. 4 |
Fig. 4 |. Local cDC1 Migration to CCR7 Ligand Hubs and Antigen Presentation control TLS Maintenance
a Heatmap showing relative expression of ligand-receptor pairs by MERFISH between ADH1B+ CAF, CCL19 perivascular cells, DC and T cell populations within TLS in NSCLC patients (n = 6). b Representative multiplex IHC staining of a TLS from an NSCLC tumor (stained for ADH1B, CCL19, CD3, CD20, DC-LAMP, and MYH11), representative of 3 patients. Panel 1 shows CCL19 with both ADH1B+ and MYH11+ cells, panel 2 shows CCL19 co-localizing with ADH1B+ cells and panel 3 shows CCL19 around MYH11+ cells. Scale bars, 200μm (overview) and 50μm (zoom). c. Schematic of Xcr1-DTR: KO 1:1 mixed bone marrow chimeras experiments, DT administration starting at d8 post-tumor engraftment resulted in the depletion of the entire wild-type cDC1 compartment, leaving only cDC1 that are knockout for the genes of interest. d-g Immunofluorescence analysis of TLS (stained for CD3, B220, and DAPI), with quantification of TLS number and mean area at d15. d Comparison of Xcr1-DTR controls versus DT-treated Xcr1-DTR:Ccr7−/− CD45.1.2 mice (n = 5 per group, representative of two independent experiments). Scale bar, 200μm. e Comparison of control bone marrow chimera versus DT-treated Xcr1-DTR:Ccl19−/− mice (n = 7–8 per group). f Comparison of DT-treated Xcr1-DTR/WT versus Xcr1-DTR:MHC-II-KO and Xcr1-DTR:B2m−/− mice (n = 4–8 per group, representative of two independent experiments). Panel 1 and 2 depicting B cell and T cell dispersion (right). Scale bars, 200μm (overview) and 100μm (zoom). Intratumor quantification by flow cytometry at d15 includes d, g TFH among CD4+ T cells, g CD8+ PD-1+ T cells among immune cells, TCF1+ cells among CD8+ PD-1+ T cells, and cDC1 among immune cells. h Serum IgG binding to tumor cells ex vivo from naïve, Xcr1-DTR:WT, Xcr1-DTR:MHC-II-KO and Xcr1-DTR:B2m−/− treated with DT mice (n =4–6 per group, representative of two independent experiments). Sera were collected at d15. d, e, g *p < 0.05; **p < 0.01 (unpaired t-test). f, h *p < 0.05; **p < 0.01 (Mann-Whitney U test).

Similar articles

References

    1. Alspach E., Lussier D.M., Miceli A.P., Kizhvatov I., DuPage M., Luoma A.M., Meng W., Lichti C.F., Esaulova E., Vomund A.N., Runci D., Ward J.P., Gubin M.M., Medrano R.F.V., Arthur C.D., White J.M., Sheehan K.C.F., Chen A., Wucherpfennig K.W., Jacks T., Unanue E.R., Artyomov M.N., Schreiber R.D., 2019. MHC-II neoantigens shape tumour immunity and response to immunotherapy. Nature 574, 696–701. 10.1038/s41586-019-1671-8 - DOI - PMC - PubMed
    1. Belabed M., Park M.D., Blouin C.M., Balan S., Moon C.Y., Boumelha J., Peros A., Mattiuz R., Reid A.M., Azimi C.S., LaMarche N.M., Troncoso L., Amabile A., Berichel J.L., Chen S.T., Wilk C.M., Brown B.D., Radford K., Ghosh S., Rothlin C.V., Yvan-Charvet L., Marron T.U., Puleston D.J., Bhardwaj N., Lamaze C., Merad M., 2023. AXL limits the mobilization of cholesterol to regulate dendritic cell maturation and the immunogenic response to cancer. 10.1101/2023.12.25.573303 - DOI - PubMed
    1. Cabrita R., Lauss M., Sanna A., Donia M., Skaarup Larsen M., Mitra S., Johansson I., Phung B., Harbst K., Vallon-Christersson J., van Schoiack A., Lövgren K., Warren S., Jirström K., Olsson H., Pietras K., Ingvar C., Isaksson K., Schadendorf D., Schmidt H., Bastholt L., Carneiro A., Wargo J.A., Svane I.M., Jönsson G., 2020. Tertiary lymphoid structures improve immunotherapy and survival in melanoma. Nature 577, 561–565. 10.1038/s41586-019-1914-8 - DOI - PubMed
    1. Chaurio R.A., Anadon C.M., Lee Costich T., Payne K.K., Biswas S., Harro C.M., Moran C., Ortiz A.C., Cortina C., Rigolizzo K.E., Sprenger K.B., Mine J.A., Innamarato P., Mandal G., Powers J.J., Martin A., Wang Z., Mehta S., Perez B.A., Li R., Robinson J., Kroeger J.L., Curiel T.J., Yu X., Rodriguez P.C., Conejo-Garcia J.R., 2022. TGF-β-mediated silencing of genomic organizer SATB1 promotes Tfh cell differentiation and formation of intra-tumoral tertiary lymphoid structures. Immunity 55, 115–128.e9. 10.1016/j.immuni.2021.12.007 - DOI - PMC - PubMed
    1. Cui C., Wang J., Fagerberg E., Chen P.-M., Connolly K.A., Damo M., Cheung J.F., Mao T., Askari A.S., Chen S., Fitzgerald B., Foster G.G., Eisenbarth S.C., Zhao H., Craft J., Joshi N.S., 2021. Neoantigen-driven B cell and CD4 T follicular helper cell collaboration promotes anti-tumor CD8 T cell responses. Cell 184, 6101–6118.e13. 10.1016/j.cell.2021.11.007 - DOI - PMC - PubMed

Publication types