[Preprint]. 2024 Dec 22:2024.12.20.629467.
doi: 10.1101/2024.12.20.629467.

Bispecific antibody targeting of lipid nanoparticles

Affiliations

Bispecific antibody targeting of lipid nanoparticles

Angelo Amabile et al. bioRxiv. .

Abstract

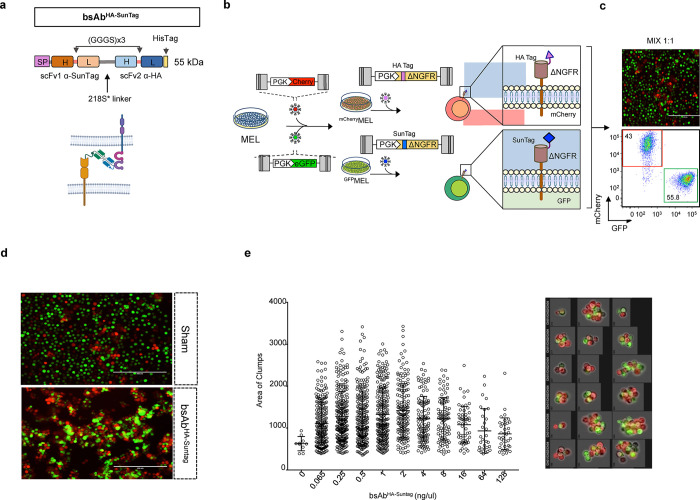
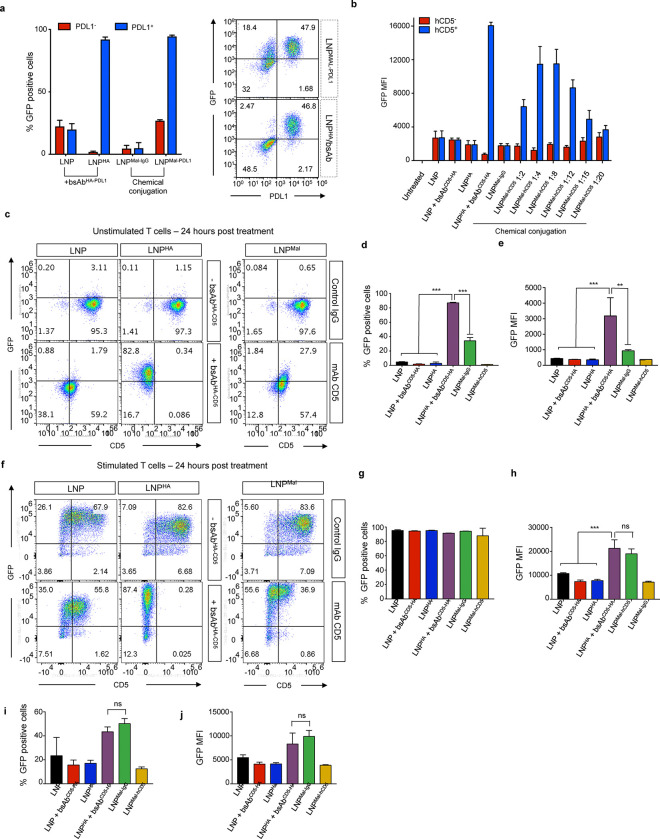
Lipid nanoparticles (LNP) are the most clinically advanced non-viral gene delivery system. While progress has been made for enhancing delivery, cell specific targeting remains a challenge. Targeting moieties such as antibodies can be chemically-conjugated to LNPs however, this approach is complex and has challenges for scaling up. Here, we developed an approach to generate antibody-conjugated LNPs that utilizes a bispecific antibody (bsAb) as the targeting bridge. As a docking site for the bsAb, we generated LNPs with a short epitope, derived from hemagglutinin antigen (HA), embedded in the PEG component of the particle (LNPHA). We generated bsAb in which one domain binds HA and the other binds different cell surface proteins, including PD-L1, CD4, CD5, and SunTag. Non-chemical conjugation of the bsAb and LNP resulted in a major increase in the efficiency and specificity of transfecting cells expressing the cognate target. LNP/bsAb mediated a 4-fold increase in in vivo transfection of PD-L1 expressing cancer cells, and a 26-fold increase in ex vivo transfection of quiescent primary human T cells. Additionally, we created a universal bsAb recognizing HA and anti-rat IgG2, enabling LNP tethering to off-the-shelf antibodies such as CD4, CD8, CD20, CD45, and CD3. By utilizing a molecular dock and bsAb technology, these studies demonstrate a simple and effective strategy to generate antibody-conjugated LNPs, enabling precise and efficient mRNA delivery.


Conflict of interest statement

DECLARATION OF INTERESTS The authors declare no competing financial interests

Figures

Figure 1.
Figure 1.. Generation of a linear epitope binding bispecific antibody.
a. Schematic of bsAbHA-SunTag and depiction of activity in bringing epitope expressing cell types together. SP:signal peptide, scFV: single chain variable fragment. b. Schematic outlining generation of the cell populations expressing the targets of the bsAbHA-SunTag used in the experimental conditions. MEL leukemia cells were transduced with a lentiviral vector (LV) expressing mCherry or GFP. MELmCherry and MELGFP were subsequently transduced with a LV expressing delta-NGFRHA and delta-NGFRSuntag respectively. MELmCherry/NGFR-HA and MELGFP/NGFR-Suntag were mixed in 1:1 ratio. c. The relative frequency of MELmCherry/NGFR-HA and MELGFP/NGFR-Suntag cells was assessed by florescent microscopy and flow cytometry. Shown is a representative image (20x) of the cell mix (top) and dot plot from the flow cyometry (bottom). d. Microscopy image of MELGFP/NGFR-Suntag and MELmCherry/NGFR-HA cell cultures incubated with 1 mg/ul of purified bsAbHA-SunTag or unrelated bsAb. Image is representative from 3 independent cell-cell aggregation experiments. e. Quantification (left histogram) and visualization (representative images on the right) of clumps of MELeGFP/NGFR-Suntag and MELmCherry/NGFR-HA cells measured by Amnis® Image-Stream analysis. Experiment was repeated 3 independent times.
Figure 2.
Figure 2.. bsAb-coupled LNP mediates enhanced ligand-specific cell transfection.
a. Schematic of the LNPHA with bound bsAb (left) and depiction of bsAb-mediated uptake through ligand binding. b. Schematic showing how LNPHA can be redirected to different cell types with different bsAb. c. Schematic showing the bidirectional lentiviral vector (Bid.LV) used to generate PD-L1Suntag/BFP reporter cell line (top). Representative dot-plot of human erythroleukemia cells (K562) transduced with Bid.LV PD-L1Suntag/BFP, K562PD-L1/SunTag (Bottom). d. Size analysis by DLS of SM-102 LNP (green) and SM-102 LNPHA (purple) particles (left). Histograms showing mRNA encapsulation efficiency in LNP and LNPHA as measured by RiboGreen assay (right). Graphs are representative of all LNP-mRNA particles generated in the study. e. Flow cytometry analysis of GFP and and PD-L1 expression in K562PD-L1/SunTag cells transfected with 10 ng of GFP mRNA in LNP or LNPHA with or without bsAbHA-Suntag. Shown are representative dotplots. Data representative of 5 independent experiments, with n=3 biological replicates for each experiment. f. Graphs show the mean±s.d. percentage of GFP-positive K562PD-L1/SunTag cells from (e). Analysis of GFP expression was performed 24 hours post-transfection. Two-way anova and Tukey’s multiple comparison post-test, **p<0.001; ****p<0.00001 (n=3). Data representative of 5 independent experiments. g. Flow cytometry analysis of GFP and and PD-L1 expression in 293TPD-L1/SunTag cells transfected with 10 ng of GFP mRNA in LNP or LNPHA with or without bsAbHA-Suntag. Representative dotplots shown (n=3–8, 3 independent experiments) (left). Graph (right) shows fold change of GFP mean florescence intensity (MFI) of PD-L1Suntag positive cells treated with bsAbHA-Suntag compared to untreated cells. h. Flow cytometry analysis of GFP and and PD-L1 expression in K562PD-L1/SunTag cells transfected with 10 ng of GFP mRNA in Dlin-MC3 LNPHA or ALC-0315 LNPHA in absence (left column) or presence (right column) of bsAbHA-Suntag. Analysis performed 24 hours post transfection. i. Graphs showing percentage (left) and MFI (right) of GFP positive cells from (h). Statistical analysis: two-way anova and Tukey’s multiple comparison post-test,; ***p<0.0001 (n=3) Data representative of one independent experiment.
Figure 3.
Figure 3.. LNPHA/bsAb increases in vivo targeting of PD-L1+ tumor and CD4 T cells.
a. Schematic of the bsAbHA-Suntag and its binding domain on K562PD-L1-SunTag (bottom left) and bsAbHA/PD-L1 (top right) and its binding domain on K562PD-L1-SunTag (bottom right). Flow cytometry analysis of K562PD-L1-SunTag treated with 10 ng of GFP mRNA LNPHA incubated with either bsAbHA-Suntag or bsAbHA-PD-L1. GFP and PD-L1 levels were measured after 24 hours. b. Graphs show the mean±s.d. percentage of GFP+ K562mPDL1 transfected with 20 ng GFP mRNA LNP or LNPHA +/− bsAbHA/PD-L1 (n=3 biological replicates, 2 independent experiments). Two-way anova and Tukey’s multiple comparison post-test, ***p<0.0001; ****p<0.00001. c. Graphs show the percentage of transfected PD-L1+ and PD-L1− B16F10dsRed-LSL-GFP melanoma cells following intratumoral injection of melanomas with matching concentrations of Cre mRNA encapsulated in LNPHA or LNPHA+bsAbHA-PD-L1. Analysis was performed by flow cytometry. Each dot is a separate mouse. Two-way anova and Tukey’s multiple comparison post-test, **p<0.001. Schematic of the experiment shown (top). d. Graphs show the percentage of transfected PD-L1+ and PD-L1− ID8dsRed-LSL-GFP ovarian cancer cells following i.p. injection of ovarian tumor bearing mice with matching concentrations of Cre mRNA encapsulated in LNPHA or LNPHA+bsAbHA-PD-L1. Analysis was performed by flow cytometry. Each dot is a separate mouse. Two-way anova and Tukey’s multiple comparison post-test, **p<0.001. Schematic of the experiment shown (top). e. Graphs show the percentage of transfected PD-L1+ and PD-L1− KCdsRed-LSL-GFP pancreatic cancer cells following i.p. injection of pancreatic tumor bearing mice with matching concentrations of Cre mRNA encapsulated in LNPHA or LNPHA+bsAbHA-PD-L1. Each dot is a separate mouse. Two-way anova and Tukey’s multiple comparison post-test, **p<0.001. Schematic of the bsAbHA-CD4 (top left) bound to its target, CD4, on murine T cell. f. Schematic of the bispecific antibody recognizing HA and CD4. g. Flow cytometry analysis of tdTomato and CD4 expression on total splenocytes isolated from Ai14 mice and transfected with 50 ng Cre mRNA encapsulated in LNP, LNPHA, LNPHA+bsAbHA-CD4. Cultures included IL-2 and anti-CD3/CD28 beads to activate/expand T cells. Shown are representative dotplots. h. Flow cytometry analysis of splenocytes isolated from Ai14 mice i.v. injected with Cre mRNA encapsulated in LNP or LNPHA and coupled with or without bsAbHA-CD4. Spleens collected 3 days post injection. Dotplots are representative of n=3 mice group, 2 independent experiments. i. Graphs show percent transfection of CD4+ and CD4− splenocytes from (h) (n=3 mice, 2 independent experiments). j. Graphs show in vivo targeting efficiency of the different LNP formulations calculated by the ratio of tdTomato+ CD4+ to CD4− splenocytes from (h). k. Graphs show the percentage of GFP+ resting human T cells treated with 200 ng GFP mRNA encapsulated in LNP or LNPHA with or without bsAbHA-CD5. Expression was measured 24 hours post transfection. Two-way anova and Tukey’s multiple comparison post-test, **p<0.001; ***p<0.0001(n=4). Data representative of 3 independent experiments. l. Graphs showing the GFP MFI of resting human T cells treated as in (k). Two-way anova and Tukey’s multiple comparison post-test, ***p<0.0001(n=4). Data representative of 3 independent experiments.
Figure 4.
Figure 4.. Comparison of cell transfection by LNPHA/bsAb and thiol-Mal-conjugated LNP.
a. Flow cytometry analysis of GFP and PD-L1 expression in K562mPDL1 cells transfected with the indicated LNP. Graph (left) shows the mean±s.d. of GFP+ cells. Dotplots (right) are representative from the experiment. All groups used matched concentrations of LNP-RNA (10 ng). GFP expression was measured 24 hours post transfection. (n=3 per group, 3 independent experiments performed) b. Flow cytometry analysis of GFP and CD5 expression in K562hCD5 transfected with 10 ng GFP mRNA encapsulated in the indicated LNP. Graph shows the mean±s.d. of GFP mean florescence intensity (MFI) of GFP+ cells. (n=3 per group, 3 independent experiments performed) c. Flow cytometry analysis of GFP and CD5 expression in resting human T cells treated with 200 ng GFP RNA encapsulated in SM-102 LNP (left), SM-102 LNPHA (center) with or without bsAbCD5-HA or with LNPMAL-hCD5. Representative dotplots are shown (n=3 per group, 3 independent experiments performed). d. Graph showing the mean±s.d. of the percentage of GFP+ resting human T cells treated as in (c). One-way anova and Tukey’s multiple comparison post-test, ***p<0.0001; Data representative of 3 independent experiments with n=3 per group. e. Graph showing the mean±s.d. GFP MFI of resting human T cells treated as in (c). Statistical analyis: One-way anova and Tukey’s multiple comparison post-test, **p<0.001 ***p<0.0001 (n=3) ; Data representative of 3 independent experiments. f. Flow cytometry analysis of GFP and CD5 expression in activated human T cells treated with 200 ng GFP mRNA encapsulated in SM-102 LNP or SM-102 LNPHA with or without bsAbCD5-HA, or LNPMAL-hCD5 or LNPMAL-IgG. Expression was measured 24 hours post-transfection. Data representative of 3 independent experiments (n=3 per group per experiment). g. Graph showing the mean±s.d. percentage of GFP+ activated human T cells treated as in (f). One-way anova and Tukey’s multiple comparison post-test, ***p<0.0001 (n=3); Data representative of 3 independent experiments. (n=3 per group, 3 independent experiments performed) h. Graph showing the mean±s.d. GFP MFI of activated human T cells treated as in (g). (n=3 per group, 3 independent experiments performed) i. Graph showing the mean±s.d. percent of GFP+ activated human T cells treated as in (g) at 3 days post transfection. (n=3 per group, 3 independent experiments performed) j. Graph showing the mean±s.d. GFP MFI in activated human T cells treated as in (g) at 3 days post transfection. (n=3 per group, 3 independent experiments performed)
Figure 5.
Figure 5.. Tether bsAb platform redirect LNPHA towards target cell type in presence of monoclonal antibody.
a. Schematic depicting the bsAbHA-ratIgG2b tethering antibody binding to LNPHA particles and a monoclonal antibody with the recognized constant region (Rat IgG2b). b. Flow cytometry analysis of GFP expression in K562mPDL1 cells transfected with 10 ng of GFP mRNA encapsulated in SM-102 LNP or SM-102 LNPHA with or without bsAbHA/PD-L1 or with bsAbHA/ratIgG2b with or without PD-L1 monoclonal antibody. GFP expression was measured 24 hours post transfection. Graphs show the mean±s.d. of the percentage of GFP+ cells. c. Representative dotplots and graphs of total splenocytes treated with Cre mRNA encapsulated in LNP or LNPHA with or without bsAbHA-IgG2b and the indicated monoclonal antibody. Analysis was performed 48 hours after LNP treatment. Data representative of 3 independent experiments.

References

    1. Hou X., Zaks T., Langer R. & Dong Y. Lipid nanoparticles for mRNA delivery. Nat. Rev. Mater. 6, 1078–1094 (2021). - PMC - PubMed
    1. Semple S. C. et al. Rational design of cationic lipids for siRNA delivery. Nat. Biotechnol. 28, 172–176 (2010). - PubMed
    1. Cui L. et al. Mechanistic Studies of an Automated Lipid Nanoparticle Reveal Critical Pharmaceutical Properties Associated with Enhanced mRNA Functional Delivery In Vitro and In Vivo. Small Weinh. Bergstr. Ger. 18, e2105832 (2022). - PubMed
    1. Mui B. L. et al. Influence of Polyethylene Glycol Lipid Desorption Rates on Pharmacokinetics and Pharmacodynamics of siRNA Lipid Nanoparticles. Mol. Ther. Nucleic Acids 2, e139 (2013). - PMC - PubMed
    1. Akinc A. et al. The Onpattro story and the clinical translation of nanomedicines containing nucleic acid-based drugs. Nat. Nanotechnol. 14, 1084–1087 (2019). - PubMed

Publication types

LinkOut - more resources