[Preprint]. 2025 Sep 22:2024.12.26.630393.
doi: 10.1101/2024.12.26.630393.

Ultrastructural membrane dynamics of mouse and human cortical synapses

Affiliations

Ultrastructural membrane dynamics of mouse and human cortical synapses

Chelsy R Eddings et al. bioRxiv. .

Abstract

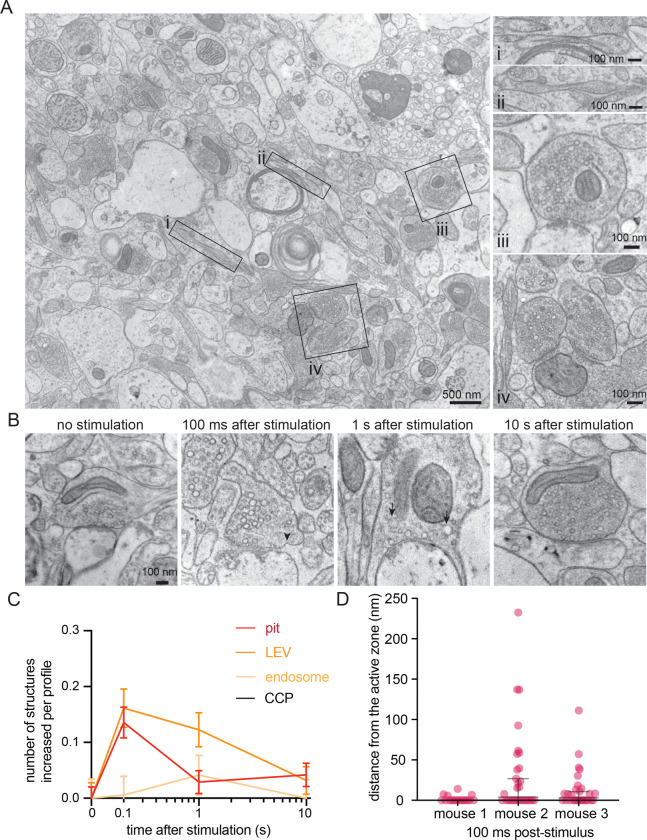
Live human brain tissues provide unique opportunities for understanding synaptic transmission. Investigations have been limited to anatomy, electrophysiology, and protein localization-while crucial parameters such as synaptic vesicle dynamics were not visualized. Here we utilize zap-and-freeze time-resolved electron microscopy to overcome this hurdle. First, we validate the approach with acute mouse brain slices to demonstrate that slices can be stimulated to produce calcium signaling. Next, we show that synaptic vesicle endocytosis is induced in both mouse and human brain slices. Crucially, clathrin-free endocytic pits appear immediately next to the active zone, where ultrafast endocytosis normally occurs, and can be trapped at this location by a dynamin inhibitor. In both species a protein essential for ultrafast endocytosis, Dynamin 1xA, localizes to the region peripheral to the active zone, the putative endocytic zone, indicating a possible conserved mechanism between mouse and human. This approach has the potential to reveal dynamic, high-resolution information about synaptic membrane trafficking in intact human brain slices.

Keywords: 2-photon calcium imaging; Dynamin 1xA; cerebellum; cortex; high-pressure freezing; human neocortex; stimulated emission depletion microscopy; synaptic transmission; synaptic vesicle endocytosis; time-resolved electron microscopy; ultrafast endocytosis; zap-and-freeze.


Figures

Figure 1.
Figure 1.. 2-photon calcium imaging of acute mouse cerebellar slices on the zap board.
(A) Acute mouse cerebellar slices were prepared by sectioning the cerebellar vermis horizontally to produce axons with known orientation. Arrow indicates vibratome cut direction. (B) A zap board enabling electrical stimulation in the Leica EM ICE high-pressure freezer. (C) Overlay image of a 6 mm wide rubber O-ring, two sapphire disks and a Mylar spacer ring in between two sapphire disks. When assembled, a specimen is sandwiched between the two sapphire disks. (D) A schematic showing another view of the assembly holding the slice in the zap board chamber. (E) Horizontal 100 μm cerebellar slice lying between two sapphire discs and a Mylar spacer ring for 2-photon imaging on the zap board. Parallel fibers (PF) from the ascending axons of granule cells (GCs) are in line with the electrical dipoles ((−) to (+)) and were imaged orthogonally in the line-scan mode (arrow, 3° deviated in this example). (F) Zoom-in image of a slice indicating the PFs in the molecular layer (ML), arising from GCs in the granule cell layer (GCL). An arrow depicts the orientation of the line scan. PCL: Purkinje cell layer. (G) Normalized Fura-2, AM signal after a single (1x) and two consecutive (2x, 50 ms apart) stimuli. (H) Polar coordinate plot of normalized Ca2+ signal vs. linescan / PF orientation. 0/180° account for PFs lying in line with the electrical dipole, while at 90/270° PFs lie orthogonally to the dipole. Circles indicate Ca2+ signal strength. n=25 slices from 4 mice. (I) Plot showing the normalized Ca2+ signal versus stimulus duration. Data are presented as mean ± SEM. n=10 slices from 2 mice. (J) Plot showing the normalized peak Ca2+ signal versus time after assembling the cerebellar slice in the zap board chamber for one stimulus and three stimuli at 20 Hz. Data are presented as mean ± SEM. n=11 slices from 2 mice (1 stimulus, black markers) and n=13 slices from 3 mice (3 stimuli, blue markers). Stars indicate a significant difference (Mann-Whitney U test, p = 0.02 for 2.5 minutes and p = 0.04 for 3.5 minutes).
Figure 2.
Figure 2.. Ultrafast endocytosis in cortical synapses of acute mouse brain slices.
(A) Low magnification overview of an acute mouse brain slice visualized with zap-and-freeze EM (from an unstimulated slice). Axons with pearled morphologies are highlighted as panels (i and ii), along with examples of synapses (iii and iv). (B) Example electron micrographs showing endocytic pits (black arrowheads) and putative large endocytic vesicles (LEV) and endosomes (black arrows) at the indicated time points in cortical regions of acute mouse brain slices. More example TEM images are provided in Figure S2. (C) Plots showing the increase in number of each endocytic structure per synaptic profile after a single stimulus. Data are pooled from three experiments and presented as mean ± SEM. CCP: clathrin-coated pits. See Data Table S1 for n values and detailed numbers for each time point. (D) Plot showing the distance distribution of putative uncoated endocytic pits from the edge of an active zone 100 ms post-stimulus in acute slices from n=3 mice. Data are presented as median ± 95% confidence interval. Each dot represents a pit.
Figure 3.
Figure 3.. Uncoated pits in acute mouse cortical slices are activity-dependent and Dynasore-sensitive.
(A) Example electron micrographs showing endocytic pits (black arrowheads) and putative large endocytic vesicles (LEV) at the indicated time points in acute brain slices from n=2 mice, given: no drugs, tetrodotoxin (TTX), or Dynasore. (B) Plot of no drug versus TTX treated slices, comparing the increase in number of uncoated pits per synaptic profile, 100 ms after a single stimulus. Data are presented as mean ± SEM. (C) Plot of no drug versus Dynasore treated slices, comparing the increase in number of uncoated pits per synaptic profile, 1 s after a single stimulus. Data are presented as mean ± SEM. See Data Table S1 for n values and detailed numbers for each time point.
Figure 4.
Figure 4.. Dyn1xA clusters next to the active zone in mouse cortical synapses.
(A) Example STED images of endogenous Dyn1xA localizations (white arrowheads) in side view synapses from cortical regions of acute mouse brain slices. Scale bar: 300 nm. Dyn1xA antibody confirmation in Figure S4. Individual traces provided in Figure S5. (B) Line scan profiles from side view synapses. The median and 95% confidence interval are shown for n=3 mice; see Data Table S1 for specific n values. Dotted line indicates center-line at x=0, representing the calculated center-line between the presynapse and postsynapse (see Figure S7 and Methods for analysis pipeline). (C) Violin plots of individual fluorescence signal peak distances from the center-line obtained from a band line scan across side view synapses. The median and 95% confidence interval are shown for n=3 mice, each dot represents a signal peak over a set threshold value >0.5. Dotted line indicates center-line at y=0. (D) Example STED images of endogenous Dyn1xA localizations (white arrowheads) in top view synapses from cortical regions of acute mouse brain slices. Scale bar: 300 nm. Dyn1xA antibody confirmation in Figure S4. More example STED images provided in Figure S6. (E) The distribution of Dyn1xA puncta relative to the active zone edge, defined by Bassoon, analyzed in top view synapse images. Shaded region indicates area inside the active zone. The median and 95% confidence interval are shown for n=3 mice; see Data Table S1 for specific n values. (F) Cumulative plot of data presented in (E).
Figure 5.
Figure 5.. Ultrafast endocytosis in cortical synapses of acute human brain slices.
(A) Low magnification overview of acute human neocortical slice visualized with zap-and-freeze EM (from a slice frozen 10 sec post-electric field stimulation). Axons with pearled morphologies are highlighted as panels (i and ii), along with an example of a synapse (iii). (B) Example electron micrographs showing uncoated endocytic pits (black arrowheads) and putative large endocytic vesicles (LEV) and endosomes (black arrows) at the indicated time points in acute brain slices from n=4 humans. Electrophysiological confirmation of human brain slice electrical viability in Figure S8. More example TEM images provided in Figure S9. (C) Plots showing the increase in number of each endocytic structure per synaptic profile after a single stimulus. Data are presented as mean ± SEM. CCP: clathrin-coated pits. See Data Table S1 for n values and detailed numbers for each time point. (D) Plot showing the distance distribution of putative uncoated endocytic pits from the edge of an active zone 100 ms post-stimulus in acute neocortical slices from n=4 humans. Data are presented as median ± 95% confidence interval. Each dot represents a pit.
Figure 6.
Figure 6.. Uncoated pits in acute human cortical slices are activity-dependent and Dynasore-sensitive.
(A) Example electron micrographs showing endocytic pits (black arrowheads) and putative large endocytic vesicles (LEV) at the indicated time points in acute brain slices from n=2 humans (case 5 and 6), given: no drugs, tetrodotoxin (TTX), or Dynasore. (B) Plot of no drug versus TTX treated slices, comparing the increase in number of uncoated pits per synaptic profile, 100 ms after a single stimulus. Data are presented as mean ± SEM. (C) Plot of no drug versus Dynasore treated slices, comparing the increase in number of uncoated pits per synaptic profile, 1 s after a single stimulus. Data are presented as mean ± SEM. See Data Table S1 for n values and detailed numbers for each time point.
Figure 7.
Figure 7.. Dyn1xA clusters in human excitatory synapses.
(A) Line scan profiles from side view synapses. The median and 95% confidence interval are shown for n=3 humans; see Data Table S1 for specific n values. Dotted line indicates center-line at x=0. (B) Violin plots of individual fluorescence signal peak distances from the center-line obtained from a band line scan across side view synapses. The median and 95% confidence interval are shown for n=3 humans, each dot represents a signal peak over a set threshold value >0.5. Dotted line indicates center-line at y=0. (C) Example STED images of endogenous Dyn1xA localizations (white arrowheads) in top view synapses from cortical regions of acute brain slices from n=3 humans. Scale bar: 300 nm. More example STED images provided in Figure S11. (D) The distribution of Dyn1xA puncta relative to the active zone edge, defined by Bassoon, analyzed in top view synapse images. Shaded region indicates area inside the active zone. See Data Table S1 for specific n values. (E) Cumulative plot of data presented in (D).

References

    1. Moradi Chameh H, Rich S, Wang L, et al. Diversity amongst human cortical pyramidal neurons revealed via their sag currents and frequency preferences. Nat Commun. 2021;12:2497. doi: 10.1038/s41467-021-22741-9 - DOI - PMC - PubMed
    1. Barzó P, Szöts I, Tóth M, Csajbók ÉA, Molnár G, Tamás G. Electrophysiology and Morphology of Human Cortical Supragranular Pyramidal Cells in a Wide Age Range. eLife. 2024;13. doi: 10.7554/eLife.100390.1 - DOI
    1. Hunt S, Leibner Y, Mertens EJ, et al. Strong and reliable synaptic communication between pyramidal neurons in adult human cerebral cortex. Cereb Cortex. 2022;33(6):2857–2878. doi: 10.1093/cercor/bhac246 - DOI
    1. Watson JF, Vargas-Barroso V, Morse-Mora RJ, et al. Human hippocampal CA3 uses specific functional connectivity rules for efficient associative memory. Cell. 2024;0(0). doi: 10.1016/j.cell.2024.11.022 - DOI
    1. Nahirney PC, Tremblay ME. Brain Ultrastructure: Putting the Pieces Together. Frontiers in Cell and Developmental Biology. 2021;9. Accessed January 1, 2024. https://www.frontiersin.org/articles/ 10.3389/fcell.2021.629503 - DOI

Publication types

LinkOut - more resources