[Preprint]. 2024 Dec 26:2024.12.26.630423.
doi: 10.1101/2024.12.26.630423.

Dynamics of postnatal bone development and epiphyseal synostosis in the caprine autopod

Affiliations

Dynamics of postnatal bone development and epiphyseal synostosis in the caprine autopod

Christopher J Panebianco et al. bioRxiv. .

Update in

Abstract

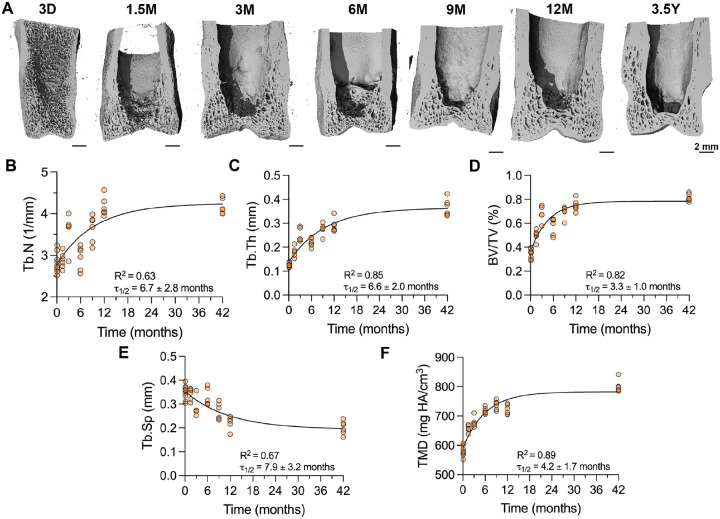
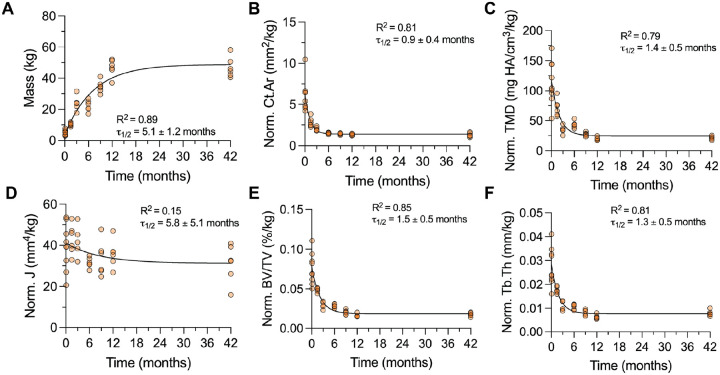
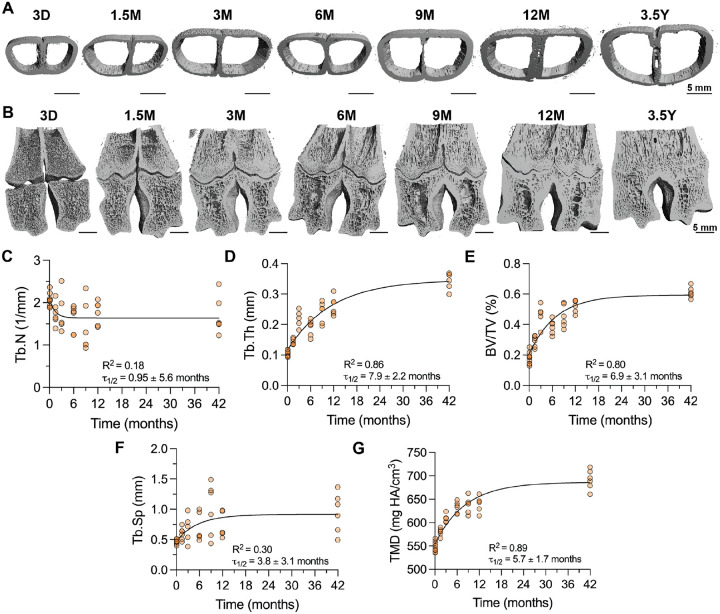
Bones develop to structurally balance strength and mobility. Bone developmental dynamics are influenced by whether an animal is ambulatory at birth (i.e., precocial). Precocial species, such as goats, develop advanced skeletal maturity in utero, making them useful models for studying the dynamics of bone formation under mechanical load. Here, we used microcomputed tomography and histology to characterize postnatal bone development in the autopod of the caprine lower forelimb. The caprine autopod features two toes, fused by metacarpal synostosis (i.e., bone fusion) prior to birth. Our analysis focused on the phalanges 1 (P1) and metacarpals of the goat autopod from birth through adulthood (3.5 years). P1 cortical bone densified rapidly after birth (half-life using one-phase exponential decay model (τ1/2 = 1.6 ± 0.4 months), but the P1 cortical thickness increased continually through adulthood (τ1/2 = 7.2 ± 2.7 mo). Upon normalization by body mass, the normalized polar moment of inertia of P1 cortical bone was constant over time, suggestive of structural load adaptation. P1 trabecular bone increased in trabecular number (τ1/2 = 6.7 ± 2.8 mo) and thickness (τ1/2 = 6.6 ± 2.0 mo) until skeletal maturity, while metacarpal trabeculae grew primarily through trabecular thickening (τ1/2 = 7.9 ± 2.2 mo). Unlike prenatal fusion of the metacarpal diaphysis, synostosis of the epiphyses occurred postnatally, prior to growth plate closure, through a unique fibrocartilaginous endochondral ossification. These findings implicate ambulatory loading in postnatal bone development of precocial goats and identify a novel postnatal synostosis event in the caprine metacarpal epiphysis.

Keywords: Bone Development; Bone Fusion; Bone Morphometry; Caprine; Microcomputed Tomography.


Figures

Figure 1.
Figure 1.. Goats are precocial animals that ambulate from birth through adulthood.
Reproduction of 1887 Animal Locomotion Plate 676, captured by Eadweard Muybridge at the University of Pennsylvania. Plates provided by the University of Pennsylvania University Archives and Records Center.
Figure 2.
Figure 2.. Phalanges 1 (P1) cortices exhibit rapid condensation and continuous expansion until adulthood.
(A) Transverse views of 3D microcomputed tomography (microCT) reconstructions of P1 cortical mid-shaft. Scale bars = 2 mm. (B) Cortical tissue cross-sectional area (Tt.Ar), (C) Cortical bone area (Ct.Ar), (D) Cortical area fraction (Ct.Ar/Tt.Ar), (E) Tissue mineral density (TMD), (F) Cortical thickness (Ct.Th), and (G) Polar moment of inertia (J) throughout developmental time, fit with a one-phase decay model. Goodness of fit (R2) and half-life (τ1/2) are reported for each graph. D = days of age, M = months of age, Y = years of age.
Figure 3.
Figure 3.. Distal P1 bones grow by formation of new trabeculae and expansion of existing trabeculae.
(A) Transverse views of 3D microCT reconstructions of P1 bones with a virtual slice through the mid-coronal plane using microCT. Scale bars = 2 mm. (B) Trabecular number (Tb.N), (C) Trabecular thickness (Tb.Th), (D) Bone volume fraction (BV/TV), (E) Trabecular spacing (Tb.Sp), and (F) Tissue mineral density (TMD) throughout developmental time, fit with a one-phase decay model. Goodness of fit (R2) and half-life (τ1/2) are reported for each graph. D = days of age, M = months of age, Y = years of age.
Figure 4.
Figure 4.. Morphodynamics of P1 cross-sectional distribution are adaptive to ambulatory loads.
(A) Animal mass throughout developmental time. Body mass normalized (B) Cortical bone area (Ct.Ar), (C) Cortical tissue mineral density (TMD), (D) Polar moment of inertia (J), (E) Trabecular bone volume fraction (BV/TV), and (F) Trabecular thickness (Tb.Th). Prefix “Norm” indicates outcome is normalized to animal mass. Data graphed as individual data points vs. time fit with a one-phase decay model. Goodness of fit (R2) and half-life (τ1/2) are reported for each graph.
Figure 5.
Figure 5.. Metacarpal cortices fuse prior to birth and distal metacarpal trabecular bone grows through trabecular thickness expansion.
(A) 3D microCT reconstructions of cortices with a virtual slice through the transverse plane, showing cortical fusion prior to birth. Scale bars = 5 mm. (B) 3D microCT reconstructions of metacarpal bones with a virtual slice through the mid-coronal plane. Scale bars = 5 mm. (C) Trabecular number (Tb.N), (D) Trabecular thickness (Tb.Th), (E) Bone volume fraction (BV/TV), (F) Trabecular spacing (Tb.Sp), and (G) Tissue mineral density (TMD) throughout developmental time, fit with a one-phase decay model. Goodness of fit (R2) and half-life (τ1/2) are reported for each graph. D = days of age, M = months of age, Y = years of age.
Figure 6.
Figure 6.. Metacarpal epiphyses are separated by a non-cartilaginous fibrous template at birth, but fuse by fibrocartilaginous endochondral ossification.
(A) 3D microCT reconstructions of metacarpal bones with a virtual slice through the mid-coronal plane. Yellow line indicates extent of epiphyseal fusion (i.e., “fusion length”). Scale. bars = 5 mm. (B) Quantification of the epiphyseal fusion length throughout developmental time. (C) Safranin o/fast green histological micrographs of metacarpal bones cut through the mid-coronal plane. Scale bars = 100 μm. (D) High-magnification micrographs of the distal metacarpus. Scale bars = 500 μm. (E) High-magnification micrographs of articular cartilage region of the metacarpus. Scale bars = 100 μm. D = days of age, M = months of age, Y = years of age.

References

    1. Acquaah F., Robson Brown K.A., Ahmed F., Jeffery N. and Abel R.L. 2015. Early trabecular development in human vertebrae: overproduction, constructive regression, and refinement. Frontiers in endocrinology 6, p. 67. - PMC - PubMed
    1. Bahney C.S., Zondervan R.L., Allison P., et al. 2019. Cellular biology of fracture healing. Journal of Orthopaedic Research 37(1), pp. 35–50. - PMC - PubMed
    1. Beall M.H., van den Wijngaard J.P.H.M., van Gemert M.J.C. and Ross M.G. 2007. Amniotic fluid water dynamics. Placenta 28(8–9), pp. 816–823. - PubMed
    1. Berendsen A.D. and Olsen B.R. 2015. Bone development. Bone 80, pp. 14–18. - PMC - PubMed
    1. Biewener A.A. 1989. Scaling body support in mammals: limb posture and muscle mechanics. Science 245(4913), pp. 45–48. - PubMed

Publication types

LinkOut - more resources