[Preprint]. 2025 Jan 11:2024.12.16.628673.
doi: 10.1101/2024.12.16.628673.

PinkyCaMP a mScarlet-based calcium sensor with exceptional brightness, photostability, and multiplexing capabilities

Affiliations

PinkyCaMP a mScarlet-based calcium sensor with exceptional brightness, photostability, and multiplexing capabilities

Ryan Fink et al. bioRxiv. .

Abstract

Genetically encoded calcium (Ca2+) indicators (GECIs) are widely used for imaging neuronal activity, yet current limitations of existing red fluorescent GECIs have constrained their applicability. The inherently dim fluorescence and low signal-to-noise ratio of red-shifted GECIs have posed significant challenges. More critically, several red-fluorescent GECIs exhibit photoswitching when exposed to blue light, thereby limiting their applicability in all-optical experimental approaches. Here, we present the development of PinkyCaMP, the first mScarlet-based Ca2+ sensor that outperforms current red fluorescent sensors in brightness, photostability, signal-to-noise ratio, and compatibility with optogenetics and neurotransmitter imaging. PinkyCaMP is well-tolerated by neurons, showing no toxicity or aggregation, both in vitro and in vivo. All imaging approaches, including single-photon excitation methods such as fiber photometry, widefield imaging, miniscope imaging, as well as two-photon imaging in awake mice, are fully compatible with PinkyCaMP.


Conflict of interest statement

Conflict of interest No conflict of interest.

Figures

Figure 1:
Figure 1:. Development and characterization of PinkyCaMP
(a) Overview of the domain structure of PinkyCaMP. The two gate post residues in cpmScarlet are shown in orange (S28) and purple (W144). (b) ΔF/F rank plot representing all crude proteins tested under the directed evolution screening conditions. ΔF/F values measured under these conditions are different from the values measured with purified proteins. (c) Modeled structure of PinkyCaMP with the positions of mutations indicated. RS20, cpmScarlet, CaM and linker residues are colored cyan, red, magenta and yellow respectively. The mutated residues are highlighted green. The model was prepared using AlphaFold3 (ref.). (d) Excitation (emission at 620 nm) and emission (excitation at 540 nm) spectra of PinkyCaMP in the presence (39 μM) and absence of Ca2+. (e) Absorbance spectra of PinkyCaMP in the presence (39 μM) and absence of Ca2+. (f) Ca2+ titration curve of PinkyCaMP, n = 3 replicates (mean ± s.d.). (g) Baseline brightness in HEK cells expressing jRCaMP1a (50 ± 5 a.u.; n = 47 total cells), jRGECO1a (294 ± 25 a.u.; n = 50 total cells), RCaMP3 (292 ± 35 a.u.; n = 89 total cells), and PinkyCaMP (701 ± 71 a.u.; n = 93 total cells), all with three replicate measurements. One-way ANOVA with Tukey’s post-hoc test, **** p ≤ 0.001, * p ≤ 0.05 (mean ± s.e.m.). (h) Photoswitching of RCaMP3 (n = 33 cells) and PinkyCaMP (n = 20 cells), was assessed in HEK cells by imaging with constant 560 nm excitation light and periodic pulses of 470 nm light at 1 mW/mm2 and 0.1 Hz. Inset is an enlarged version of each first stimulation (mean ± s.e.m.). Three replicate measurements were performed for each sensor. (i) Averaged and normalized photostability traces of PinkyCaMP (n = 72 cells), RCaMP3 (n = 56 cells), and jRGECO1a (n = 76 total cells), from three replicate measurements (mean ± s.e.m).
Figure 2:
Figure 2:. Spectral multiplexing of PinkyCaMP with CoChR.
(a) Schematic of expressed proteins and neuronal localization (top) and construct design (bottom). (b) Single neuron Ca2+-imaging (top) with a single pulse field stimulation and electrophysiological current traces (bottom) elicited with different blue light applications. (c) Emission (solid, pink) and excitation (broken, pink) spectra of Ca2+-saturated PinkyCaMP together with the action spectrum recorded from PinkyCaMP-P2A-stCoCHR. n=6 cells. Stimulation light properties (blue and orange shaded areas) are shown. (d) Schematic of cell-attached / whole-cell measurements. (e) Representative cell-attached measurement. (f), Quantification of the spike probability in cell-attached mode under illumination conditions as shown in g. n=5 cells. (g) Representative whole-cell voltage-clamp measurement. * indicate action potentials. (h) Quantification of the generated photocurrent under imaging conditions in comparison to low intensity illumination used for action spectroscopy. Statistics: p=0.0312 n=6 cells. (i) Schematic of Ca2+ imaging with different stimuli: field stimulation (black), 438 nm LED (blue), and no stimulus (gray). (j) PinkyCaMP fluorescence change traces upon different single pulse stimuli (left) and quantification (right). Statistics: p=0.028, n=59 cells. Color coding as in i. (k) PinkyCaMP fluorescence change traces upon 5 consecutive stimuli (left) and quantification (right), same samples as in j. Statistics: p<0.0001, n=59. Color coding as in i. (l) PinkyCaMP fluorescence change traces upon 5 consecutive stimuli (left) and quantification (right) under 1 μM TTX treatment. n=30. Color coding as in i. All data are shown as mean ± SEM, and all statistical comparisons were performed as Wilcoxon matched-pairs signed rank tests.
Figure 3:
Figure 3:. Comparison of PinkyCaMP and other GECIs in organotypic cultures and acute brain slices.
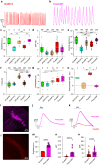
(a,b) Spontaneous, synchronous calcium transients recorded with RCaMP3.0 and PinkyCaMP in cortical slice cultures from mouse (DIV 13–21; synapsin-driven expression after AAV-mediated transduction at DIV 1). (c) Fluorescence brightness (F0), (d) relative signal change (ΔF/F0), (e) absolute signal strength (F0aver∙ΔF/F0), (f) decay time constants and (g) photostability for GCaMP6f, jRGECO1a, jRCaMP1a, RCaMP3.0 and PinkyCaMP. For other examples and parameters see Figure S5. (h) Assessment of blue-light photoswitching. For details see Figure S6. Black boxes indicate 25–75% percentiles and medians, the yellow lines means. The number of analyzed slices (c,g,h) or events (d,e,f) is given. Statistical differences are indicated with *p ≤ 0.05, **p ≤ 0.01, and ***p ≤0.001. (i) Confocal image of CA2 neurons in a 300 μm thick acute mouse brain slice expressing PinkyCaMP, scale bar 50 μm. (j) Average ΔF/F traces of 6 stimulation pulses at 5Hz stimulation for PinkyCaMP under low excitation light intensity (left; n=167 cells). (k) Average ΔF/F traces of 6 simulation pulses for PinkyCaMP and RCaMP3 at 5 Hz stimulation with high excitation light intensity (PinkyCaMP n=79 cells, RCaMP n=55 cells). (l) Confocal image of RCaMP3 in CA2 neurons, scale bar 50μm. (m) Baseline brightness of cells recorded with 10 Hz stimulation; PinkyCaMP: 106.250 ± 1.908, RCaMP3: 52.160 ± 0.171. (n) Maximal ΔF/F values for 10 Hz stimulation; PinkyCaMP: 0.0557 ± 0.0055, RCaMP3: 0.0051 ± 0.0007. (o) SNR at 10 Hz field stimulation; RCaMP3 33.711 ± 4.767, PinkyCaMP: 63.527 ± 7.880. (m-o) Values presented as mean ± s.e.m. PinkyCaMP n=60 cells, and RCaMP3 n=50 cells. Mann-Whitney U test, ****p ≤ 0.0001.
Figure 4:
Figure 4:. In vivo fiber photometry: Simultaneous imaging of neuronal activity with PinkyCaMP and serotonin with sDarken.
(a) Schematic drawing of AAV injection into the prelimbic area (PrL) of the prefrontal cortex. Lower panel experimental setup for airpuff. (b) Histology example of PinkyCaMP expression and fiber placement. Scalebar 500 μm, magnification inset scalebar 100 μm. (c) Example traces of PinkyCaMP fluorescence in freely moving mice during an aversive airpuff in their homecage (airpuff). (c) Averaged PinkyCaMP activity aligned to an aversive airpuff n=7 mice (PinkyCaMP), n=4 mice (control)(mean ± s.e.m.). (d) Single trial heatmap of PinkyCaMP (54 trials from 7mice) and control (2 0 trials from 4 mice) (e) Area under the curve (AUC) of PinkyCaMP and mCherry signal before and during the airpuff. Ordinary one-way ANOVA, PinkyCaMP: mean pre 136 ± 211; mean during: 6503 ± 579; mCherry: mean pre 124 ± 44; mean during: −47 ± 64, **** p≤0.0001. (g) Averaged sDarken activity aligned to an aversive airpuff n=7 mice (sDarken), n=4 mice (nullmutant l)(mean ± s.e.m.). (h) Single trial heatmap of sDarken (54 trials from 7mice) and nullmutant (20 trials from 4 mice) (i) Area under the curve (AUC) of sDarken and nullmutant signal before and during the airpuff. Ordinary one-way ANOVA, sDarken: mean pre 749 ± 163; mean during: −170 ±165; nullmutant: mean pre 169 ± 59; mean during: −27 ± 67, **** p≤0.0001.
Figure 5:
Figure 5:. Combining PinkyCaMP with blue-sensitive optogenetics
(a) Experimental design. Fiber photometry recording of granule cell (GC) activity with PinkyCaMP. To drive GC activity, stGtACR2-mCerulean was expressed on vGAT+ neurons. EGFP was used as control. Exemplary immunofluorescent confocal images of (b). Fiber location and PinkyCaMP expression targeting dentate gyrus (DG). (c) Magnification of the hilar and GC layer regions of DG. DAPI (left), AAV-transduced neurons (right). vGAT expressing stGtACR2 (top) and EGFP (bottom). (d) PinkyCaMP fiber photometry during open field (OF) exploration. PinkyCaMP transients were measured using a 560 nm LED excitation light and a quasi isoemissive wavelength (405 nm) was used to control for motion artifacts. To test for positive photoswitching of PinkyCaMP while simultaneously driving GC activity, 488 nm light was switched ON/OFF while mice explored the OF (10X, 10 s ON / 10 s OFF). (e) Average PinkyCaMP traces (Z-score) during OF exploration in stGtACR2 group (n = 3 mice, top) vs. EGFP group (n= 3 mice, bottom). Blue shading indicates the periods when 488 nm light was on. (f) Heatmaps of PinkyCaMP signals (Z-score) during 488 nm light optogenetic-driven disinhibition. Blue squares represent the 488 light ON epochs. Each row represents an individual mouse. stGtACR2 group (top), EGFP group (bottom). g. Area under the curve (AUC) of PinkyCaMP Z-score during 488 nm light ON vs. OFF epochs. 488 nm light significantly increases PinkyCaMP fluorescence do to GC disinhibition (stGtACR2 group) and not due to positive photoswitching (EGFP group) (Šídák multiple comparison test, Z Score (AUC) during ON vs. OFF epochs stGtACR2 group: p = 7.23×10⁻¹⁵; EGFP group, p = 0.9993). 8h) Exemplary immunofluorescent confocal images comparing cFOS expression in GCs after OF exploration and optogenetic GC disinhibition between ipsilateral and contralateral to 488 nm light irradiation. i. Quantification of cFOS+ GC and shown as a ratio between the 488 nm irradiated (ipsilateral) vs contralateral side. 488 nm light increased cFOS expression in the stGtACR2 group while no increase was seen in the EGFP group (Unpaired, two-tailed t test, p = 0.0002).
Figure 6:
Figure 6:. In vivo two-photon PinkyCaMP imaging
(a) Schematic of the experimental timeline for in vivo two-photon imaging. Stereotactic injection of rAAV2/9-CaMKII-PinkyCaMP into dorsal CA1 of the hippocampus at week 0, followed by window surgery during week 1. After 6 weeks of viral expression, awake head-fixed resting Ca2+-imaging was performed with a sampling rate of 10Hz at an excitation wavelength of 1040 nm. (b) Upper panel: Example of an imaging field of view (FOV) in hippocampal CA1, average intensity projected, scale bar 50 μm. Lower panel: Same FOV showing CaImAn identified cell footprints and the respective space correlation image. (c) Ca2+ transients of the cells detected in b (n=102 cells from one mouse). (d) Selected magnified Ca2+-traces of 5 cells from c. (e) Histogram showing the distribution of Ca2+ transients and their respective amplitude in % ΔF/F (mean = 41 ± 0.6%; n=2009 of 252 cells in 3 mice). (f) Number of cells over Ca2+-transient frequency (mean = 3.2 ± 0.2 min-1). (g) Average transient of 129 manually selected unitary Ca2+-events ordered by onset time (AvgAmp = 103 ± 3% ΔF/F). (h) Rise time histogram of cells in g (AvgRisetime = 260 ± 10 ms). Data are presented as mean ± SEM.

References

    1. Tian L., Hires S. A. & Looger L. L. Imaging neuronal activity with genetically encoded calcium indicators. Cold Spring Harb. Protoc. 2012, 647–656 (2012). - PubMed
    1. Baird G. S., Zacharias D. A. & Tsien R. Y. Circular permutation and receptor insertion within green fluorescent proteins. Proc. Natl. Acad. Sci. U. S. A. 96, 11241–11246 (1999). - PMC - PubMed
    1. Nagai T., Sawano A., Park E. S. & Miyawaki A. Circularly permuted green fluorescent proteins engineered to sense Ca2+. Proc. Natl. Acad. Sci. U. S. A. 98, 3197–3202 (2001). - PMC - PubMed
    1. Nakai J., Ohkura M. & Imoto K. A high signal-to-noise Ca(2+) probe composed of a single green fluorescent protein. Nat. Biotechnol. 19, 137–141 (2001). - PubMed
    1. Tian L. et al. Imaging neural activity in worms, flies and mice with improved GCaMP calcium indicators. Nat. Methods 6, 875–881 (2009). - PMC - PubMed

Publication types