[Preprint]. 2024 Dec 17:2024.12.17.628952.
doi: 10.1101/2024.12.17.628952.

Asymmetric Activation of Retinal ON and OFF Pathways by AOSLO Raster-Scanned Visual Stimuli

Affiliations

Asymmetric Activation of Retinal ON and OFF Pathways by AOSLO Raster-Scanned Visual Stimuli

Sara S Patterson et al. bioRxiv. .

Update in

Abstract

Adaptive optics scanning light ophthalmoscopy (AOSLO) enables high-resolution retinal imaging, eye tracking, and stimulus delivery in the living eye. AOSLO-mediated visual stimuli are created by temporally modulating the excitation light as it scans across the retina. As a result, each location within the field of view receives a brief flash of light during each scanner cycle (every 33-40 ms). Here we used in vivo calcium imaging with AOSLO to investigate the impact of this intermittent stimulation on the retinal ON and OFF pathways. Raster-scanned backgrounds exaggerated existing ON-OFF pathway asymmetries leading to high baseline activity in ON cells and increased response rectification in OFF cells.


Figures

Figure 1.
Figure 1.
(A) System diagram of the AOSLO (blue) and the Maxwellian view (red). The AOSLO contains three key pupil conjugates at the deformable mirror (DM), the resonant scanner (HS) and the galvanometric scanner (VS). Additional components include spherical mirrors (S1-S8), flat mirrors (M); long-pass filters (LP), band-pass filters (BP), Shack-Hartmann wavefront sensor (SHWS) and photomultiplier tubes (PMT). (B) Diagram illustrating the spatial arrangement of each visible light source. Reflectance imaging of the cone mosaic at 796 nm was performed at across the full 3.69 × 2.70° field of view while a 488 nm laser was focused on the ganglion cell layer and restricted to either the left or right side of the field of view. Visual stimuli were presented to the foveal cones on the opposite side, either through the AOSLO with a 561 nm laser or independent from the AOSLO with the 3-LED Maxwellian view stimulator. All experiments were performed in the fovea where RGCs are displaced laterally from their cone inputs.
Figure 2.
Figure 2.
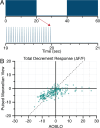
(A-B) Representative responses to 20-second contrast increments (green) and decrements (red) for 4 ON cells (A) and 4 OFF cells (B). The gray vertical dashed lines indicate the start of the contrast increment/decrement and the black horizontal lines mark the baseline (0% ΔF/F) for each cell. All vertical scale bars are 50% ΔF/F and all horizontal scale bars are 20 seconds. (C) Comparison of the total stimulus responses to the contrast increment and decrement for 187 cells. The gray dashed line indicates equal and opposite increment and decrement responses. (D) Kernel density estimates summarizing the distribution of total stimulus responses to the contrast increment, decrement, and a control stimulus (0% contrast). The vertical dashed lines indicate the response significance cutoff which was set at 2 SDs from the mean total response for the control stimulus.
Figure 3.
Figure 3.
(A) Representative contrast response functions (CRFs) obtained with ex vivo electrophysiology from ON (green) and OFF (red) parasol RGCs (Turner and Rieke, 2016). (B) Average CRFs for ON and OFF measured at 0%, 10%, 25%, 50%, 75% and 100% contrast. The mean and shaded standard deviation were calculated from the total response during each 20 second contrast step for 16 OFF cells and 50 ON cells. Each cell’s CRF was individually normalized before averaging. (C) Mean and standard deviation of the absolute total stimulus responses for 100% contrast increments and decrements for 16 OFF and 50 ON cells.
Figure 4.
Figure 4.
(A) Stimulus intensity of 100% contrast increments and decrements at three mean light levels. (B) Representative ON cell traces (left) and total stimulus responses (right) to increments and decrements at the three light levels. Colors are the same as used in A. (C) The mean and standard deviation of 56 ON and 20 OFF cells’ total stimulus responses to the increment and decrement at each mean light level.
Figure 5.
Figure 5.
Responses to the decrement-increment stimulus presented through the AOSLO and the Maxwellian view (MV). (A) Representative responses from four ON cells to the contrast modulation presented through the AOSLO (blue) and the MV (red). The gray dashed lines mark the onset and offset of the decrement and increment. (B) As in A, but showing representative responses from four OFF cells. (C) Population-level responses from ON cells to the AOSLO and MV decrement-increment stimulus. The average and standard deviation of the 72 individually normalized traces are shown. (D) Kernel density estimates of the total response distribution during the AOSLO and MV contrast decrements (n = 214 cells). (E) Comparison of the trough-to-peak amplitudes of responses elicited by the AOSLO vs. Maxwellian view decrement-increment stimulus for the same 214 cells.
Figure 6.
Figure 6.
(A) Stimulus intensity for the pulsed Maxwellian view decrement stimulus in which the LEDs were on for just 2 ms every 40 ms (25 Hz with a 2% duty cycle). The stimulus in the bottom panel followed 2 minutes of adaptation to the pulsed “background” shown in the first 20 seconds. (B) Total stimulus responses for 198 cells to the AOSLO decrement stimulus and the “pulsed” Maxwellian view stimulus designed to imitate the temporal pattern of excitation created by raster-scanning (see text). The dark gray dashed line indicates where cells would be located if the two stimuli elicited identical responses.
Figure 7.
Figure 7.
(A) Fancharts showing the population-level response of 298 cells to step stimuli presented by the LEDs (red) and the AOSLO (blue). The black lines show the median response and the shaded regions show the 5–95th percentiles in increments of 5. Dashed lines indicate the time of step onset. (B) The peak response and final:peak response ratio for 298 cells. Each cell is plotted twice, once in red showing the response to the Maxwellian step stimulus and again in blue showing the response to the AOSLO step stimulus. (C-D) Representative responses from four ON cells (C) and four OFF cells (D). To provide intuition for the interpretation of the final:peak responses in B, the final:peak values are included for each representative trace. As in the previous figures, red traces and text are used for the Maxwellian view step stimulus responses, blue traces and text are used for the AOSLO step stimulus, and gray vertical dashed lines indicate the time of step onset. All horizontal scale bars are 20 seconds and all vertical scale bars are 50% ΔF/F. (E) Direct comparison of the peak responses to AOSLO and Maxwellian view step stimuli for 298 cells. (F) Fan charts showing the population-level responses of 169 ON cells and 129 OFF cells to the AOSLO step stimulus. The black lines show the median response and the shaded regions show the 5–95th percentiles in increments of 5. Dashed lines indicate the time of step onset.
Figure 8.
Figure 8.
(A) Representative responses from four ON cells to 10-second intensity increments presented through the AOSLO (blue) and with the Maxwellian view (red). The vertical dashed lines mark the onset and offset of the intensity increment. All horizontal scale bars are 20 seconds and all vertical scale bars are 100% ΔF/F. (B) As in A, but showing representative responses from 4 OFF cells. (C) Comparison of the trough-to-peak response amplitudes for responses to the AOSLO and Maxwellian view intensity increments for 882 cells. (D) Kernel density estimate of the distribution of amplitude difference indices (ADIs; see text).
Figure 9.
Figure 9.
(A) Empirical cumulative histograms of the correlation coefficients between normalized responses to AOSLO and Maxwellian view stimulus delivery for three different stimuli: intensity increments (red; Figure 8), the decrement-increment stimulus (blue; Figure 5) and a control stimulus at a photopic background light level. The full stimulus time course was used, beginning at stimulus onset. (B) The median correlation coefficient for AOSLO and Maxwellian view intensity increments calculated over various time periods, from 1–10 seconds after stimulus onset. (C) The correlation coefficients obtained at each time period for 882 cells, sorted from bottom to top in descending order.
Figure 10.
Figure 10.
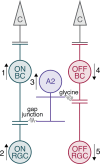
Retinal mechanisms underlying ON-OFF asymmetry in maintained discharge under photopic light levels provide a working model for the impact of raster-scanned background light. At rest, ON cells have some baseline discharge (e.g., 12 spikes/sec; (Percival et al., 2022)) while OFF RGCs fall near 0 spikes/sec. This asymmetry arises because the ON bipolar cells are slightly depolarized (1) at rest and releasing glutamate to the ON RGCs (2). The depolarization of ON bipolar cells spreads through gap junctions to the AII amacrine cells. When depolarized, the AII amacrine cells increase glycine release onto the OFF bipolar cells (3). Glycine, an inhibitory neurotransmitter, hyperpolarizes the OFF bipolar cells, reducing their glutamate release onto OFF RGCs (4–5) at the same time that the depolarized ON bipolar cell increases glutamate release onto ON RGCs (1–2). Any stimulus that further drives the ON pathway – such the brief pulses of light created by raster-scanned background lights – will further depolarize the ON bipolar cells and ON RGCs (1–2) and increase the ON→OFF pathway inhibition (3) through this circuit, resulting in greater rectification of the OFF pathway neurons (4–5).

Similar articles

References

    1. Angueyra J. M., Baudin J., Schwartz G. W., and Rieke F. (2022). Predicting and Manipulating Cone Responses to Naturalistic Inputs. Journal of Neuroscience, 42(7):1254–1274. doi: 10.1523/JNEUROSCI.0793-21.2021. - DOI - PMC - PubMed
    1. Arathorn D. W., Yang Q., Vogel C. R., Zhang Y., Tiruveedhula P., and Roorda A. (2007). Retinally stabilized cone-targeted stimulus delivery. Optics Express, 15(21):13731–13744. doi: 10.1364/oe.15.013731. - DOI - PubMed
    1. Bach M., Meigen T., and Strasburger H. (1997). Raster-scan cathode-ray tubes for vision research - limits of resolution in space, time and intensity. Spatial Vision, 10(4):403–414. - PubMed
    1. Baden T., Berens P., Franke K., Román Rosón M., Bethge M., and Euler T. (2016). The functional diversity of retinal ganglion cells in the mouse. Nature, 529(7586):345–350. doi: 10.1038/nature16468. - DOI - PMC - PubMed
    1. Barlow H. B. and Levick W. R. (1969). Changes in the maintained discharge with adaptation level in the cat retina. Journal of Physiology, 202:699–718. - PMC - PubMed

Publication types