[Preprint]. 2024 Dec 17:2024.12.12.628015.
doi: 10.1101/2024.12.12.628015.

FAF2 is a bifunctional regulator of peroxisomal homeostasis and saturated lipid responses

Affiliations

FAF2 is a bifunctional regulator of peroxisomal homeostasis and saturated lipid responses

Choah Kim et al. bioRxiv. .

Update in

Abstract

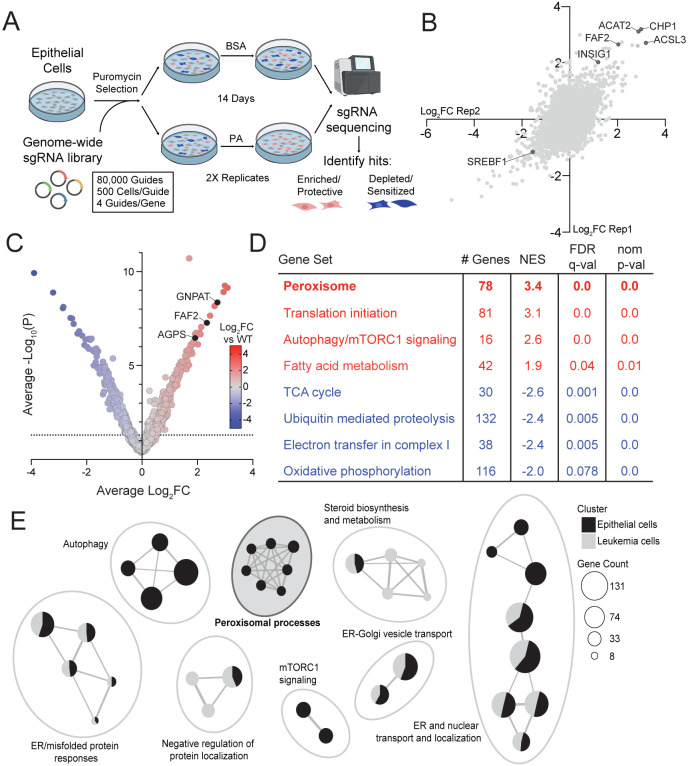
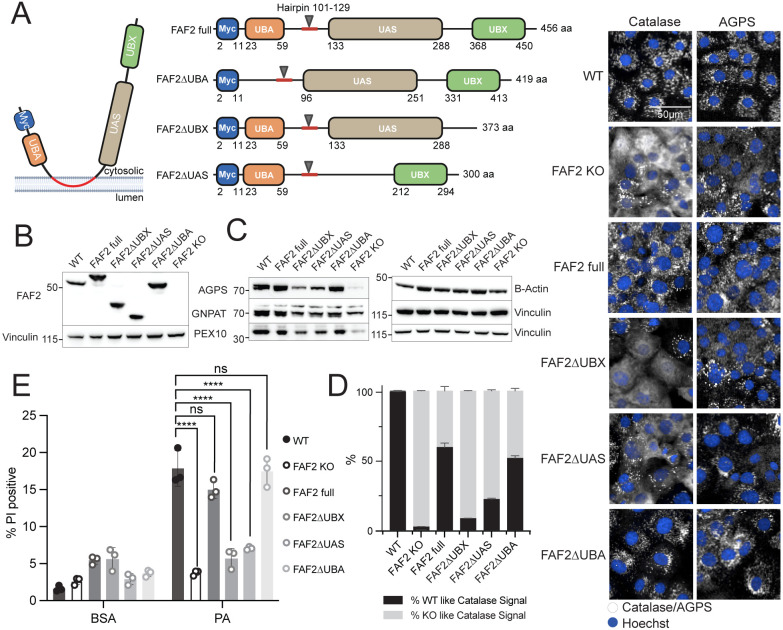
Exposure to saturated fatty acids (SFAs), such as palmitic acid, can lead to cellular metabolic dysfunction known as lipotoxicity. Although canonical adaptive metabolic processes like lipid storage or desaturation are known cellular responses to saturated fat exposure, the link between SFA metabolism and organellar biology remains an area of active inquiry. We performed a genome-wide CRISPR knockout screen in human epithelial cells to identify modulators of SFA toxicity. The screen revealed peroxisomal proteins, especially those that impact ether lipid synthesis, as important regulators of lipotoxicity. We identified Fas-associated factor family member 2 (FAF2) as a critical bifunctional co-regulator of peroxisomal and fatty acid biology. We further uncovered a new biological function for the ubiquitin-regulatory X (UBX) and UAS thioredoxin-like domains of FAF2, demonstrating their requirement for peroxisomal protein abundance and SFA-induced cellular stress. Our work highlights the role of FAF2 in regulating peroxisomal abundance and function, and the peroxisome as a key organelle in the cellular response to SFAs.


Figures

Figure 1:
Figure 1:. Genome-wide screen reveals peroxisomal pathways as mediators of lipotoxicity.
(A) Experimental design of the genome-wide CRISPR/Cas9 knockout viability screen. Cells were treated with BSA or 500 μM PA for 14 days to identify genetic knockouts that sensitize or protect cells from PA-induced toxicity (P<0.05). (B) Correlation plot showing reproducibility of screen hits among replicates 1 and 2 of the CRISPR knockout viability screen treated with BSA or 500 μM PA. (C) Volcano plot of screen hits in epithelial cells. All genes were plotted for their Log2-fold change (Log2FC) enrichment in PA versus BSA conditions and significance level (−Log10(P)). (D) Gene set enrichment analysis (GSEA) of PA screen hits showing select KEGG pathways that are most significantly enriched or depleted in epithelial cells. FDR<25%. (E) Enrichment analysis of GO terms comparing significant hits from PA screens in epithelial cells or K562 leukemia cells identifies unique lipotoxicity modulators between cell types. The clustered network plot was generated using clusterProfiler with p-adjusted value cutoff adjP<0.25. Correction for multiple testing was performed using the Benjamini-Hochberg method. The gene count of a node is the number of genes within each GO term.
Figure 2:
Figure 2:. FAF2 is a putative bifunctional regulator of peroxisomes and cellular responses to lipotoxicity.
(A) GSEA analysis of gene knockouts that enrich or deplete in PA conditions shows high enrichment of peroxisomal processes. GSEA normalized enrichment scores (NES) are displayed for differentially enriched sets of guides; gene sets include KEGG, GOBP, and REACTOME pathway entries. The size of the data points corresponds to the NES. (B) Top-ranking enriched guides that contributed to the KEGG peroxisomal gene set are significantly KO-protective in epithelial cells (black) but not K562 leukemia cells (gray). (C) Peroxisomal genes are organized by their functional process with red indicating genes that are KO protective and blue indicating genes that are KO sensitizing. Genes with a black outline indicate P<0.05 in the PA screen. (D) FAF2 and ether lipid synthesis enzymes lie at the intersection of lipid and peroxisomal biology. Genes are plotted by coessentiality scores with peroxisomal biogenesis factors (x-axis) and enrichment in the PA screen (y-axis). Correlation with peroxisomal biogenesis factors was calculated as a peroxisomal score, the average Pearson correlation score of each gene vs PEX genes (DepMAP CRISPR, Chronos). (E) The Log2 enrichment (y-axis) of all genes that were significantly enriched in the PA screen plotted against enrichment in cellular peroxisomal IP fractions (x-axis). Multiple unpaired t-tests with two-stage step up (Benjamini correction FDR=1%) was calculated for peroxisomal enriched samples compared to control IP. Ether lipid synthesis genes and FAF2 are enriched in both datasets. (F) Loss of peroxisomal ether lipid synthesis enzymes or FAF2 protects cells from PA-induced toxicity over a five day growth period. Cells were treated with BSA or 125 uM PA for five days and measured for cell death using propidium iodide (PI) dye. ****p<0.0001. Ordinary two-way ANOVA with Tukey’s multiple comparisons test, with a single pooled variance.
Figure 3:
Figure 3:. FAF2 KO leads to changes in the abundance of peroxisomal proteins and proteins that regulate lipids.
(A) Volcano plots of Log2 fold change (x-axis) plotted against −Log10(adjP) significance (y-axis) of normalized proteins in FAF2 KO, AGPS KO, and GNPAT KO cells compared to wildtype cells. (B) Hierarchical clustering of proteomics revealed 3 distinct clusters of proteins commonly changed between all KO cell lines. Log2 fold change (Log2FC) was calculated for normalized protein intensity values of knockout samples versus the average of wildtype cells, with proteins increased in KO samples (in red) or decreased (in blue). (C) 84 proteins with significantly altered abundance in all three KO cell lines were identified. (D) DAVID GO functional clustering highlights overrepresented processes that are commonly enriched or depleted across all three KO cell lines. We conducted functional enrichment of biological processes of proteins belonging to the clusters identified in Fig 3B. Adjusted Benjamini values (−Log10(adjP)) are reported for discovered processes. (E) Immunofluorescence imaging of peroxisomal proteins, AGPS, ABCD3, and catalase (CAT) in wildtype (WT) and FAF2 KO cells. ***p<0.001. Ordinary two-way ANOVA with Šídák’s multiple comparisons test. Scale bar = 50 μm. (F) The mean difference between experimental groups and wild-type was calculated to determine proteins that are changed in the KO cell lines. Genetic disruption resulted in decreased abundance of the proteins encoded by the corresponding targeted genes (FAF2, GNPAT, AGPS) as well as some commonly altered proteins (FAR1, S14L1, and ABCD3). (G) Commonly altered protein levels in KO cell lines. Significantly increased proteins are shown in red while significantly decreased proteins are shown in blue (size indicates −Log10(adjP)).
Figure 4:
Figure 4:. Disruption of peroxisomes leads to ether lipid depletion and protects cells from saturated fatty acid exposure.
(A) Schematic representing essential genes in the ether lipid synthesis pathway. (B) Volcano plots showing Log2 fold change of normalized lipid intensities in peroxisomal knockout cells show a decrease in plasmenyl lipid species compared to wildtype cells treated with PA. Dotted line shows cutoff for lipid fold changes that are significant at p<0.05. (PC=phosphatidylcholine; PS=phosphatidylserine; PA=phosphatidic acid; LPC=lysophosphatidylcholine; LPE=lysophosphatidylethanolamine; PE=phosphatidylethanolamine; TG=triacylglycerol; DG=diacylglycerol; Plasmenyl-PC=plasmenyl-phosphatidylcholine; Plasmenyl-PE=plasmenyl-phosphatidylethanolamine). (C) Plasmenyl-PEs and PCs are globally downregulated in PA-treated FAF2 and peroxisomal knockout cells compared to wildtype cells. (D) Heatmap of various lipid species’ Log2 fold changes (Log2FC) across genotypes showing a decrease in ether lipid species in peroxisomal knockout cells, which is reversible with ether lipid treatment, but not ester lipid. Cells were treated with PA+DMSO, PA+ether lipid (EL) intermediate (1-O-hexadecyl-sn-glycerol), or PA+ester lipid (ES) (dl-a-palmitin) as a control.
Figure 5:
Figure 5:. FAF2 mediates saturated fatty acid toxicity and peroxisomal abundance via itsUBX and UAS domains.
(A) Schematic of the FAF2/UBXD8 hairpin-anchored protein and FAF2 domain deletion constructs. (B) Western blot of FAF2 in WT or FAF2 KO cells transduced with full or domain-deleted (ΔUBX, ΔUAS, or ΔUBA domain) myc-tagged FAF2 constructs. (C) Western blots of peroxisomal proteins AGPS, GNPAT, and PEX10 in WT, KO, and KO-cells with re-expressed full or domain-deleted FAF2 constructs (ΔUBX, ΔUAS, or ΔUBA domain) show that UBX and UAS domains are necessary to restore peroxisomal protein abundance. (D) (Left) CAT localization was quantified by training the dataset with Harmony high-content imaging software on WT and FAF2 KO phenotypes. Cells in each sample were then assigned to either a WT or FAF2 KO phenotype and percentage of results are displayed. N=3 biological replicates per genotype, quantification is of one representative experiment. (Right) Immunofluorescence images (60X) show that CAT punctae and AGPS protein abundance are dependent on the FAF2 UBX and UAS domains. Scale bar = 50 μm. (E) PA-induced toxicity is dependent on the UBX and UAS domains of FAF2. Cell death was quantified by percentage of propidium iodide (PI) positive cells. ****p<0.0001. Ordinary two-way ANOVA with Tukey’s multiple comparisons test.

References

    1. Weinberg J. M., Lipotoxicity. Kidney Int. 70, 1560–1566 (2006). - PubMed
    1. Han J., Kaufman R. J., The role of ER stress in lipid metabolism and lipotoxicity. J Lipid Res 57, 1329–1338 (2016). - PMC - PubMed
    1. Li Z., Lange M., Dixon S. J., Olzmann J. A., Lipid Quality Control and Ferroptosis: From Concept to Mechanism. Annu Rev Biochem 93, 499–528 (2024). - PMC - PubMed
    1. Piccolis M., Bond L. M., Kampmann M., Pulimeno P., Chitraju C., Jayson C. B. K., Vaites L. P., Boland S., Lai Z. W., Gabriel K. R., Elliott S. D., Paulo J. A., Harper J. W., Weissman J. S., Walther T. C., Farese R. V. Jr, Probing the global cellular responses to lipotoxicity caused by saturated fatty acids. Mol. Cell 74, 32–44.e8 (2019). - PMC - PubMed
    1. Zhu X. G., Nicholson Puthenveedu S., Shen Y., La K., Ozlu C., Wang T., Klompstra D., Gultekin Y., Chi J., Fidelin J., Peng T., Molina H., Hang H. C., Min W., Birsoy K., CHP1 Regulates Compartmentalized Glycerolipid Synthesis by Activating GPAT4. Mol Cell 74, 45–58.e7 (2019). - PMC - PubMed

Publication types