[Preprint]. 2024 Dec 16:2024.12.16.628616.
doi: 10.1101/2024.12.16.628616.

Tax1bp1 enhances bacterial virulence and promotes inflammatory responses during Mycobacterium tuberculosis infection of alveolar macrophages

Affiliations

Tax1bp1 enhances bacterial virulence and promotes inflammatory responses during Mycobacterium tuberculosis infection of alveolar macrophages

Jeffrey Chin et al. bioRxiv. .

Abstract

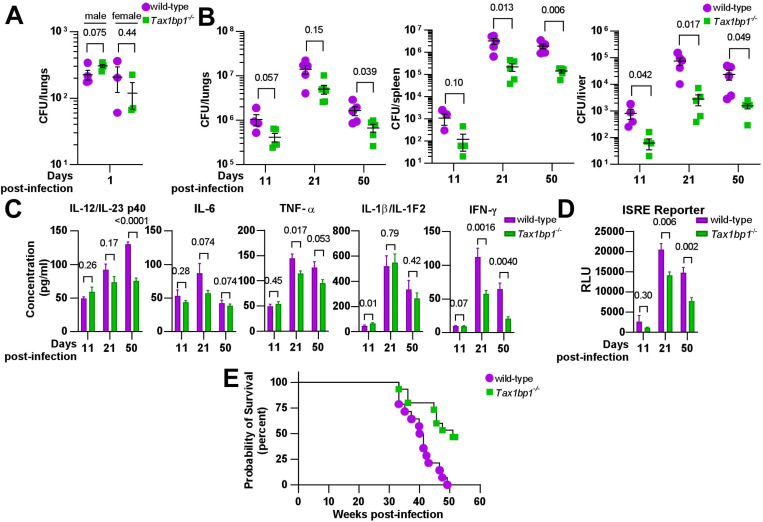
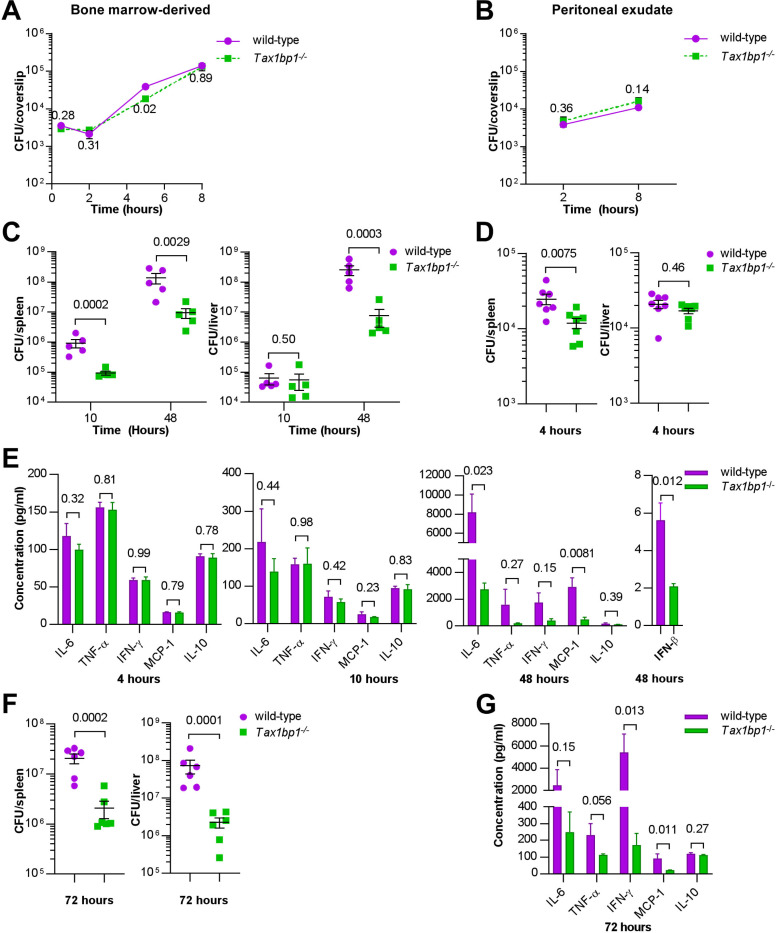
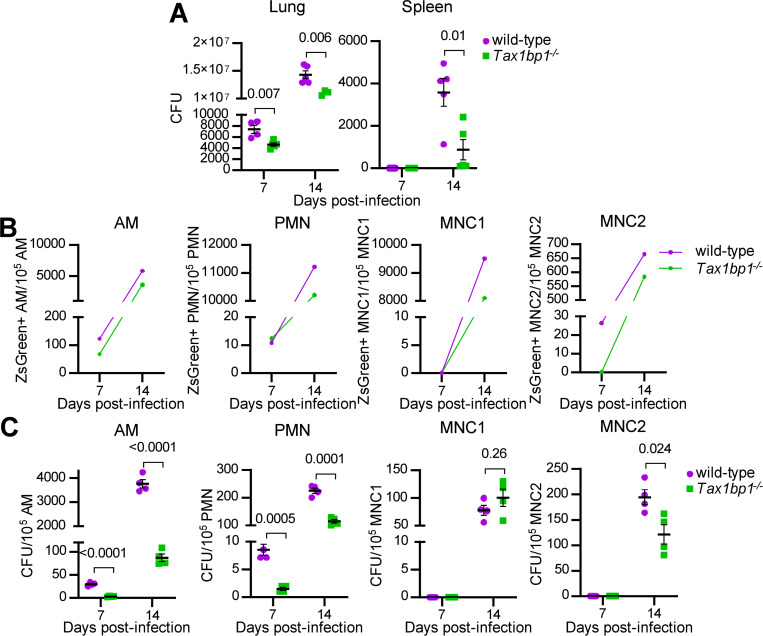
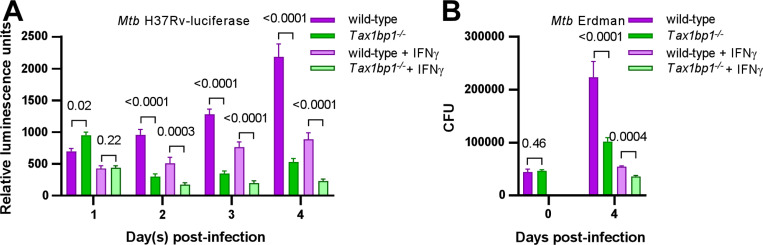
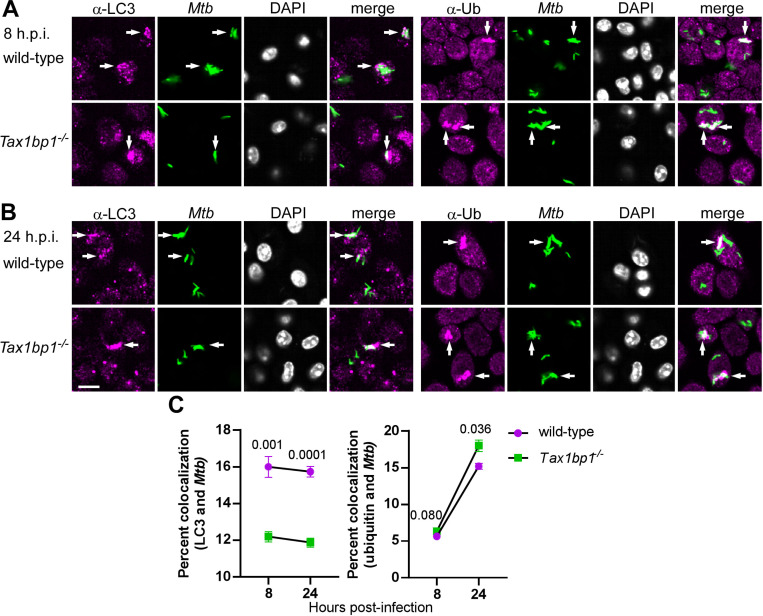
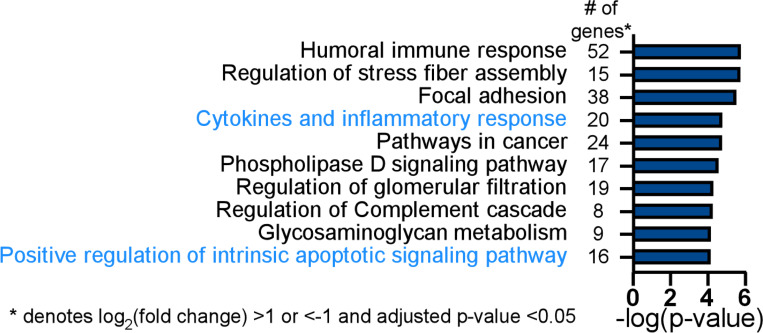
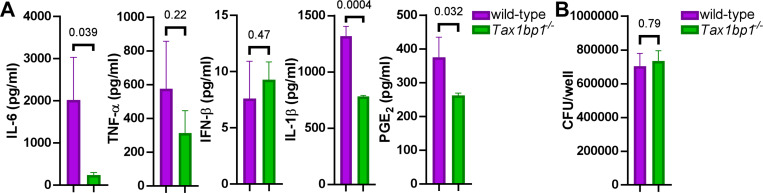
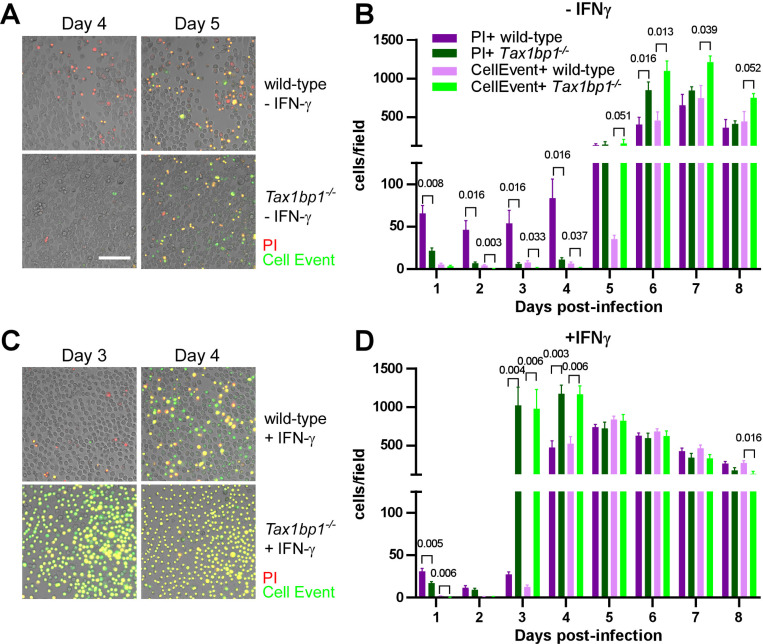
Crosstalk between autophagy, host cell death, and inflammatory host responses to bacterial pathogens enables effective innate immune responses that limit bacterial growth while minimizing coincidental host damage. Mycobacterium tuberculosis (Mtb) thwarts innate immune defense mechanisms in alveolar macrophages (AMs) during the initial stages of infection and in recruited bone marrow-derived cells during later stages of infection. However, how protective inflammatory responses are achieved during Mtb infection and the variation of the response in different macrophage subtypes remain obscure. Here, we show that the autophagy receptor Tax1bp1 plays a critical role in enhancing inflammatory cytokine production and increasing the susceptibility of mice to Mtb infection. Surprisingly, although Tax1bp1 restricts Mtb growth during infection of bone marrow-derived macrophages (BMDMs) (Budzik et al. 2020) and terminates cytokine production in response to cytokine stimulation or viral infection, Tax1bp1 instead promotes Mtb growth in AMs, neutrophils, and a subset of recruited monocyte-derived cells from the bone marrow. Tax1bp1 also leads to increases in bacterial growth and inflammatory responses during infection of mice with Listeria monocytogenes, an intracellular pathogen that is not effectively targeted to canonical autophagy. In Mtb-infected AMs but not BMDMs, Tax1bp1 enhances necrotic-like cell death early after infection, reprogramming the mode of host cell death to favor Mtb replication in AMs. Tax1bp1's impact on host cell death is a mechanism that explains Tax1bp1's cell type-specific role in the control of Mtb growth. Similar to Tax1bp1-deficiency in AMs, the expression of phosphosite-deficient Tax1bp1 restricts Mtb growth. Together, these results show that Tax1bp1 plays a crucial role in linking the regulation of autophagy, cell death, and pro-inflammatory host responses and enhancing susceptibility to bacterial infection.


Figures

Figure 1.
Figure 1.. Tax1bp1 enhances M. tuberculosis virulence and inflammatory cytokine responses during mouse aerosol infection.
(A) Male and female mice were infected by the aerosol route with a mean Mtb CFU of 240 as determined by CFU enumeration from lung homogenates at 1-day post-infection. (B) Additional mice were euthanized at 11-, 21-, and 50 days post-infection for CFU enumeration. Results are the mean ± SEM from lung homogenates of 5 infected mice. (C) Cytokine levels from infected lung homogenates at 11-, 21-, and 50-days post-infection were measured by ELISA. Results are the mean ± SEM from five samples. (D) Levels of type I and II interferon-induced JAK/STAT signaling were measured by luminescence in relative light units (RLUs) from infected lung homogenates by the ISRE assay. Results are the mean ± SEM from five samples. Brackets indicate p-values from t-test comparisons. (E) Infected mice were monitored for death or 15% loss of maximum body weight, at which point they were euthanized. Log-rank (Mantel-Cox) test and Gehan-Breslow-Wilcoxon comparison test p-values for survival were 0.0008 and 0.0047, respectively.
Figure 2.
Figure 2.. Tax1bp1 contributes to Listeria monocytogenes virulence and growth during murine but not ex vivo cellular infections.
(A and B) BMDMs or peritoneal exudate cells were infected with L. monocytogenes, and CFU were counted at 30 minutes, 2-, 5-, or 8 hours post-infection. Results are the mean ± SEM from three technical replicate samples. The p-values from t-test comparisons are shown. (C and D) CFU from spleen and liver homogenates from mice intravenously infected with L. monocytogenes were enumerated at 4-, 10-, or 48-hours post-infection. Results are the mean ± SEM from five mice. Brackets indicate p-values from t-test comparisons. (E & G) Cytokine levels were measured from the serum of mice infected with L. monocytogenes at 4-, 10-, and 48-hours post-infection by cytometric bead array (IL-6, TNF-α, IFN-γ, MCP-1, IL-10) or ELISA (IFN-β). Results are mean ± SEM from five samples. Brackets indicate p-values from t-test comparisons. (F) Spleen and liver homogenates from mice intraperitoneally infected with L. monocytogenes were enumerated for CFU 72 hours post-infection. Results are the mean ± SEM from five mice. Brackets indicate p-values from t-test comparisons. CFU data were logarithmically transformed prior to statistical analysis.
Figure 3.
Figure 3.. Tax1bp1 promotes Mtb growth in AMs, PMNs, and MNC2 following low-dose aerosol infection.
Mice were infected with aerosolized Mtb expressing ZsGreen (calculated dose of 100 CFU per mouse), and five wild-type and 5 Tax1bp1−/− mice were euthanized at 7- and 14-days post-infection. (A) Lung and spleen homogenates from 5 wild-type and 5 Tax1bp1−/− mice at each time point were plated for CFU. (B) Lung cells were pooled and stained for AMs, neutrophils (PMNs), and recruited monocyte 1 and 2 subsets (MNC1, 2). ZsGreen-positive innate immune cell subsets were quantified by analytical flow cytometry. (C) Innate immune cells were sorted. The sorted cells were plated for Mtb CFU in quadruplicate. Data were normalized to the number of cells sorted. SEM and p-values from the t-test are displayed.
Figure 4.
Figure 4.. Tax1bp1 enhances Mtb growth in AMs infected ex vivo.
AMs were infected ex vivo with luciferase-expressing Mtb H37Rv (A) or wild-type Mtb Erdman (B) at a M.O.I. of 1 in the presence or absence of IFN-γ added at the time of infection. (A) Monolayer luminescence was measured daily. (B) CFU were measured immediately after infection (day 0) or 4 days post-infection. Displayed are the mean, SEM, and FDR-adjusted p-values from the t-test.
Figure 5.
Figure 5.. Tax1bp1 targets Mtb to autophagy in AMs.
AMs were infected ex vivo with ZsGreen-expressing Mtb Erdman at a M.O.I of 2. At 8- and 24-hours post-infection, monolayers were fixed and stained with primary antibodies for autophagy markers, secondary Alexa-Fluor 647 antibodies, and DAPI. Immunofluorescence microscopy was performed at 63X magnification in 69 x/y positions and 4 z planes each in quadruplicate wells. Immunofluorescence microscopy images at 8- (A) and 24- (B) hours post-infection are displayed. Arrows denote Mtb that colocalized with LC3 or ubiquitin. The white bar denotes 10 μm. (C) Quantification of Mtb and autophagy marker colocalization is displayed. Mean percent colocalization in each well, SEM, and p-values from the t-test are depicted.
Figure 6.
Figure 6.. Tax1bp1 contributes to differential expression of inflammatory response and apoptotic signaling pathway genes during Mtb infection of AMs.
Wild-type and Tax1bp1−/− AMs were infected in biological triplicate with Mtb at a M.O.I. of 2. The RNA was harvested at 36-hours post-infection for differential pathogen and host gene expression analysis by RNAseq. Gene ontogeny enrichment analysis of statistically significant differentially expressed host genes (log2(fold change) >1 or <−1, adj. p-values <0.05) during Mtb infection of wild-type and Tax1bp1−/− AMs was performed with Metascape (93). The top ten enriched pathways and the number of genes in each functional pathway are displayed.
Figure 7.
Figure 7.. Tax1bp1 enhances IL-6, IL-1β, and PGE2 secretion during AM infection.
AMs were seeded at 100,000 cells/well and infected in triplicate wells with Mtb at a M.O.I. of 5. At 24 hours post-infection, (A) the supernatants were collected for cytokine measurement by ELISA, and (B) AM monolayers were lysed and plated for Mtb CFU. Mean, SEM, and p-values from the t-test are displayed.
Figure 8.
Figure 8.. Tax1bp1 promotes necrotic-like cell death and delays apoptosis in Mtb-infected AMs.
AMs were infected with Mtb at a M.O.I. of 1 in the presence of PI (propidium iodide) and CellEvent without (A, B) or with (C, D) IFN-γ added to the media. Fluorescence images were obtained at 20X magnification in two positions per well in three replicate wells. (A, C) Representative fluorescence and brightfield microscopy images were merged, cropped, and scaled. (B, D) The number of fluorescent cells in each field was quantified in the green (CellEvent) and red fluorescence (PI) channels. Mean, SEM, and statistically significant FDR-adjusted p-values from t-test comparisons are displayed. For clarity, only statistically significant p-values (p ≤ 0.05) are shown. The white bar is 100 μm.
Figure 9.
Figure 9.. Overexpression of phosphosite-deficient Tax1bp1 restricts Mtb growth in AMs.
(A) Cell lysates from wild-type AMs transduced with lentivirus for overexpression of Flag-tagged wild-type or phosphomutant Tax1bp1 were separated by SDS-PAGE. Immunoblot was performed with primary antibodies for the Flag epitope or actin and secondary antibodies conjugated to IRdye 680RD or IRdye 800CW, respectively. Fluorescence images in the 680 (red) and 800 (green) channels are displayed. The mobility of the molecular weight marker is displayed. (B) Transduced AMs were infected with Mtb (M.O.I. 0.5) in 5 technical replicate wells, and CFU enumerated at 4 days post-infection. Mean, SEM and adjusted p-values from Tukey’s multiple comparison test (ordinary one-way ANOVA) are displayed.

References

    1. Stutz MD, Clark MP, Doerflinger M, Pellegrini M. Mycobacterium tuberculosis: Rewiring host cell signaling to promote infection. J Leukoc Biol. 2018. Feb;103(2):259–68. - PMC - PubMed
    1. Goren MB, D’Arcy Hart P, Young MR, Armstrong JA. Prevention of phagosome-lysosome fusion in cultured macrophages by sulfatides of Mycobacterium tuberculosis. Proc Natl Acad Sci USA. 1976. Jul;73(7):2510–4. - PMC - PubMed
    1. Jeong E-K, Lee H-J, Jung Y-J. Host-Directed Therapies for Tuberculosis. Pathogens. 2022. Nov 3;11(11). - PMC - PubMed
    1. Tobin DM. Host-Directed Therapies for Tuberculosis. Cold Spring Harb Perspect Med. 2015. May 18;5(10). - PMC - PubMed
    1. World Health Organization. Global Tuberculosis Report 2023. Geneva: World Health Organization; 2023. Nov.

Publication types

LinkOut - more resources