[Preprint]. 2024 Dec 27:2024.12.27.630524.
doi: 10.1101/2024.12.27.630524.

SLC35A2 loss of function variants affect glycomic signatures, neuronal fate, and network dynamics

Affiliations

SLC35A2 loss of function variants affect glycomic signatures, neuronal fate, and network dynamics

Dulcie Lai et al. bioRxiv. .

Update in

Abstract

SLC35A2 encodes a UDP-galactose transporter essential for glycosylation of proteins and galactosylation of lipids and glycosaminoglycans. Germline genetic SLC35A2 variants have been identified in congenital disorders of glycosylation and somatic SLC35A2 variants have been linked to intractable epilepsy associated with malformations of cortical development. However, the functional consequences of these pathogenic variants on brain development and network integrity remain elusive. In this study, we use an isogenic human induced pluripotent stem cell-derived neuron model to comprehensively interrogate the functional impact of loss of function variants in SLC35A2 through the integration of cellular and molecular biology, protein glycosylation analysis, neural network dynamics, and single cell electrophysiology. We show that loss of function variants in SLC35A2 result in disrupted glycomic signatures and precocious neurodevelopment, yielding hypoactive, asynchronous neural networks. This aberrant network activity is attributed to an inhibitory/excitatory imbalance as characterization of neural composition revealed preferential differentiation of SLC35A2 loss of function variants towards the GABAergic fate. Additionally, electrophysiological recordings of synaptic activity reveal a shift in excitatory/inhibitory balance towards increased inhibitory drive, indicating changes occurring specifically at the pre-synaptic terminal. Our study is the first to provide mechanistic insight regarding the early development and functional connectivity of SLC35A2 loss of function variant harboring human neurons, providing important groundwork for future exploration of potential therapeutic interventions.

Keywords: epilepsy; glycosylation; human stem cells; neural network; neurodevelopment.


Conflict of interest statement

Competing interests The authors report no competing interests.

Figures
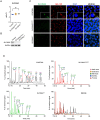
Figure 1.
Figure 1.. SLC35A2S304P/Y and SLC35A2−/Y encode loss-of-function proteins that result in altered glycosylation in undifferentiated iPSCs.
(A) Quantification of SLC35A2 mRNA expression levels by qRT-PCR. Data is representative of three pooled independent replicates each run in triplicate. Each dot represents a single data point. Control is represented as blue circles, SLC35A2S304P/Y as orange squares, and SLC35A2−/Y as grey triangles. Statistics: One-way ANOVA with Tukey’s multiple comparisons. (B) Western blot of SLC35A2 protein expression levels. GAPDH was used as a loading control. Un-cropped, full-length blots are provided in the Supplementary Materials. (C) Localization of SLC35A2 protein (green) with the Golgi apparatus (GM-130; red). Scale bar represents 10 μm. (D) Structural profiling of N-glycans in iPSCs. N-glycans were enzymatically released with PNGase F treatment, labeled with ProA, purified on a HILIC resin and separated using HPLC. HPLC spectra for control, SLC35A2S304P/Y and SLC35A2−/Y were merged in the bottom right panel. The data represents one of two independent replicates.
Figure 2.
Figure 2.. Altered N-glycosylation profiles during neuronal differentiation.
(A) Experimental workflow depicting directed differentiation protocol and experimental timepoints. Colored icons indicate timepoints at which experiments were conducted. Early neurodevelopmental phenotypes (neurite length and neural rosettes) were assessed at day 12 (orange square). RNA was collected at days 12, 20 and 84 (green diamond). Immunofluorescent staining of neurons was performed at day 52 and 86 (purple circle). MEA recordings were taken following plating at ~day 24 for two months as indicated by the blue bar. Electrophysiology recordings were performed between day 75–90, as represented by the red bar. (B) Structural profiling of N-glycans in cultures at day 30 of differentiation. N-glycans were enzymatically released with PNGase F treatment, labeled with ProA, purified on a HILIC resin and separated using HPLC. HPLC spectra on the top row represents traces for each genotype as indicated. HPLC spectra on the bottom row represent merged traces with the specific genotypes as indicated. The data shown represents one of three independent replicates.
Figure 3.
Figure 3.. SLC35A2S304P/Y and SLC35A2−/Y promote early neurogenesis.
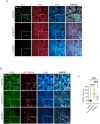
(A) Immunofluorescent staining for neural rosettes using the apical lumen marker, ZO-1 (green), and neural progenitor marker, PAX6 (red), at day 12 of differentiation. Nuclei were counterstained with DAPI (blue). Scalebar within the inset represents 20 μm. (B) Immunofluorescent staining of day 12 neural cultures for PAX6 (green) and ß3-TUBULIN (red). Nuclei were counterstained with DAPI (blue). Scalebar within the inset represents 20 μm. (C) Quantification of neurite length. One-way ANOVA with Tukey’s multiple comparisons. Data is representative of two pooled independent differentiations, with a total of three replicates. Eight regions of interest (ROI) were captured per coverslip. Each dot represents quantification from one ROI. * = P≤0.05; ** = P≤0.01; *** = P≤0.001 **** = P≤0.0001.
Figure 4.
Figure 4.. SLC35A2S304P/Y and SLC35A2−/Y generate hypoactive, asynchronous neural networks with prolonged bursting.
A-F) Graphs depicting MEA features extracted from meaRtools. Each graph contains all recordings for the duration of the experiment. Day in vitro (DIV) represents the number of days the neural networks were co-cultured with mouse astrocytes on MEA. Control networks in blue circles, SLC35A2S304P/Y networks in orange squares, and SLC35A2−/Y networks in grey triangles. Data shown is representative of one of four independent differentiations (Refer to Experiment 1 in Supplementary Figures 7 and 8). This differentiation included a technical replicate (A and B), each with 7 wells plated on MEA. The data represents the pooled average of the 14 wells per genotype with error bars representing the standard error. The number of technical replicates and wells plated per Experiment is summarized in Supplementary Table 5. P-value was derived using Mann Whitney test permuted 1000 times (see Methods). (A) Number of active electrodes. (B) Mean firing rate (MFR) by active electrode. (C) Spike train tiling coefficient (STTC). (D) Mean burst duration. (E) Mean inter-spike interval within bursts. (F) Spike frequency within bursts. (G) Raster plots from DIV60 (day 84 of differentiation). Each row of the y-axis represents the activity of one of the 16 electrodes. Spikes are represented in black and bursts represented in blue. Plots depict a 60 sec snapshot from a 15 minute recording.
Figure 5.
Figure 5.. Pharmacologic perturbation of neural networks supports differences in neural composition.
A baseline recording of neural networks were first obtained. Respective wells were then treated with vehicle or the appropriate pharmacologic agent. The treated MEA was then allowed to equilibrate for 5 minutes prior to recording. Data is representative of the mean and standard deviation of MEA wells pooled from two independent differentiations. Each dot represents data obtained from a single MEA well. (A) Treatment of neural networks with the AMPA/kainate receptor antagonist, CNQX. (i) Raster plots depicting a 60 second snapshot of network activity at baseline (top row) and following acute CNQX treatment (bottom row). (ii) The effect of CNQX on MFR by active electrode. (iii) The effect of CNQX on STTC. (B) Treatment of neural networks with the competitive GABA-A receptor antagonist, bicuculline. (i) Raster plot depicting a 60 second snapshot of network activity at baseline (top row) and following acute bicuculline treatment (bottom row). (ii) The effect of bicuculline on MFR by active electrode. (iii) The effect of bicuculline on STTC. Statistics: Two-way ANOVA test with Tukey’s to correct for multiple comparisons. * = P≤0.05; ** = P≤0.01; *** = P≤0.001 **** = P≤0.0001.
Figure 6.
Figure 6.. Characterization of early neurodevelopmental trajectories and neural composition.
A-E) Quantification of mRNA expression levels representative of telencephalic development, pallium/subpallium, and GABAergic/glutamatergic specific markers using qRT-PCR. Data is representative of at minimum two pooled independent differentiations with each replicate run in triplicate per genotype. Each dot represents a single data point. Control is represented as blue circles, SLC35A2S304P/Y as orange squares, and SLC35A2−/Y as grey triangles. (A) Markers specifying the telencephalon (FOXG1), pallium (EMX1), and subpallium/lateral ganglionic eminence (LGE): GSX2. (B) Markers specific to the medial ganglionic eminence (MGE: LHX6, NKX2–1) and caudal ganglionic eminence (CGE: NR2F2). (C) GABAergic specific transcription factors important for differentiation and fate specification: DLX2, DLX5, DLX6. Medium spiny neuron marker: DARPP32. (D) Transporter specific markers. GABAergic: SLC32A1/VGAT (vesicular GABA transporter), SLC6A1/GAT1 (GABA transporter 1); Glutamatergic: SLC17A7/VGLUT1 (vesicular glutamate transporter 1). (E) Enzymatic markers for neurotransmitter synthesis. GABAergic: GAD1 (glutamate decarboxylase 1). Glutamatergic: GLS (glutaminase). Statistics: Two-way ANOVA with Tukey’s to correct for multiple comparisons. * = P≤0.05; ** = P≤0.01; *** = P≤0.001; **** = P≤0.0001.
Figure 7.
Figure 7.. Whole-cell recordings reveal an enrichment in inhibitory synapses in SLC35A2S304P/Y and SLC35A2−/Y neurons.
(A) Representative traces of miniature excitatory post-synaptic currents (mEPSC; left) and miniature inhibitory post-synaptic currents (mIPSC; right) recorded from the same neuron by holding voltage at −60 mV and 0 mV, respectively. Five-minute-long recordings were performed in whole-cell voltage-clamp mode in the presence of 100 nM TTX to eliminate neurotransmitter release caused by action potential-dependent network activity. (B) Average mEPSC and mIPSCs obtained from control (blue), SLC35A2S304P/Y (grey), and SLC35A2−/Y (yellow) neurons. (C) Event frequencies of mEPSC and mIPSCs (Hz). (D) Proportion of mEPSC to mIPSC events recorded per neuron for each genotype. Statistics for C and D: Kruskal-Wallis test followed by Dunn’s test to correct for multiple comparisons. (E) Amplitude of mEPSC and mIPSC events (pA). (F) Decay constant for mEPSC and mIPSC (msec). (G) Average charge transfer for mEPSC and mIPSC (nC). Synaptic data is representative of two pooled independent differentiations with each dot representing recordings from a single neuron. Statistics for E through G: One-way ANOVA with Tukey’s to correct for multiple comparisons. (H) Expression of synaptic markers. Pansynaptic: SYN1; Excitatory post-synaptic: DLG4; Inhibitory post-synaptic: GPHN. Data is representative of two pooled independent differentiations each containing a technical replicate. Each replicate was run in triplicate per genotype. Each dot represents a single data point. Statistics for H: Two-way ANOVA with Tukey’s to correct for multiple comparisons. * = P≤0.05; ** = P≤0.01; *** = P≤0.001; **** = P≤0.0001.

References

    1. Aoki K, Ishida N, Kawakita M. Substrate recognition by UDP-galactose and CMP-sialic acid transporters. Different sets of transmembrane helices are utilized for the specific recognition of UDP-galactose and CMP-sialic acid. J Biol Chem. Jun 15 2001;276(24):21555–61. doi:10.1074/jbc.M101462200 - DOI - PubMed
    1. Ng BG, Buckingham KJ, Raymond K, et al. Mosaicism of the UDP-galactose transporter SLC35A2 causes a congenital disorder of glycosylation. Am J Hum Genet. Apr 04 2013;92(4):632–6. doi:10.1016/j.ajhg.2013.03.012 - DOI - PMC - PubMed
    1. Mikolajczyk K, Kaczmarek R, Czerwinski M. How glycosylation affects glycosylation: the role of N-glycans in glycosyltransferase activity. Glycobiology. Dec 09 2020;30(12):941969. doi:10.1093/glycob/cwaa041 - DOI - PubMed
    1. Scott H, Panin VM. N-glycosylation in regulation of the nervous system. Adv Neurobiol. 2014;9:367–94. doi:10.1007/978-1-4939-1154-7_17 - DOI - PMC - PubMed
    1. Scott H, Panin VM. The role of protein N-glycosylation in neural transmission. Glycobiology. May 2014;24(5):407–17. doi:10.1093/glycob/cwu015 - DOI - PMC - PubMed

Publication types

LinkOut - more resources