[Preprint]. 2025 Mar 1:2024.12.29.630665.
doi: 10.1101/2024.12.29.630665.

Beta cell dysfunction occurs independently of insulitis in type 1 diabetes pathogenesis

Affiliations

Beta cell dysfunction occurs independently of insulitis in type 1 diabetes pathogenesis

Mollie K Huber et al. bioRxiv. .

Abstract

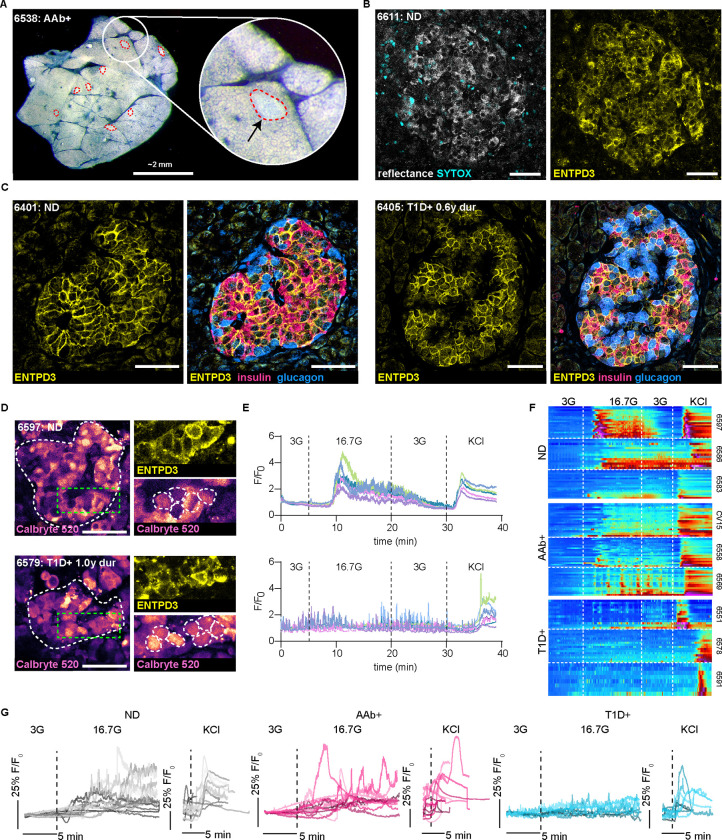
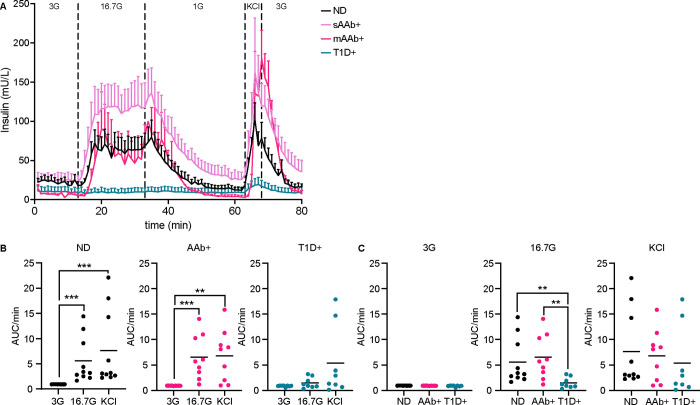
The loss of insulin secretory function associated with type 1 diabetes (T1D) is attributed to the immune-mediated destruction of beta cells. Yet, at onset of T1D, patients often have a significant beta cell mass remaining while T cell infiltration of pancreatic islets is sporadic. Thus, we investigated the hypothesis that the remaining beta cells in T1D are largely dysfunctional using live human pancreas tissue slices prepared from organ donors with recently diagnosed T1D. Beta cells in slices from donors with T1D had significantly diminished Ca2+ mobilization and insulin secretion responses to glucose. Beta cell function was equally impaired in T cell-infiltrated and non-infiltrated islets. Fixed tissue staining and gene expression profiling of laser-capture microdissected islets revealed significant decreases of proteins and genes in the glucose stimulus secretion coupling pathway. From these data, we posit that functional defects occur in the remaining mass of beta cells during human T1D pathogenesis.

Keywords: beta cell; calcium; function; gene expression; human; insulin; metabolism; pancreas; slice; type 1 diabetes.


Figures

Figure 1:
Figure 1:
ENTPD3 staining identifies beta cells in live pancreas tissue slices from ND and T1D+ donors. (A) Darkfield stereomicroscopy image of a live human pancreas tissue slice with islets outlined in red. (B) Confocal image of an islet within a live slice indicated by reflected light and ENTPD3. Dead cells are indicated by SYTOX staining. (C) Fixed tissue staining of FFPE human pancreas tissue sections showing ENTPD3 positive cells co-localize with insulin positive cells and not glucagon positive cells in both ND and T1D+ cases. (D) Reflective and ENTPD3 positive islets within ND and T1D+ slices outlined in red. Still frames of Ca2+ responses to high glucose (16.7G) of the same islets outlined in white (middle). Magnified regions outlined in green within these islets showing individual ENTPD3+ cells, outlined in white. (E) Heatmaps depicting representative islet Ca2+ responses to low glucose (3 mM), high glucose (16.7 mM), and KCl (30 mM) in three donors from ND, Aab+, and T1D+ cases. Each column represents the Ca2+ response in an individual ENTPD3+ cell. (F) Traces of the mean islet Ca2+ response from all recorded ND (n=14), Aab+ (n=11), and T1D+ cases (n=9). Scale bars, 50 μm.
Figure 2:
Figure 2:
Beta cells exhibit a period of dysfunction prior to death. (A-C) The maximum Ca2+ response of the mean islet trace during basal activity in low glucose (3 mM), high glucose (16.7 mM), and KCl (30 mM). Each dot represents an islet recording and the shade represents donor for ND (n=14), Aab+ (n=11), and T1D+ (n=9) slice cases. (D) The ratio of the high glucose response to the low glucose response for individual beta cells in ND, Aab+, and T1D+ Ca2+ recordings demonstrates a loss of high glucose responses in T1D+ donors. Each dot represents a beta cell. (E) The fraction of beta cells responding to high glucose within each islet recorded from ND, Aab+, and T1D+ cases. Each dot represents an islet recording. Center line indicates the mean. One-way ANOVA with multiple comparisons.
Figure 3:
Figure 3:
Beta cell insulin secretion decreases after T1D diagnosis. (A) Average insulin secretion traces from ND, Aab+, and T1D+ donors to low glucose (3 mM), high glucose (16.7 mM) and KCl (30 mM). (B) Quantification of AUC per minute of insulin secretion of live pancreas tissue slices from ND (n=10), Aab+ (n=9), and T1D+ (n=8) donors. Each dot represents one donor. (C) Quantification of AUC per minute of insulin secretion of the donor groups during different glucose stimulations. One-way ANOVA with multiple comparisons run on log10 transformed data, **P<0.01, ***P<0.001.
Figure 4:
Figure 4:
Beta cells in T1D are dysfunctional regardless of T cell infiltration. (A) Still image from a confocal timelapse recording of live endogenous insulitis within a T1D+ human pancreas tissue slice. Individual channels indicate the presence of viable beta cells (ENTPD3+/SYTOXneg), and CD3+ T cells. Scale bars, 20 μm. (B) Cell tracks demonstrating CD3+ T cell movement within and around the insulitic islet over 30 minutes. Scale bars, 20 μm. (C) Quantification of T cell motility within several different T cell infiltrated T1D+ islets compared to exocrine tissue. Unpaired t test. (D) Confocal images of CD3-infiltrated and non-infiltrated islets from the same T1D+ donor. Scale bars, 20 μm. (E) Ca2+ traces of viable ENTPD3+ cells in the depicted infiltrated (top panel) and non-infiltrated (bottom panel) T1D islets. (F) The fraction of beta cells responding to high glucose (16.7G) within each islet recorded for ND, Aab+, and T1D+ slices. T1D cases are separated into islets with low or high numbers of T cell infiltrates. ND and Aab+ islets all have five or fewer T cells. Stats to be added/ updated after analysis (G) Images of FFPE histological sections from T1D+ donors confirming the presence of insulin+ islets with insulitis in the studied donors. Scale bars, 50 μm.
Figure 5:
Figure 5:
Beta cell glucose metabolism is disrupted during T1D pathogenesis. (A) Immunofluorescent images from ND and T1D+ donors representative of the dataset plotted in panel B. Scale bars, 20 μm. (B) Protein expression levels indicated by mean fluorescence intensity during the different stages of T1D development in donors with ND (n=9), sAab+ donors (n=7), mAab+ donors (n=7), and T1D+ donors (n=6). Scale bars, 20 μm. One-way ANOVA with multiple comparisons, *P<0.05, **P<0.01, ***P<0.001, ****P<0.0001. (C) RNA expression levels of glucose metabolisms markers in laser-capture micro-dissected islets from donors at different stages of T1D development (ND, n=10; sAab+, n=3; mAab+, n=3; T1D+, n=6). One-way ANOVA followed by a Tukey post-hoc test, *P<0.05, **P<0.01, ***P<0.001, ****P<0.0001.
Figure 6:
Figure 6:
Downregulation of beta cell glucose metabolism markers occurs during T1D pathogenesis. (A) Schematic of beta cell glucose metabolism with the proteins targeted in these studies indicated in blue. (B) Heatmap visualization of protein expression. Red represents higher expression and blue represents lower expression relative to the ND group used as the baseline population for mean and standard deviation calculations. Proteins involved in glycolysis and mitochondrial respiration have expression changes as T1D pathogenesis progresses. The Ca2+ channel Cav1.3 and HLA Class I ABC also have increased expression in T1D+ donors.

Similar articles

References

    1. Olmos P. et al. The significance of the concordance rate for type 1 (insulin-dependent) diabetes in identical twins. Diabetologia 31, 747–750 (1988). 10.1007/BF00274777 - DOI - PubMed
    1. Hyttinen V., Kaprio J., Kinnunen L., Koskenvuo M. & Tuomilehto J. Genetic liability of type 1 diabetes and the onset age among 22,650 young Finnish twin pairs: a nationwide follow-up study. Diabetes 52, 1052–1055 (2003). 10.2337/diabetes.52.4.1052 - DOI - PubMed
    1. Nistico L. et al. Emerging effects of early environmental factors over genetic background for type 1 diabetes susceptibility: evidence from a Nationwide Italian Twin Study. J Clin Endocrinol Metab 97, E1483–1491 (2012). 10.1210/jc.2011-3457 - DOI - PubMed
    1. Redondo M. J., Jeffrey J., Fain P. R., Eisenbarth G. S. & Orban T. Concordance for islet autoimmunity among monozygotic twins. New England Journal of Medicine 359, 2849–2850 (2008). 10.1056/NEJMc0805398 - DOI - PubMed
    1. Campbell-Thompson M. et al. Insulitis and beta-Cell Mass in the Natural History of Type 1 Diabetes. Diabetes 65, 719–731 (2016). 10.2337/db15-0779 - DOI - PMC - PubMed

Publication types

LinkOut - more resources