[Preprint]. 2024 Dec 17:2024.12.16.628723.
doi: 10.1101/2024.12.16.628723.

Long-read sequencing of hundreds of diverse brains provides insight into the impact of structural variation on gene expression and DNA methylation

Affiliations

Long-read sequencing of hundreds of diverse brains provides insight into the impact of structural variation on gene expression and DNA methylation

Kimberley J Billingsley et al. bioRxiv. .

Abstract

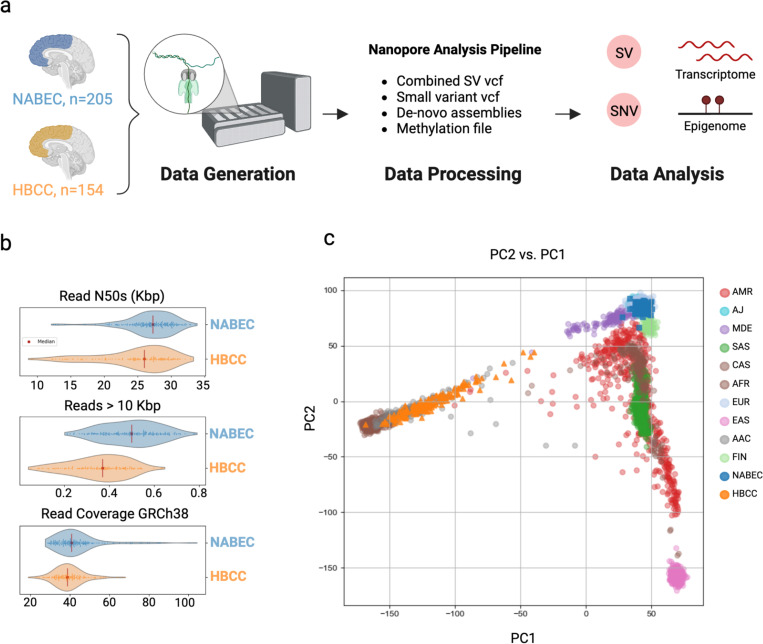
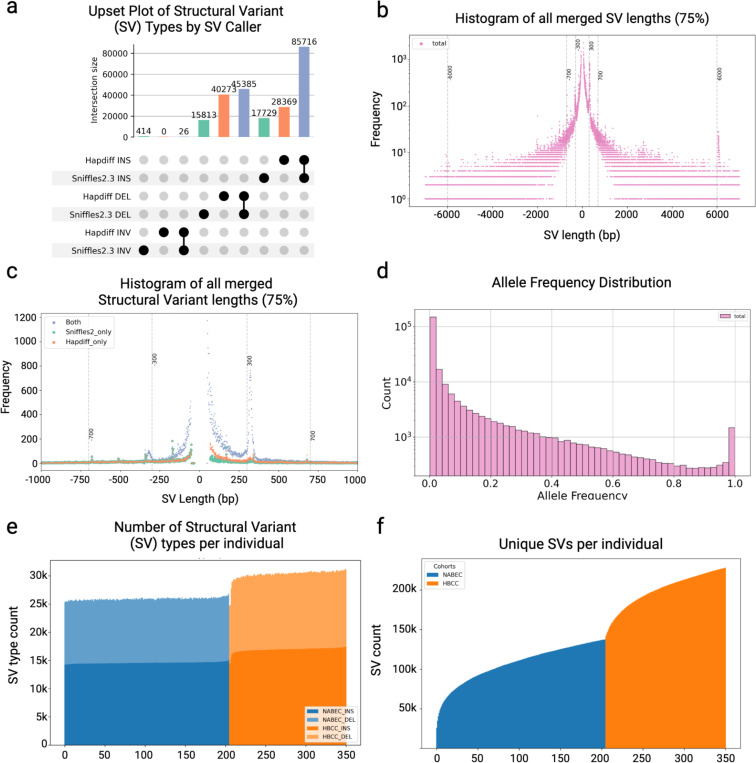
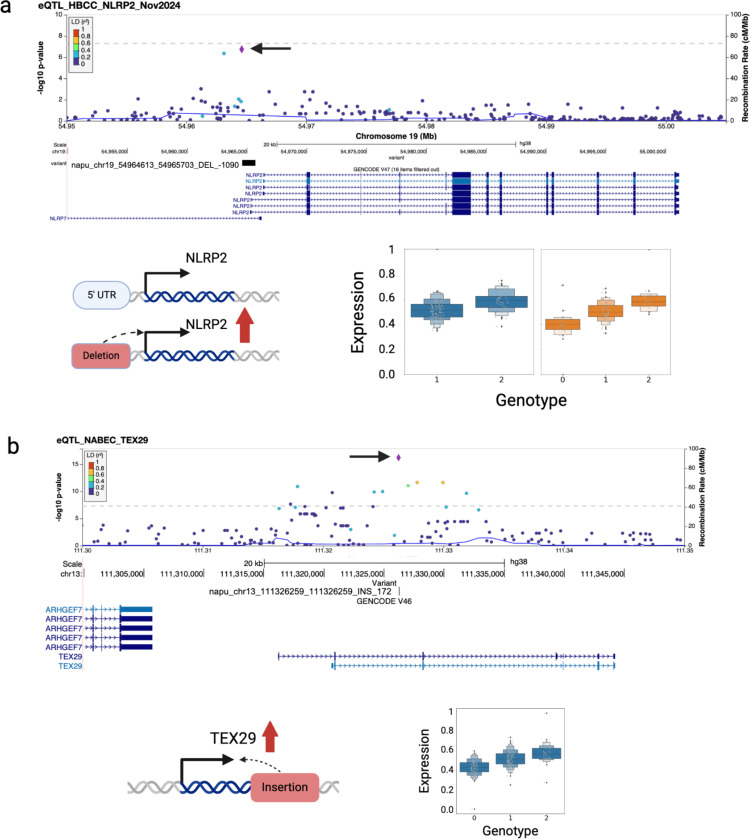
Structural variants (SVs) drive gene expression in the human brain and are causative of many neurological conditions. However, most existing genetic studies have been based on short-read sequencing methods, which capture fewer than half of the SVs present in any one individual. Long-read sequencing (LRS) enhances our ability to detect disease-associated and functionally relevant structural variants (SVs); however, its application in large-scale genomic studies has been limited by challenges in sample preparation and high costs. Here, we leverage a new scalable wet-lab protocol and computational pipeline for whole-genome Oxford Nanopore Technologies sequencing and apply it to neurologically normal control samples from the North American Brain Expression Consortium (NABEC) (European ancestry) and Human Brain Collection Core (HBCC) (African or African admixed ancestry) cohorts. Through this work, we present a publicly available long-read resource from 351 human brain samples (median N50: 27 Kbp and at an average depth of ~40x genome coverage). We discover approximately 234,905 SVs and produce locally phased assemblies that cover 95% of all protein-coding genes in GRCh38. Utilizing matched expression datasets for these samples, we apply quantitative trait locus (QTL) analyses and identify SVs that impact gene expression in post-mortem frontal cortex brain tissue. Further, we determine haplotype-specific methylation signatures at millions of CpGs and, with this data, identify cis-acting SVs. In summary, these results highlight that large-scale LRS can identify complex regulatory mechanisms in the brain that were inaccessible using previous approaches. We believe this new resource provides a critical step toward understanding the biological effects of genetic variation in the human brain.


Conflict of interest statement

K.S. is an employee of Google LLC and owns Alphabet stock as part of the standard compensation package; authors from Google LLC did not have access to the cell line and brain tissue sample data. WT has two patents (8,748,091 and 8,394,584) licensed to Oxford Nanopore Technologies. F.J.S. received research support from Illumina, Pacific Biosciences and Oxford Nanopore Technologies. DEM is on a scientific advisory board at Oxford Nanopore Technologies (ONT), is engaged in a research agreement with ONT, and they have paid for him to travel to speak on their behalf. DEM is a scientific advisory board member at Basis Genetics. DEM holds stock options in MyOme and Basis Genetics. This research was supported in part by the Intramural Research Program of the NIH, National Institute on Aging (NIA), National Institutes of Health, Department of Health and Human Services; project number ZO1 AG000534. This work utilized the computational resources of the NIH STRIDES Initiative (https://cloud.nih.gov) through the Other Transaction agreement - Azure: OT2OD032100, Google Cloud Platform: OT2OD027060, Amazon Web Services: OT2OD027852. This work utilized the computational resources of the NIH HPC Biowulf cluster (https://hpc.nih.gov). Some authors’ participation in this project was part of a competitive contract awarded to DataTecnica LLC by the National Institutes of Health to support open science research. M.A.N. also owns stock in Character Bio Inc. and Neuron23 Inc.

Figures

Figure 1:
Figure 1:. Overview of the study and samples.
a. Graphical overview of the project workflow. b. Read N50s, proportion of reads longer than 10Kbp, and read coverage of GRCh38 for each cohort. Median values are denoted by the red vertical lines. c. Principal Component Analysis (PCA) of ancestry predictions using NABEC Illumina SNVs (blue squares) and HBCC ONT SNVs (orange triangles) overlaid on 1000 Genomes SNV ancestry clustering confirming that the NABEC cohort is predominantly of European ancestry while the HBCC cohort is of African or African admixed ancestry.
Figure 2:
Figure 2:. Assembly statistics for both cohorts
a. Shasta+Hapdup Dual assembly NGx plot for HBCC and NABEC Cohorts, compared to the 3.1 Gb length of the T2T-CHM13v2.0 assembly. b. NG50’s of phased assemblies illustrate the increased phase block size of African American ancestry HBCC R10 samples. The red line is the median value. c. The number of assembled base pairs in dual assemblies aligned to CHM13v2.0. d. Contig identity mapped to CHM13. e. Percentages of Genbank v44 protein-coding genes completely assembled in each samples’ dual assembly.
Figure 3:
Figure 3:. Structural variant characterization across both cohorts
a. An upset plot of SVs by SV caller and SV type tallied after merging. Hapdiff called 28,369 insertions and 40,273 insertions that weren’t merged with Sniffles. Sniffles called 17,729 insertions and 15,813 deletions that weren’t merged with Hapdiff. 85,716 insertions and 45,385 deletions were called by both callers and merged together by Truvari. b. The size of insertions and deletions is plotted as negative for deletions and positive for insertions. Expected peaks of common SVs are shown at 300 bps, Alu repeats, 700 bps, SINE, and 6000 bps LINE1. c. Size of SVs that are merged between SV callers, shown in lavender, and called by just one SV caller. Sniffles SVs that weren’t merged with Hapdiff SVs are shown in green and Hapdiff only SVs are in orange. d. Allele frequency distribution of merged SVs. e. The number of SVs per individual is stratified by insertions in dark blue, NABEC, or dark orange, HBCC, and deletions in the lighter blue and orange. f. A cumulative bar chart that shows the number of new unique SVs added by each individual across both cohorts. The European NABEC cohort contributed ~115,000 SVs and the HBCC cohort contributed another ~125,000 SVs to create the set of 234,905 SVs merged across both cohorts and SV callers.
Figure 4:
Figure 4:. eQTL discovery and fine-mapping
a. Example of an eQTL in the NLRP2 gene. The top panel presents a locuszoom plot of the SV and small variant joint eQTL for HBCC, with an arrow indicating the top significant variant, napu_chr19_54964613_54965703_DEL_−1090. The middle panel illustrates a deletion overlapping the 5’ transcription start sites of several transcripts of NLRP2. The bottom left panel shows a boxplot of the eQTL stratified by genotypes of the deletion (NABEC in blue, HBCC in orange). The bottom right panel depicts a schematic representation of the effect of the variant. b. Example of an SV and small variant joint eQTL driven by an SV in NABEC. The top panel presents a locus zoom plot of the SV and small variant joint eQTL for NABEC, with an arrow indicating the top significant variant, napu_chr13_111326259_111326259_INS_172. The middle panel shows the variant overlapping an intron of TEX29. The bottom left panel displays a boxplot of the eQTL stratified by genotypes of the insertion (NABEC in blue). The bottom right panel depicts a schematic representation of the variant’s effect.
Figure 5:
Figure 5:. Profiling genome-wide methylation in the frontal cortex
a. Aggregated methylation frequency of NABEC (blue) and HBCC (orange) samples by quartile for CpG islands, promoter regions ( extended to 2kb ), and across RefSeq gene bodies. b. Age associations of whole genome 1Kb / 50 CpG minimum windows of averaged methylation in the NABEC cohort. Many regions (145,086; FDR 0.05) were weakly associated with age; the slope of the linear regression ranged from −0.1 to 0.1. The volcano plot is of age regressions; x-axis is the slope of the regression line y-axis is the Benjamini-Hochberg corrected p-values. c. Two neighboring regions significantly associated with age that overlap exons of the Protocadherins Gamma (PCDHAG) cluster of genes. d. Tracks of windows showing methylation increase with age. Top track is a barplot of the amount of methylation increase (slope) by age. Window locations associated with age are shown below. The locations of Illumina 450 and EPIC 850 Methylation Arrays are shown above the gene locations. Across the bottom are coordinates of Chr 5.
Figure 6:
Figure 6:. mQTL discovery and fine-mapping
a. Example of a SV-SNV joint cpg-islands-mQTL led by a SV in the gene NLRP2. The top panel presents a locuszoom plot of the SV-SNV joint cpg-islands mQTL for HBCC, with an arrow indicating the top significant variant, napu_chr19_54964613_54965703_DEL_−1090. The middle panel illustrates the variant overlapping the 5’ transcription start sites of several transcripts of NLRP2 and the phenotype cpg island overlapping with the exon of NLRP2. The bottom panel shows a boxplot of the eQTL stratified by genotypes of the deletion (NABEC in blue, HBCC in orange). b. Example of a SV-SNV joint promoter-mQTL led by a SV in the gene APOBEC3H. The top panel presents a locuszoom plot of the SV-SNV joint cpg-islands mQTL for HBCC, with an arrow indicating the top significant variant, napu_chr22_39101634_39101696_DEL_−62. The middle panel illustrates the variant overlapping the intron of APOBEC3H and the phenotype cpg island overlapping with the exons and intron of APOBEC3H. The bottom panel shows a boxplot of the mQTL stratified by genotypes of the deletion (NABEC in blue, HBCC in orange).

Similar articles

Cited by

References

    1. Ding W. et al. Adaptive functions of structural variants in human brain development. Sci Adv 10, eadl4600 (2024). - PMC - PubMed
    1. Han L. et al. Functional annotation of rare structural variation in the human brain. Nat Commun 11, 2990 (2020). - PMC - PubMed
    1. van Bree E. J. et al. A hidden layer of structural variation in transposable elements reveals potential genetic modifiers in human disease-risk loci. Genome Res 32, 656–670 (2022). - PMC - PubMed
    1. Sleegers K. et al. APP duplication is sufficient to cause early onset Alzheimer’s dementia with cerebral amyloid angiopathy. Brain 129, 2977–2983 (2006). - PubMed
    1. Singleton A. B. et al. alpha-Synuclein locus triplication causes Parkinson’s disease. Science 302, 841 (2003). - PubMed

Publication types

LinkOut - more resources