[Preprint]. 2024 Dec 16:2024.12.15.628588.
doi: 10.1101/2024.12.15.628588.

Deep learning-based prediction of chemical accumulation in a pathogenic mycobacterium

Affiliations

Deep learning-based prediction of chemical accumulation in a pathogenic mycobacterium

Mark R Sullivan et al. bioRxiv. .

Abstract

Drugs must accumulate at their target site to be effective, and inadequate uptake of drugs is a substantial barrier to the design of potent therapies. This is particularly true in the development of antibiotics, as bacteria possess numerous barriers to prevent chemical uptake. Designing compounds that circumvent bacterial barriers and accumulate to high levels in cells could dramatically improve the success rate of antibiotic candidates. However, a comprehensive understanding of which chemical structures promote or prevent drug uptake is currently lacking. Here we use liquid chromatography-mass spectrometry to measure accumulation of 1528 approved drugs in Mycobacterium abscessus, a highly drug-resistant, opportunistic pathogen. We find that simple chemical properties fail to effectively predict drug accumulation in mycobacteria. Instead, we use our data to train deep learning models that predict drug accumulation in M. abscessus with high accuracy, including for chemically diverse compounds not included in our original drug library. We find that differential drug uptake is a critical determinant of the efficacy of drugs currently in development and can identify compounds which accumulate well and have antibacterial activity in M. abscessus. These predictive algorithms can be an important complement to chemical synthesis and accumulation assays in the evaluation of drug candidates.

Keywords: Drug uptake; chemical permeability; deep learning; mycobacteria.


Conflict of interest statement

Declaration of Interests The authors declare no competing interests.

Figures
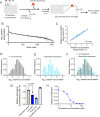
Figure 1.
Figure 1.. Measurement of accumulation of approved drugs in M. abscessus.
(A) Schematic of method for measurement of accumulation of library of 1528 compounds approved for use in humans or animals in M. abscessus. LC-MS: liquid chromatography-mass spectrometry. (B) LC-MS measurement of peak area of cell-associated fraction of 1528 compounds in M. abscessus normalized to peak area of each compound in the media used for the experiment prior to incubation with bacteria. Relative accumulation is normalized to the compound with the lowest accumulation. Data represent mean +/− SD. n=3 independent cultures for each chemical compound. (C) Correlation between relative accumulation of compounds replicated in the chemical library with different counter-ions or protonation state. Each dot represents mean +/− SD of one compound. n=3 independent cultures for each compound. (D) Histogram displaying the relative accumulation of all 1528 compounds (D), only steroid-like compounds (E), or both overlaid (F) in M. abscessus. Relative accumulation was calculated as described in (B). (F) Fluorescence of pirarubicin after 160 minutes of incubation normalized to initial fluorescence. Fluorescence was measured either after incubation of pirarubicin in fresh culture medium (pirarubicin alone), conditioned culture medium, with live M. abscessus, or with fixed M. abscessus. Data represent mean +/− SD. n=6 independent cultures for each condition. p-value derived from unpaired, two-tailed t test. (G) Relative proliferation of M. abscessus as measured by autoluminescence in the presence of the indicated concentrations of pirarubicin. Proliferation is normalized to vehicle-treated condition. Data represent mean +/− SD. n=6 independent cultures for each drug dose.
Figure 2.
Figure 2.. Antibiotics generally display low accumulation in M. abscessus.
(A) LC-MS measurement of relative accumulation of antibiotics of indicated classes. Data represent mean +/− SD. n=3 independent cultures. (B) LC-MS measurement of relative accumulation of indicated antibiotics. For antibiotics in a class with more than one member, antibiotic class is indicated above data. Data represent mean +/− SD. n=3 independent cultures. (C) Histogram displaying distribution of relative accumulation of antibacterial compounds in M. abscessus. (D) Overlay of histogram in (C) and histogram in Figure 1C.
Figure 3.
Figure 3.. Physical properties do not strongly predict chemical uptake in M. abscessus.
(A) Chemical structures of selected compounds in the top 1% of relative accumulation in M. abscessus. (B) Correlation between molecular weight (B), predicted octanol:water partitioning coefficient (logP) (C), and relative polar surface area (D) with log10 relative accumulation in M. abscessus. R represents the coefficient of determination. (E) UMAP depicting fragment-based chemical similarity of 1528 compounds. Log10 relative accumulation for each compound is indicated by color. (F) Inset of (E) indicated by dotted box. (G) Chemical structures of indicated compounds present in (F).
Figure 4.
Figure 4.. Transfer learning-based models accurately predict chemical accumulation.
(A) Schematic of classifier-based deep learning approach to predict chemical accumulation. (B) Receiver operating characteristic (ROC) curve for a classifier that considers a top 50% relative accumulation value to correspond to accumulation. (C) Receiver operating characteristic (ROC) curve for a classifier that considers a top 20% relative accumulation value to correspond to accumulation. (D) Histogram of predictions made by the top 50% classifier in (B) on the corresponding test set. (E) Correlation of predicted and measured log10 relative accumulation of test set compounds by an augmented regression model. R represents the coefficient of determination. (F) Cumulative distribution function for the difference between predicted and actual log10 relative accumulations in (E). AUROC: area under receiver operating characteristic curve.
Figure 5.
Figure 5.. Prediction of chemical uptake reveals compounds with high accumulation.
(A) Prediction of chemical accumulation for 8 quinolone antibiotics not previously measured by both the augmented regression model in Figure 4E and the classifier in Figure 4B. (B) LC-MS measurement of peak area of cell-associated fraction of indicated quinolone antibiotics in M. abscessus normalized to peak area of each compound in the media used for the experiment prior to incubation with bacteria. Relative accumulation is normalized to the compound with the lowest accumulation in Figure 1B. Data represent mean +/− SD. n=3 independent cultures for each chemical compound. (C) Correlation between the augmented regression model predictions in (A) with the LC-MS measurements in (B). Each dot represents one quinolone antibiotic. Data represent mean +/− SD. n=3 independent cultures for each chemical compound. (D) Correlation between the classifier model predictions in (A) with the LC-MS measurements in (B). Each dot represents one quinolone antibiotic. Data represent mean +/− SD. n=3 independent cultures for each chemical compound. (E) Correlation between augmented regression model predictions of uptake of the indicated three MmpL3 inhibitors with log10 minimal inhibitory concentrations for each drug against M. abscessus. Log10 minimal inhibitory concentrations were not measured in this study, but instead calculated based on previous work. (F) Histogram of the distribution of predicted log10 relative accumulation of 2.4 million compounds in the ChEMBL library. Bins represent log10 number of compounds in each range of predicted accumulation. (G) Correlation between augmented regression model predictions of uptake of the indicated six compounds with LC-MS measurements of the relative accumulation of those six compounds. Data represent mean +/− SD. n=3 independent cultures for each chemical compound. (H) Relative proliferation of M. abscessus as measured using an autoluminescent strain in the presence of the indicated concentrations of ungeremine or amikacin. Proliferation is normalized to vehicle-treated condition. Data represent mean +/− SD. n=6 independent cultures for each drug dose.

Similar articles

References

    1. Hui J., Gordon N. & Kajioka R. Permeability barrier to rifampin in mycobacteria. Antimicrob Agents Chemother 11, 773–779, doi:10.1128/AAC.11.5.773 (1977). - DOI - PMC - PubMed
    1. Rybenkov V. V. et al. The Whole Is Bigger than the Sum of Its Parts: Drug Transport in the Context of Two Membranes with Active Efflux. Chem Rev 121, 5597–5631, doi:10.1021/acs.chemrev.0c01137 (2021). - DOI - PMC - PubMed
    1. Hanssen K. M., Haber M. & Fletcher J. I. Targeting multidrug resistance-associated protein 1 (MRP1)-expressing cancers: Beyond pharmacological inhibition. Drug Resist Updat 59, 100795, doi:10.1016/j.drup.2021.100795 (2021). - DOI - PubMed
    1. Silhavy T. J., Kahne D. & Walker S. The bacterial cell envelope. Cold Spring Harb Perspect Biol 2, a000414, doi:10.1101/cshperspect.a000414 (2010). - DOI - PMC - PubMed
    1. Dulberger C. L., Rubin E. J. & Boutte C. C. The mycobacterial cell envelope - a moving target. Nat Rev Microbiol 18, 47–59, doi:10.1038/s41579-019-0273-7 (2020). - DOI - PubMed

Publication types

LinkOut - more resources