[Preprint]. 2024 Dec 17:2024.12.14.628481.
doi: 10.1101/2024.12.14.628481.

Chromosomal rearrangements and instability caused by the LINE-1 retrotransposon

Affiliations

Chromosomal rearrangements and instability caused by the LINE-1 retrotransposon

Carlos Mendez-Dorantes et al. bioRxiv. .

Abstract

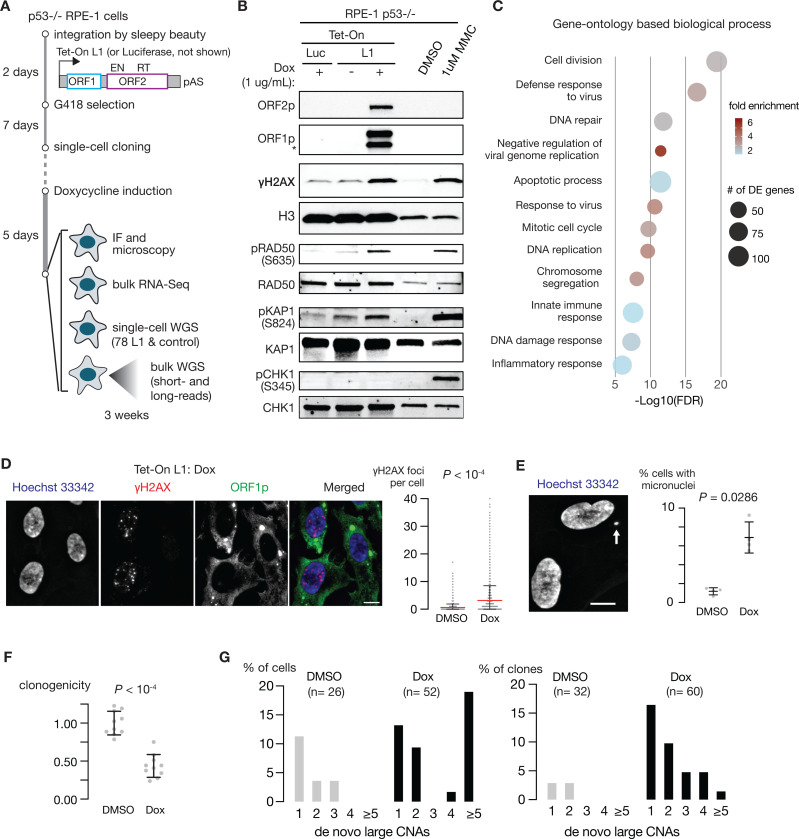
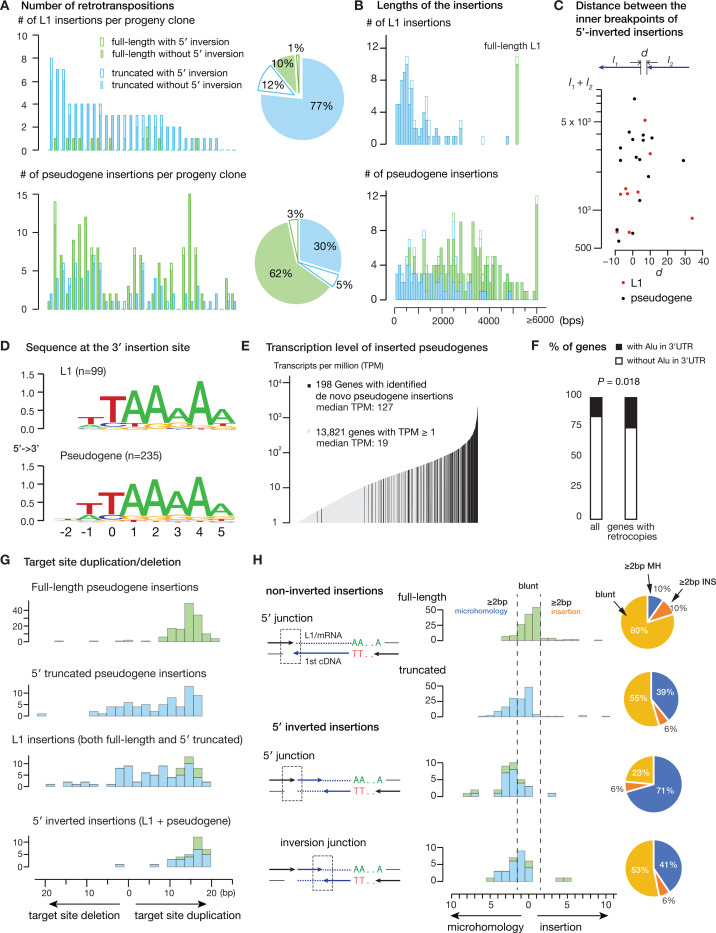
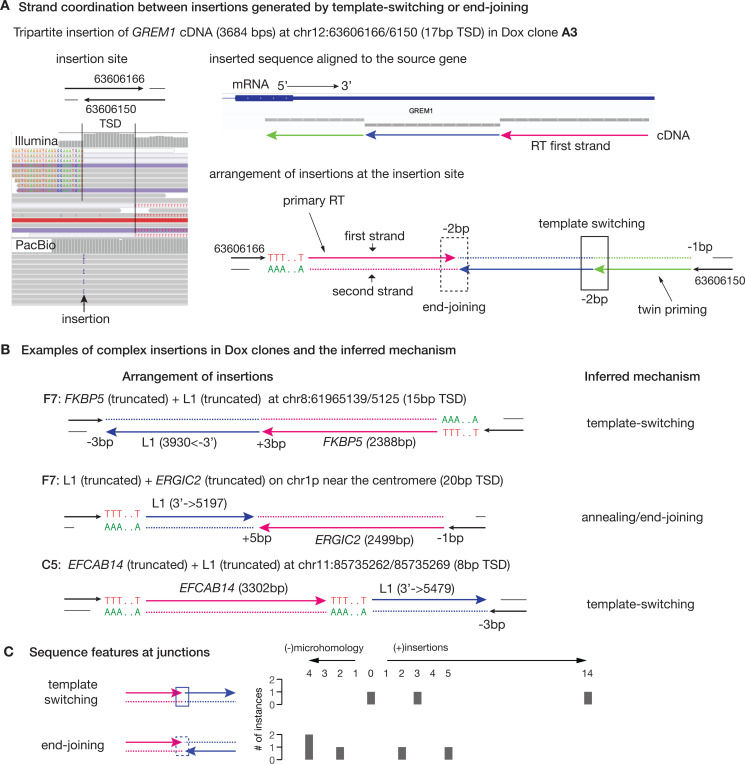
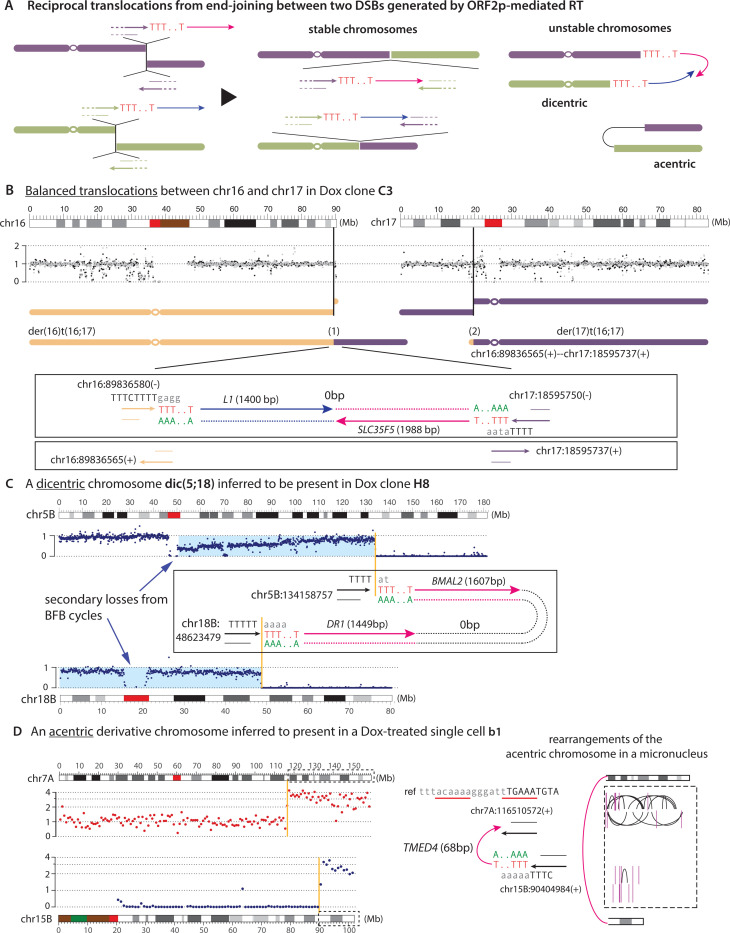
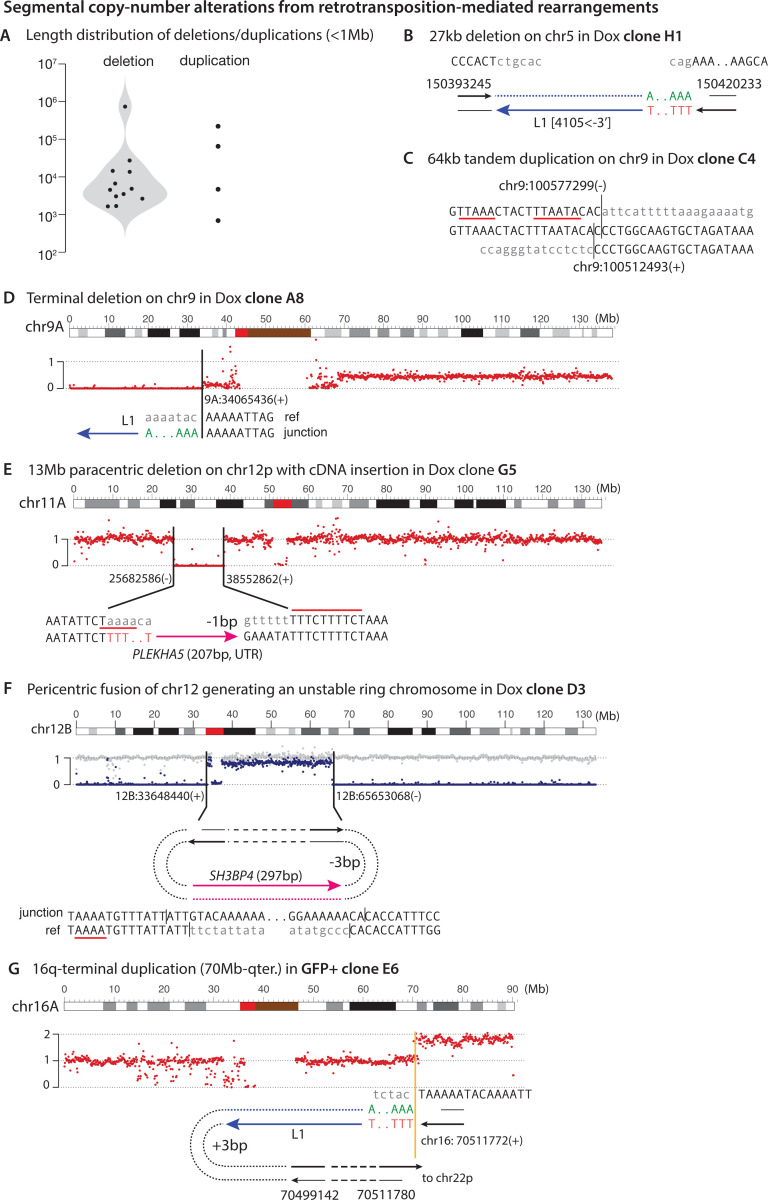
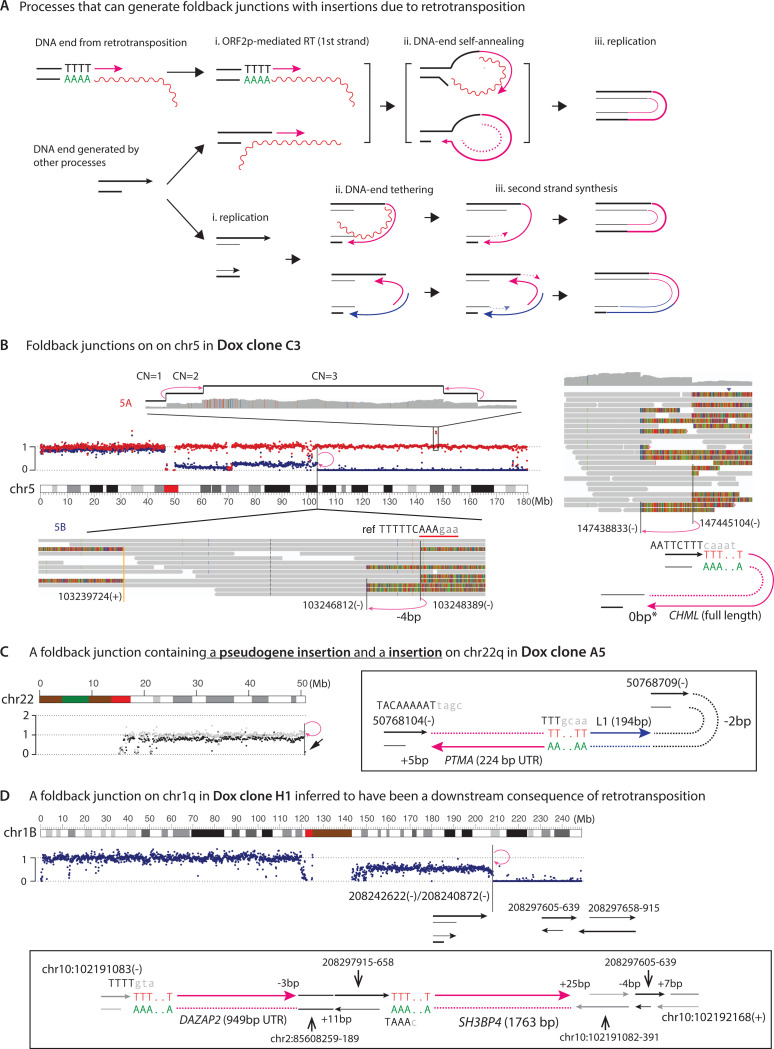
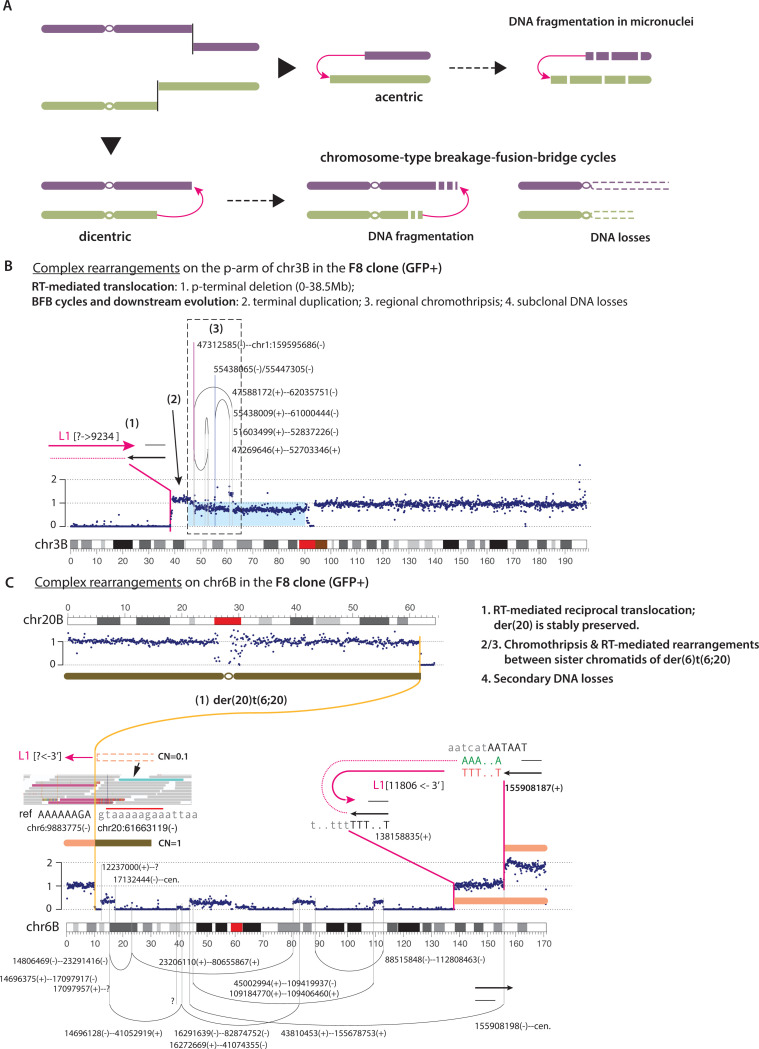
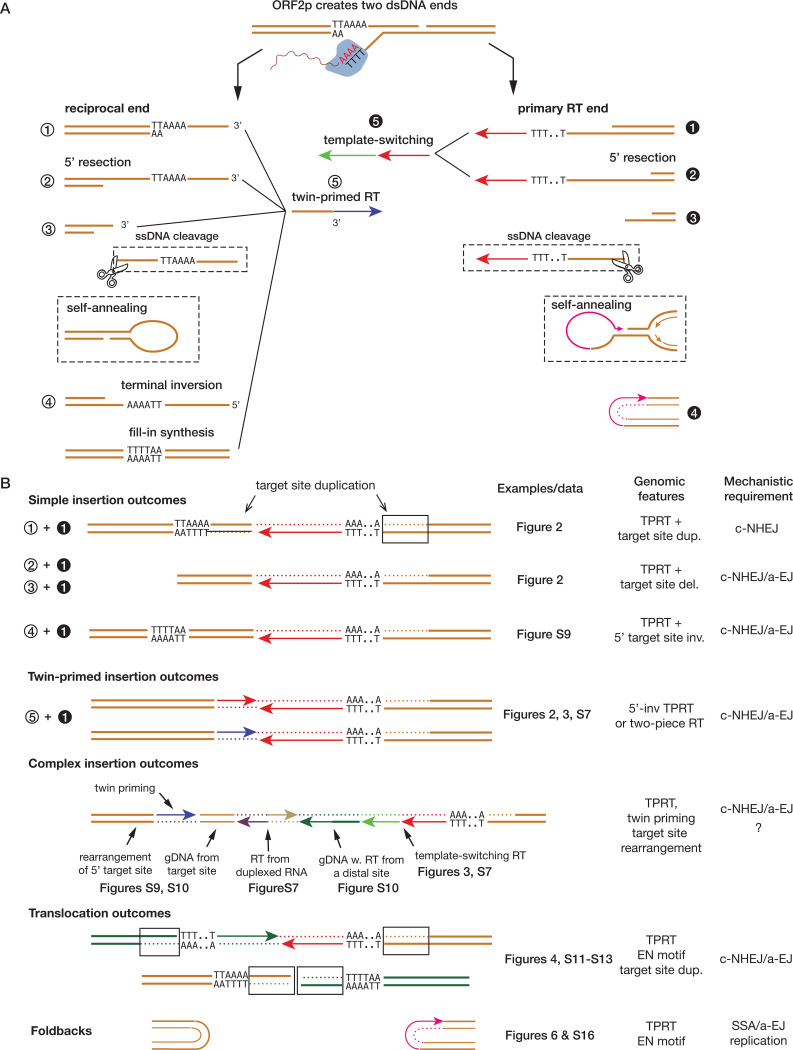
LINE-1 (L1) retrotransposition is widespread in many cancers, especially those with a high burden of chromosomal rearrangements. However, whether and to what degree L1 activity directly impacts genome integrity is unclear. Here, we apply whole-genome sequencing to experimental models of L1 expression to comprehensively define the spectrum of genomic changes caused by L1. We provide definitive evidence that L1 expression frequently and directly causes both local and long-range chromosomal rearrangements, small and large segmental copy-number alterations, and subclonal copy-number heterogeneity due to ongoing chromosomal instability. Mechanistically, all these alterations arise from DNA double-strand breaks (DSBs) generated by L1-encoded ORF2p. The processing of ORF2p-generated DSB ends prior to their ligation can produce diverse rearrangements of the target sequences. Ligation between DSB ends generated at distal loci can generate either stable chromosomes or unstable dicentric, acentric, or ring chromosomes that undergo subsequent evolution through breakage-fusion bridge cycles or DNA fragmentation. Together, these findings suggest L1 is a potent mutagenic force capable of driving genome evolution beyond simple insertions.


Figures

Figure 1 |
Figure 1 |
L1 expression causes extensive DNA damage including double-strand breaks. A. A schematic workflow of L1 induction and sequencing analysis. Expression of a codon-optimized L1 is induced in p53-nullRPE-1 cells for five days using a Tet-On expression system. Tet-On L1 transgene is integrated at 11 locations in the genome (see Figure S4). Cells with L1 induction, with induction of luciferase expression, and without induction (treated with DMSO) were used for subsequent analyses. B. Immunoblots of L1 encoded proteins ORF1p and ORF2p, γ-H2Ax, a histone marker of DNA damage, and markers of the DNA damage response including pRAD50 (S635), pKAP1 (S824), pCHK1 (S345) from whole cell lysates with or without L1 induction. Whole cell lysates of cells treated with 1 μM MMC were used as a positive control. C. Biological processes inferred from Gene Ontology (GO) analysis of differential gene expression due to L1 expression. Differentially expressed (DE) genes were identified by a comparative analysis of the RNA-Seq data of p53−/− RPE-1 cells with Tet-On L1 and p53−/− RPE-1 cells with Tet-On Luciferase (Tet-On Luc) under treatment by Doxycycline (N = 3 technical replicates) using a threshold of adjusted P < 0.05. The size of each circle reflects the number of DE genes associated with each process; the color shade reflects the enrichment of DE genes (fold change of gene count) in each process. See also Figure S1C. D. DNA damage in cells after L1 induction reflected in the significant increase of γ-H2Ax foci in cells with L1 induction. Left: Representative images of γ-H2AX foci in cells with L1 expression; Bar scale: 10μm. Right: Quantification of γ-H2AX foci per cell with (n = 2889 cells) and without (n = 2274 cells) L1 expression (N = 2 experiments). P < 0.0001; two-tailed Mann-Whitney U-test. E. L1 induction leads to more frequent micronucleation. Left: an example of micronucleus in a cell after L1 induction (Bar scale: 10μm). Right: Quantification of cells with micronuclei after L1 induction (N = 4 independent experiments; DMSO: 1,820 cells; Dox: 1,223 cells; P = 0.0286; two-tailed Mann-Whitney U-test). F. Reduced clonogenicity of single cells after L1 induction (5-day treatment of Doxycycline) in comparison to control cells (5-daytreatment of DMSO). P < 0.0001; two-tailed Mann-Whitney U-test. See also Figure S1A. G. L1 induction causes large segmental copy-number alterations in both single cells (left) and single-cell derived clones (right).Shown are the percentage of single cells or single-cell derived clones that harbor 1, 2, 3, 4 or ≥ 5 large de novo DNA copy-number alterations assessed from 0.1× whole-genome sequencing data. P = 0.0211 for single cells, P = 0.0011 for single-cell derived clones; Fisher’s exact test. See also Figure S2.
Figure 2 |
Figure 2 |
Landscape of de novo full-length, 5’-truncated, and 5’-inverted insertions identified in the progeny clones of single cells with 5-day Dox-induced L1 expression. A. Number of full-length, 5’-truncated, or 5’-inverted insertions of L1 (upper) or processed pseudogenes (lower) detected in 31 single-cell derived clones. B. Length distribution of the inserted sequences of L1 (upper, n = 99) or pseudogene (lower, n = 235) insertions. The insertion length (excluding the poly-A sequence) is both calculated from breakpoints in the source sequence (L1 or mRNA) and further validated by long reads. C. The total size (y-axis, l1 + l2) and distance between inner breakpoints (x-axis, d) of 5’-inverted insertions. D. Sequence logo plots of the genomic DNA sequence at the 3’-end of insertions (starting site of TPRT) of L1 (upper) and pseudogenes (lower). E. Pseudogene insertions are enriched for highly expressed genes. Shown are the transcripts-per-million (TPM) values of endogenous genes with (black) and without pseudogene insertions. Except for one insertion of PLCL1 with TPM=0.61, all the remaining insertions are derived from endogenous genes with TPM >1. The median TPM value for 198 genes used as source for one or more pseudogene insertions is 127 in comparison to the median TPM of 19 for the remaining 13,821 genes with TPM ≥1. F. Enrichment of pseudogene insertions from source genes with Alu in the 3’-UTR. P = 0.018; χ2 test. G. Length distribution of deleted or duplicated sequences at the target site for different categories of L1 or pseudogene insertions. H. Length distribution of microhomology or untemplated sequences at the 5’-junctions of non-inverted insertions (top two panels) and at the 5’ (middle bottom) and the internal junctions (bottom) of 5’-inverted insertions. The locations of junctions are schematically shown on the left. The percentages of junctions with ≥2bp microhomology, ≥2bp untemplated insertions, and near blunt (otherwise) are shown on the right as piecharts. We use thick arrows to represent the 3’-ends and thin lines to represent the complementary 5’-ends of dsDNA, colored arrows to represent the first cDNA strand and dotted lines to represent the L1/mRNA template/second cDNA strand. These conventions are used throughout the remaining figures.
Figure 3 |
Figure 3 |
Examples of complex insertions indicating template-switching during reverse transcription or annealing/ligation of two DNA ends each having undergone independent reverse transcription. A. Strand coordination between insertions generated by template-switching during RT or from ligation/annealing of two cDNA ends illustrated by a tripartite insertion of the GREM1 cDNA in Dox clone A3. Left: Screenshot of short (top) and long (bottom) reads at the insertion site, showing hallmark features of TPRT including poly-A and target-site duplication in the short reads, and a single insertion in the long reads. Right: (Top) Alignment of the inserted sequence to the source gene (GREM1) reveals three pieces of reverse-transcribed sequences (green, blue, and magenta arrows); (Bottom) arrangement of the three RT sequences at the insertion site determines that the magenta sequence with poly-T is generated by the primary RT extending the DNA end on the forward strand (chr12:63606166); the blue and the green sequences are generated by twin-primed RT extending the DNA end on the reverse strand (chr12:63606150). The parallel orientation between the blue and green insertions indicates a template-switching event during RT, whereas the opposite orientation between the red and blue insertions implies an annealing between ssDNA ends or a ligation between dsDNA ends. Microhomology (–) and untemplated insertions (+) are annotated at each junction by the same convention as in Figure 2H. B. Selected examples of complex insertions containing sequences from more than one source. All three examples display TSDand poly-A features as conventional full-length or truncated insertions. The arrangement of insertions are shown on the left, with the inferred mechanism (template-switching or annealing/end-joining) annotated on the right. The insertions in F7 are completely resolved by long reads; the insertion in C5 is assembled based on junctions detected from short reads. The presence of microhomology (e.g., ‘−2bp’ for two basepair microhomology) or untemplated insertions (‘+5bp’ for an insertion of five base pairs) is annotated at all junctions except the poly-A junctions. See Figure S7 for additional examples. C. Summary of microhomology/untemplated insertions at template-switching or annealing/end-joining junctions.
Figure 4 |
Figure 4 |
Reciprocal translocations between DNA ends generated by L1 retrotransposition. A. A schematic diagram of reciprocal translocations between DNA ends generated by independent retrotranspositions at two different loci. ORF2p generates two DNA ends at each locus: one end resides within an ORF2p EN cutting sequence and is extended by RT, hereafter referred to as the primary RT end; the other end has a partial overlap with the primary RT end and does not undergo RT except with twin priming; we refer to this end as the reciprocal end. Reciprocal translocations arise from a two-by-two exchange between two pairs of RT ends and reciprocal ends, and can generate either two stable chromosomes, or two unstable chromosomes. B. An example of balanced translocations between chr16 and chr17 in the Dox clone C3. Gray and black dots represent normalized DNA copy number (90kb bins) of each parental haplotype, showing no copy-number alteration throughout each chromosome as expected for balanced translocations. Breakpoints at both loci [chr16:89836580(–)/6565(+) and chr17:18595750(–)/5737(+)] display TSD. The primary RT ends give rise to the breakpoints at chr16:89836580(–) and at chr17:18595750(–): both are within sequences suitable for ORF2p EN cutting and are connected with poly-A/T and truncated insertions, reflecting ORF2p mediated TPRT. Although both insertions are retained in one derivative chromosome der(16)t(16;17), we determine that the reciprocal translocation in der(17)t(16;17) is generated when the reciprocal ends are joined together. Therefore, both translocations are the direct outcome of L1 retrotransposition. Note: We have used ‘-’ to denote breakpoints for which the 3’-end is on the forward strand, and ‘+’ for breakpoints for which the 3’-end is on the reverse strand. For junction sequences, we use black, uppercase letters for nucleotides that are retained in the rearrangement junction and gray, lowercase letters for sequences in the reference. C. An example of dicentric chromosome inferred to have been generated by L1-mediated translocation in the Dox clone H8. Shown are the haplotype-specific DNA copy number of the translocated homolog (5B and 18B). The inference of dic(5;18) is based on three pieces of evidence: (1) a single breakpoint on each arm of the translocated chromosome; (2) deletion of sequences telomeric to the breakpoints; and (3) subclonal loss of the dicentric chromosome, including segmental losses between the two centromeres (highlighted in blue), as expected for the chromosome-type breakage-fusion-bridge cycles. Both breakpoints are inferred to have descended from the primary RT ends based on TPRT signatures. D. An example of acentric chromosome inferred to have been generated by L1-mediated translocation in a single cell b1. The inference of an acentric chromosome is based on (1) the structure of the segmental gain (on 7q) and retention (on 15q) based on haplotype-specific DNA copy number (7A and 15B); (2) the presence of intra- and inter-chromosomal rearrangements restricted to these two regions, indicating chromothripsis of an acentric chromosome partitioned in a micronucleus. The origin of the chr15 breakpoint from retrotransposition is directly established by the presence of a truncated pseudogene insertion, the poly-A/T sequence, and the ORF2p EN motif. The presence of two plausible ORF2p EN cutting sites (underlined) near the chr7 breakpoint suggests that this breakpoint could also have descended from a primary RT end that did not undergo RT or had the RT sequence cleaved.
Figure 5 |
Figure 5 |
Segmental copy-number alterations resulting from retrotransposition-induced chromosomal rearrangement. A. Size distribution of sub-megabase segmental deletions and duplications. B. An example of L1-mediated short (27kb) deletion. C. A 64kb tandem duplication with one breakpoint (chr9:100577299) adjacent to two ORF2p EN cutting sites. D-G. Examples of Large segmental CNAs D A 9p-terminal deletion with an L1 insertion junction. The complete junction is undetermined. E. A 13Mb internal deletion on 12p with an insertion of the PLEKHA5 cDNA joining two breakpoints both with adjacent ORF2p EN cutting sequences. F. A junction containing an insertion of the SH3BP cDNA between breakpoints on 12p and 12q that results in a ring chromosome. The inference of a ring chromosome is supported by the subclonal loss of this chromosome (relative to the intact homolog shown in gray), in contrast to the preservation of chromosomes with large internal deletions in B and C. G. A large terminal duplication generated by retrotransposition. Two breakpoints are detected near the duplication boundary: the primary RT end gives rise to the breakpoint at chr16:70511772(+), whereas the reciprocal end gives rise to the breakpoint at chr16:70511780(–). The reciprocal breakpoint is retained in a 12kb DNA sequence that is inserted at the translocation junction between the reverse transcribed L1 and the translocation partner.
Figure 6 |
Figure 6 |
Foldback junctions with retrotransposition insertions. A. Two processes that can generate foldback junctions with insertions of reverse transcribed sequences. Top: In the first row, a DNA end is generated and extended by ORF2p; in the second row, a DNA end generated independent of retrotransposition is extended by ORF2p using the RNA template (wiggly line). In both scenarios, ligation between the extended 3’-DNA end (red solid arrow) and the 5’-end on the complementary strand can be initiated by mRNA tethering or by microhomology-mediated self-annealing. The ssDNA ligation creates a hairpin, which can be converted into a foldback junction by DNA replication. Note that a similar mechanism can produce a foldback junction at the reciprocal DNA end generated by ORF2p. Bottom: A foldback junction with retrotransposition insertions can also arise when two replicated DNA ends are tethered by a RNA (wiggly line) or cDNA (solid lines with arrowheads), with second-strand synthesis completed by ORF2p or DNA polymerases. B. Two examples of foldbacks on chr5q in Dox clone C3 that are related to retrotransposition. On chr5A (copy number shown in red), there is a foldback junction between chr5:147445104(–) and 147438833(–) that contains a full-length insertion of the CHML cDNA (7.7kb). The breakpoint at 147445104 is located in an ORF2p EN cutting site (TTT|cAAA) and extended from the 3’-end of the CHML transcript with poly-A. Although there is no apparent microhomology between 147438833(–) and the 5’-end of the inserted CHML sequence (0bp*), there is a 2bp microhomology (TG) when including the extra ‘G’ base from mRNA capping. On chr5B (copy number shown in blue), there is a foldback junction between chr5:103248389(–) and 103246812(–). Although the junction does not contain any insertion, breakpoint 103248389(–) is located within an ORF2p EN substrate (TTTTTcAAA|gAA) and may have descended from a reciprocal end generated by ORF2p EN. The ancestral DNA end may be near blunt but becomes staggered after 5’-resection; the resected 5’-end produces the breakpoint at 103246812(–) that is then ligated to the breakpoint at 103248389 to create the foldback junction. C. The foldback junction at the end of chr22 in Dox clone A5 clone as shown in Figure 4. The presence of two insertions in the foldback junction is consistent with the model depicted in the last row of panel A and also similar to the complex insertion junction shown in Figure S7A. D. An example of foldback junction at the end of chr1q in Dox clone D4 clone that is inferred to be a downstream consequence of retrotransposition. Although the junction between two breakpoints chr1:208242622(–) and 208240872(–) does not contain any insertion, the identification of two short DNA sequences (chr1:208297605–639 and chr1:208297658–915) at another insertion junction (Figure S10A) indicates an ancestral DNA breakage due to retrotransposition: We infer that these two short DNA fragments originate from ssDNA fragments that are cleaved from a retrotransposition intermediate, which produces two dsDNA ends without any footprint of retrotransposition. One of the dsDNA end subsequently gives rise to the pair of DNA ends in the foldback junction. Notably, both short DNA pieces and the cDNA of a truncated transcript of the SH3BP4 gene are inserted into a complex insertion junction on chr10 containing another truncated pseudogene insertion (DAZAP2); this observation highlights the dynamic interplay between retrotransposition and endogenous DNA repair.
Figure 7 |
Figure 7 |
Chromothripsis and retrotransposition. A. Two mechanisms by which unstable chromosomes generated by translocations can lead to chromothripsis. B. An example of complex rearrangements detected in the GFP+ clone F8. A retrotransposition-mediated translocation leads to the p-terminal deletion, followed by one or multiple BFB cycles, creating complex rearrangements on the 3p arm. The L1-mediated translocation is inferred to be the initiating event of complex rearrangements. C. An example of chromothripsis in the same sample as in B. Two junctions contain L1 insertions. The first on the p-terminus is inferred to have generated reciprocal translocations between chr6B and chr20B. The second junction joins two distal breakpoints on the q-arm [138158835(+) and 155908187(+)]; based on the duplication of the q-terminal segments, we infer the two breakpoints to originate from DNA ends on sister chromatids. We identify a breakpoint [155908198(–)] that descends from the reciprocal end of the RT end [155908187(+)] with a 12bp TSD; the TSD feature suggests that the ORF2p created two DSB ends in this chromatid.
Figure 8 |
Figure 8 |
Summary of insertion and rearrangement outcomes of L1 retrotransposition A. Different processes that can alter dsDNA ends generated by ORF2p. Both the primary RT end and the reciprocal end can undergo 5’-resection (2), ssDNA flap removal (3), or self annealing. Replication through a hairpin formed by self-annealing can generate foldback junctions (4 on the right). The 3’-flap of the reciprocal end can be inverted (4 on the left). The reciprocal end can undergo twin-primed RT (5 on the left); the primary RT end can undergo template switching RT (5 on the right). B. Insertion or rearrangement outcomes from different combinations of dsDNA ends joined together. Insertion outcomes are generated by ligation between the primary RT end and the reciprocal end with one or multiple sequence insertions including RT. Translocation outcomes are generated by illegitimate recombination between dsDNA ends from distal loci. Foldbacks arise from the replication/fusion of unligated dsDNA ends. Examples or data related to different types of insertion/rearrangement outcomes and the implicated mechanisms of DNA end-joining are listed.

References

    1. Burns K. H., Repetitive DNA in disease. Science (New York, N.Y.) 376, 353–354 (2022). - PubMed
    1. Lander E. S. et al., Initial sequencing and analysis of the human genome. Nature 409, 860–921 (2001). - PubMed
    1. Holmes S. E., Singer M. F., Swergold G. D., Studies on p40, the leucine zipper motif-containing protein encoded by the first open reading frame of an active human LINE-1 transposable element. J Biol Chem 267, 19765–19768 (1992). - PubMed
    1. Khazina E. et al., Trimeric structure and flexibility of the L1ORF1 protein in human L1 retrotransposition. Nature structural & molecular biology 18, 1006–1014 (2011). - PubMed
    1. Weichenrieder O., Repanas K., Perrakis A., Crystal structure of the targeting endonuclease of the human LINE-1 retrotransposon. Structure 12, 975–986 (2004). - PubMed

Publication types

LinkOut - more resources