[Preprint]. 2024 Dec 20:2024.12.11.627977.
doi: 10.1101/2024.12.11.627977.

Dynamic Changes in Gene Expression Through Aging in Drosophila melanogaster Heads

Affiliations

Dynamic Changes in Gene Expression Through Aging in Drosophila melanogaster Heads

Katherine M Hanson et al. bioRxiv. .

Update in

Abstract

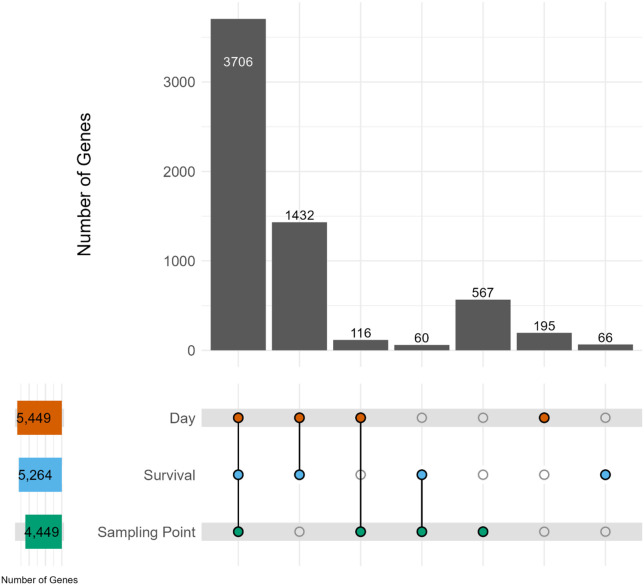
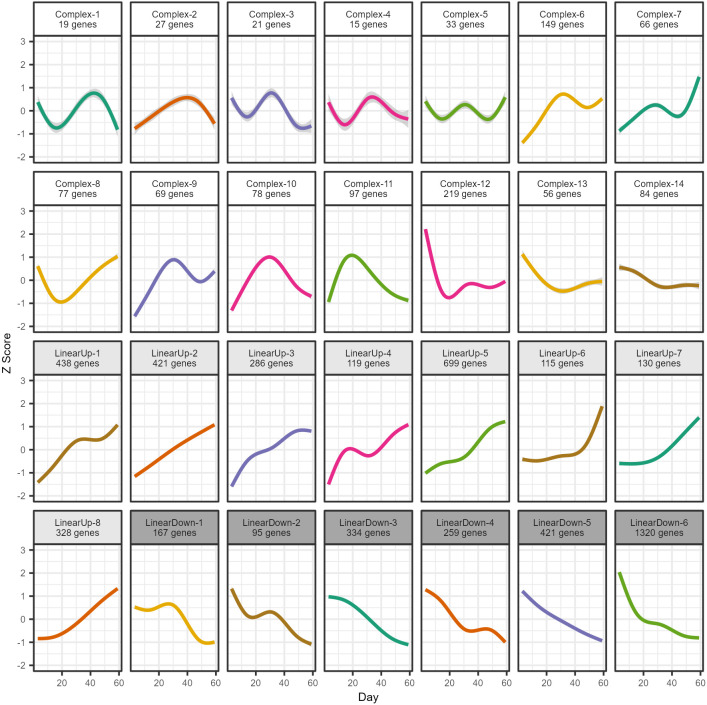
Work in many systems has shown large-scale changes in gene expression during aging. However, many studies employ just two, arbitrarily-chosen timepoints at which to measure expression, and can only observe an increase or a decrease in expression between "young" and "old" animals, failing to capture any dynamic, non-linear changes that occur throughout the aging process. We used RNA sequencing to measure expression in male head tissue at 15 timepoints through the lifespan of an inbred Drosophila melanogaster strain. We detected >6,000 significant, age-related genes, nearly all of which have been seen in previous fly aging expression studies, and which include several known to harbor lifespan-altering mutations. We grouped our gene set into 28 clusters via their temporal expression change, observing a diversity of trajectories; some clusters show a linear change over time, while others show more complex, non-linear patterns. Notably, re-analysis of our dataset comparing the earliest and latest timepoints - mimicking a two-timepoint design - revealed fewer differentially-expressed genes (around 4,500). Additionally, those genes exhibiting complex expression trajectories in our multi-timepoint analysis were most impacted in this re-analysis; Their identification, and the inferred change in gene expression with age, was often dependent on the timepoints chosen. Informed by our trajectory-based clusters, we executed a series of gene enrichment analyses, identifying enriched functions/pathways in all clusters, including the commonly seen increase in stress- and immune-related gene expression with age. Finally, we developed a pair of accessible shiny apps to enable exploration of our differential expression and gene enrichment results.

Keywords: Gene expression; aging; gene ontology enrichment; lifespan.


Figures

Figure 1:
Figure 1:. Identification of 6,142 genes with age-related gene expression.
We identified genes whose expression was significantly associated with Day of life (N=5,449), with Survival (N=5,264), and with Sampling point (N=4,449). The upper bar chart shows the number of significant genes identified, with colored circles below showing which analysis the genes were identified in (3706 genes were identified in all three analyses, 1432 genes were identified in both the Day and Survival analyses, and so on).
Figure 2:
Figure 2:. Clustering all 6,142 age-related genes into 28 clusters via their expression trajectories through lifespan.
A simplified dendrogram representing the hierarchical clustering of our gene expression trajectory data. Each horizontal colored line represents all those genes in each of our 28 clusters; The closer clusters are to each other on the plot, the more similar their expression trajectories (see Figure 3). Each cluster is named based on their expression trajectory (LinearUp, LinearDown, Complex). Complex-1 to Complex-5 clusters are not individually labeled since they are very close together in the plot. Supplementary Figure 4 shows the full dendrogram highlighting the relationships among all 6,142 genes.
Figure 3:
Figure 3:. Representative expression trajectories for all 28 clusters.
Within a cluster we calculated the average z-score over genes for each timepoint, and present a smoothed curve through those points highlighting the cluster-specific changes in gene expression over time. We determined whether each cluster-specific set of mean z-scores was statistically associated with age, and used this information to designate each cluster as LinearUp or LinearDown (we found a significant association, and expression either increases or decreases over time), or as Complex (there was no significant association between expression and age). This led to 14 Complex, 8 LinearUp, and 6 LinearDown clusters.
Figure 4:
Figure 4:. Differences between a multi-timepoint and a two-timepoint analysis:
Our 3 trajectory-based analyses revealed > 6,000 differentially-expressed genes that were grouped into 3 trajectories (Complex, LinearDown, LinearUp). We compared these results to a re-analysis of a subset of the same data, where we directly contrasted expression between young (Day 3+6) and old (Day 59) samples. Each vertical bar depicts the fraction (in the figure) and the number (y-axis) of genes in each of our expression trajectories that are absent in the young versus old test (gray), are significantly up-regulated in old animals (blue) or are significantly down-regulated in old animals (red). Most genes with linear trajectories are re-identified, and ~99% of those show the expected direction of change with age. However, only ~50% of the Complex trajectory genes are re-identified in the two-timepoint analysis, and these are split between those that appear to increase or to decrease in expression with age.

References

    1. Alic Nazif, Giannakou Maria E., Papatheodorou Irene, Hoddinott Matthew P., Andrews T. Daniel, Bolukbasi Ekin, and Partridge Linda. 2014. “Interplay of DFOXO and Two ETS-Family Transcription Factors Determines Lifespan in Drosophila Melanogaster.” PLOS Genetics 10 (9): e1004619. 10.1371/journal.pgen.1004619. - DOI - PMC - PubMed
    1. Bajgiran Morteza, Azlan Azali, Shamsuddin Shaharum, Azzam Ghows, and Halim Mardani Abdul. 2021. “Data on RNA-Seq Analysis of Drosophila Melanogaster during Ageing.” Data in Brief 38 (October):107413. 10.1016/j.dib.2021.107413. - DOI - PMC - PubMed
    1. Bordet Guillaume, Lodhi Niraj, Kossenkov Andrew, and Tulin Alexei. 2021. “Age-Related Changes of Gene Expression Profiles in Drosophila.” Genes 12 (12): 1982. 10.3390/genes12121982. - DOI - PMC - PubMed
    1. Broer Linda, Buchman Aron S., Deelen Joris, Evans Daniel S., Faul Jessica D., Lunetta Kathryn L., Sebastiani Paola, et al. 2015. “GWAS of Longevity in CHARGE Consortium Confirms APOE and FOXO3 Candidacy.” The Journals of Gerontology Series A: Biological Sciences and Medical Sciences 70 (1): 110–18. 10.1093/gerona/glu166. - DOI - PMC - PubMed
    1. Cai Nanshuo, Wu Yifan, and Huang Yan. 2022. “Induction of Accelerated Aging in a Mouse Model.” Cells 11 (9): 1418. 10.3390/cells11091418. - DOI - PMC - PubMed

Publication types

LinkOut - more resources