[Preprint]. 2024 Dec 22:2024.12.20.629650.
doi: 10.1101/2024.12.20.629650.

Same-Slide Spatial Multi-Omics Integration Reveals Tumor Virus-Linked Spatial Reorganization of the Tumor Microenvironment

Affiliations

Same-Slide Spatial Multi-Omics Integration Reveals Tumor Virus-Linked Spatial Reorganization of the Tumor Microenvironment

Yao Yu Yeo et al. bioRxiv. .

Abstract

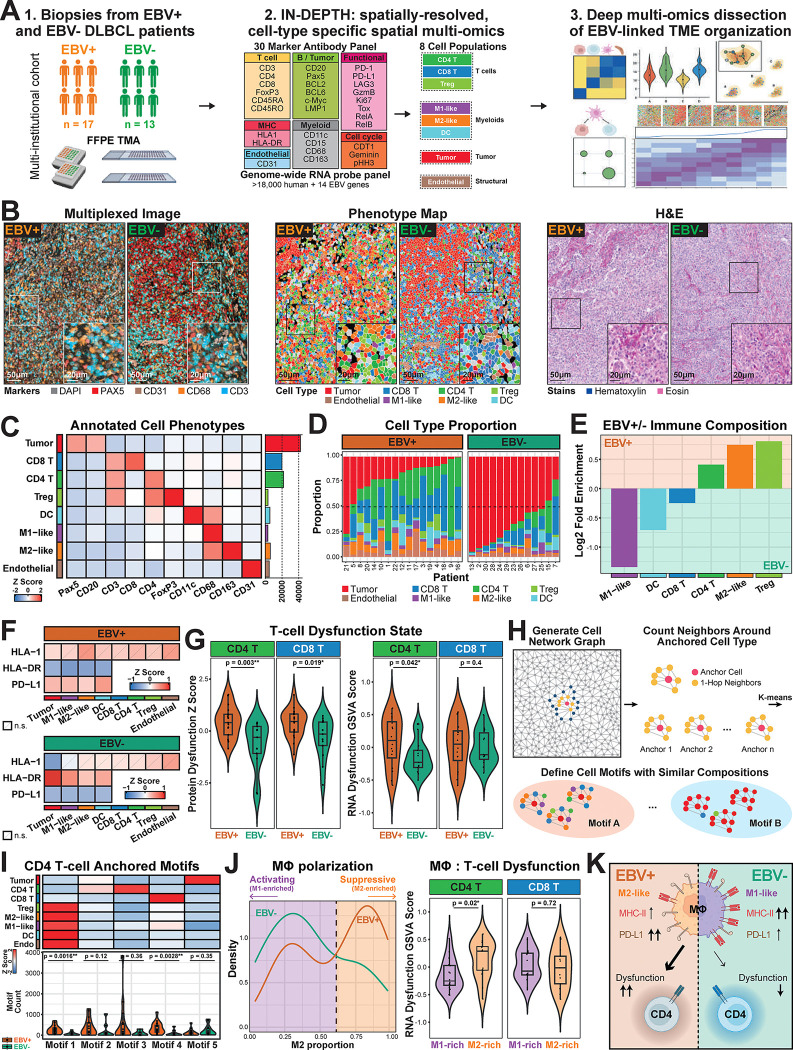
The advent of spatial transcriptomics and spatial proteomics have enabled profound insights into tissue organization to provide systems-level understanding of diseases. Both technologies currently remain largely independent, and emerging same slide spatial multi-omics approaches are generally limited in plex, spatial resolution, and analytical approaches. We introduce IN-situ DEtailed Phenotyping To High-resolution transcriptomics (IN-DEPTH), a streamlined and resource-effective approach compatible with various spatial platforms. This iterative approach first entails single-cell spatial proteomics and rapid analysis to guide subsequent spatial transcriptomics capture on the same slide without loss in RNA signal. To enable multi-modal insights not possible with current approaches, we introduce k-bandlimited Spectral Graph Cross-Correlation (SGCC) for integrative spatial multi-omics analysis. Application of IN-DEPTH and SGCC on lymphoid tissues demonstrated precise single-cell phenotyping and cell-type specific transcriptome capture, and accurately resolved the local and global transcriptome changes associated with the cellular organization of germinal centers. We then implemented IN-DEPTH and SGCC to dissect the tumor microenvironment (TME) of Epstein-Barr Virus (EBV)-positive and EBV-negative diffuse large B-cell lymphoma (DLBCL). Our results identified a key tumor-macrophage-CD4 T-cell immunomodulatory axis differently regulated between EBV-positive and EBV-negative DLBCL, and its central role in coordinating immune dysfunction and suppression. IN-DEPTH enables scalable, resource-efficient, and comprehensive spatial multi-omics dissection of tissues to advance clinically relevant discoveries.

Keywords: Bioinformatics; Computational Biology; DLBCL; EBV; Graph Signal Processing; Spatial Multi-Omics; Spatial Proteomics; Spatial Transcriptomics; Systems Immunology; Tumor Microenvironment; Tumor Virus.


Conflict of interest statement

CONFLICT OF INTERESTS S.J. is a co-founder of Elucidate Bio Inc, has received speaking honorariums from Cell Signaling Technology, and has received research support from Roche and Sanofi unrelated to this w ork. S.J.R. has received research support from Affimed, Merck, and Bristol-Myers Squibb (BMS), is on the Scientific Advisory Board for Immunitas Therapeutics, and also a part of the BMS International Immuno-Oncology Network (II-ON) unrelated to this work. F.S.H. has leadership roles at Bicara Therapeutics, stock and ownership interests in Apricity Health, Torque, Pionyr, and Bicara Therapeutics, and has served as a consultant or advisor for Merck, Novartis, Genentech/Roche, BMS, Compass Therapeutics, Rheos Medicines, Checkpoint Therapeutics, Bioentre, Gossamer Bio, Iovance Biotherapeutics, Catalym, Immunocore, Kairos Therapeutics, Zumutor Biologics, Corner Therapeutics, AstraZeneca, Curis, Pliant, Solu Therapeutics, Vir Biotechnology, and 92Bio, has received travel or expenses from Novartis and BMS, and holds several patents related to methods for treating MICA-related disorders, tumor antigens, immune checkpoint targets, and therapeutic peptides unrelated to this work. S.Sig. reports receiving commercial research grants from Bristol-Myers Squibb, AstraZeneca, Exelixis and Novartis. VAB has patents on the PD-1 pathway licensed by Bristol-Myers Squibb, Roche, Merck, EMD-Serono, Boehringer Ingelheim, AstraZeneca, Novartis and Dako unrelated to this work. A.K.S. reports compensation for consulting and/or scientific advisory board membership from Honeycomb Biotechnologies, Cellarity, Ochre Bio, Relation Therapeutics, Fog Pharma, Passkey Therapeutics, IntrECate Biotherapeutics, Bio-Rad Laboratories, and Dahlia Biosciences unrelated to this work. The other authors declare no competing interests.

Figures

Figure 1:
Figure 1:. IN-DEPTH combines spatial proteomics and transcriptomics on the same slide without loss of protein or RNA quality.
(A) Schematic overview of IN-DEPTH, where spatial proteomics was used to guide cell-type specific genome-wide transcriptomic capture on the same slide. (B) Experimental outline to assess the effects of spatial proteomics workflow on RNA capture, with an adjacent tissue section without spatial proteomics as a control. (C) Assessment of tissue imaging and RNA capture quality after IN-DEPTH. Each row represents a different combination of spatial platforms evaluated for IN-DEPTH and the corresponding tissue type used, and each column represents key experimental variables or data output presented in systematic order from left to right. The breakdown for individual profiled ROIs and negative control probes are in Supp Figs. 1C & D. All tissues were subjected to H&E staining at the end of each assay (see Materials and Methods).
Figure 2:
Figure 2:. IN-DEPTH enables reproducible and systematic characterization of tonsillar tissue architecture through integrated spatial proteomics and transcriptomics.
(A) Schematic workflow of IN-DEPTH, illustrating the 12-marker antibody imaging, cell segmentation and phenotyping, cross platform tissue image registration, and targeted RNA capture from identified cell populations on the same slide. (B) Visualization of key cellular features in tonsillar tissues using CODEX multiplexed imaging (left) showing T cells (CD3), B cells (CD20 and BCL6), and endothelial cells (CD31), with the corresponding cell phenotype map (middle) and H&E image (right) as part of the IN-DEPTH workflow. (C) Cell type-specific protein expression levels (left), gene signatures (middle), and cell counts (right) for the annotated cell types. Data shown is generated from two technical replicates. (D) Systematic evaluation of four computational deconvolution algorithms using IN-DEPTH data as the ground truth reference. (E) Spatial multi-modal analysistion of Tfh cells showing their distribution relative to B cell follicles (top schematic) and quantitative validation through differential Tfh gene signature enrichment between follicle-high and follicle-low regions (bottom left, 6 ROIs chosen each), and correlation with B cell density (bottom right). A two-sided Wilcoxon rank sum test was performed, with the null hypothesis that there is no difference in the Tfh signature between follicle-low and follicle-high regions (bottom left), and a Spearman’s correlation was used for the correlation test (bottom right). (F) Top cell type-specific gene expression programs identified, and their relative enrichment across the 12 annotated cell populations.
Figure 3.
Figure 3.. SGCC reveals coordinated spatial transitions in cellular states and tissue architecture.
(A) Schematic overview of the SGCC methodology showing: I) Pattern binning of single-cells in spatial proteomics data, followed by II) Pattern encoding through GFT to generate low-frequency FCs, and III) Cross-correlation analysis to identified coordinated spatial patterns for downstream integration with transcriptomics. (B) Integration framework for identifying genes covarying with spatial pattern across the tissue, linking spatial factors to gene expressionfor functional analysis. (C) Systematic validation of SGCC using 80 simulated spatial patterns to demonstrate the ability to detect transitions from global to local complement states. (D) Quantification of pattern relationships through SGCC scores. (E) Analysis of CD4 T cell and BCL6-positive B cells via IN-DEPTH proteomics and transcriptomics analysis, showing SGCC scores and their associated spatial distribution of cells in bins (top), changes in macrophage polarization states (M1/M2-like proportion), and coordinated gene expression programs reflecting intrinsic cell programs and T-B cell crosstalk (bottom). The full gene pathway names can be found in Supp Table 2. (F) A schematic illustrating tissue-level organization derived from SGCC analysis depicting the transitions in T-B cell interactions across the dark zone (DZ) and light zone (LZ).
Figure 4.
Figure 4.. Iterative spatial multi-omics dissection of EBV-positive and EBV-negative DLBCL via IN-DEPTH reveals a macrophage-linked CD4 T cell dysfunction interaction axis.
(A) IN-DEPTH workflow on EBV-positive (n=17) and EBV-negative (n=13) DLBCL biopsy samples, using a 30-marker antibody panel and a genome-wide RNA probe panel spiked in with custom-designed probes targeting 14 EBV genes. (B) Representative CODEX multiplexed images (left) with markers for nuclei (DAPI), B/tumor cells (Pax5), endothelial cells (CD31), macrophages (CD68), and T cells (CD3) shown, as well as the corresponding phenotype maps (middle), and H&E images (right) of EBV-positive and EBV-negative DLBCL tissues. Phenotype maps for each tissue sample core are in Supp Fig. 5. (C) Relative protein expression levels (left) and cell counts (right) for the annotated cell types from this DLBCL cohort. (D) Relative proportions of annotated cell types across EBV-positive and EBV-negative (left) tissues. (E) Log2 fold enrichment plot of immune cell proportions between EBV-positive and EBV-negative DLBCL tissues in this patient cohort. (F) Relative protein expression of MHC Class I (HLA1), MHC Class II (HLA-DR), and PD-L1, on the corresponding cell types that express these molecules across EBV-positive (top) and EBV-negative (bottom) DLBCL tissues in this patient cohort. (G) Left: Comparison of CD4 and CD8 T cell dysfunction scores calculated based on protein markers between EBV-positive and EBV-negative DLBCL tissues. Right: Comparison of CD4 and CD8 T cell dysfunction scores calculated based on GSVA scoring of RNA signatures EBV-positive and EBV-negative DLBCL tissues. A one-sided Wilcoxon rank sum test were performed, with the alternative hypothesis that the T cell dysfunction signature was greater in the EBV-positive tissues. The protein markers and RNA signatures were curated using a panel of T cell exhaustion checkpoint markers and genes (see Materials and Methods). (H) Schematic representation of identifying different cellular motifs through n-hop neighborhood analysis anchored on a cell type of interest. (I) Top: Cell type enrichment from each identified cellular motif, with CD4 T cells set as the anchor cell. Bottom: Comparison of motif abundance between EBV-positive and EBV-negative DLBCL. A two-sided Wilcoxon rank sum test was performed, with the null hypothesis that there is no difference between motif abundance in EBV-positive and EBV-negative tissues. (J) Left: Distribution of the density of M2-like macrophages between EBV-positive and EBV-negative DLBCL tissues in this patient cohort, with the dotted line indicating the cutoff for stratifying M1-rich and M2-rich samples. Right: Comparison of RNA GSVA score of CD4 and CD8 T cell dysfunction between M1-rich and M2-rich populations. A one-sided Wilcoxon rank sum test was performed, with the alternative hypothesis that the T cell dysfunction signature was greater in the EBV-positive tissues. (K) Cartoon model depicting key differences in macrophage and CD4 T cell dysfunction states between EBV-positive and EBV-negative DLBCL.
Figure 5.
Figure 5.. SGCC reveals coordinated spatial multi-modal interactions and EBV-linked cell states in the tumor-macrophage-CD4 T cell axis.
(A) Analysis of tumor-macrophage spatial relationships. Top: SGCC-ranked spatial distributions and representative images. Middle: EBV transcript levels, LMP1+ tumor cells, and tumor-associated signaling pathways across SGCC scores. Bottom: Changes in macrophage M1/M2 polarization states and associated pathway signatures with increasing SGCC scores. (B) Analysis of macrophage-CD4 T cell interactions. Top: SGCC-ranked spatial distributions and representative images. Middle: Changes in PD-L1 and HLA-DR expression of macrophage and antigen presentation pathways across SGCC scores. Bottom: Changes in T cell dysfunction signatures and immune activation pathways across SGCC scores. The full gene pathway names for (A) and (B) are in Supp Table 2. (C) Ternary plot depicting a three-way SGCC relationship between CD4 T cells and tumor (top vertex), CD4 T cells and macrophages (bottom left vertex), and macrophages and tumor (bottom right vertex). Points located near the vertices indicate colocalization between two specific cell types while forming a complementary structure with the third cell type (e.g. the ROI from Rochester 4 at the left bottom end of the triangle demonstrates colocalization between CD4 T cells and macrophages while complementing the tumor). In contrast, points near the center of the triangle may signify colocalization among all three cell types. (D) Ternary plots across the tumor-macrophage-CD4 T cell axis colored by their expression of key immune dysfunction features (top two rows) or adjacency enrichment statistic (AES) (bottom row). (E) Validation in an independent cohort using CosMx. Top: Study design with EBV-positive (n=8) and EBV-negative (n=10) DLBCL biopsy samples using a 6k-plex panel. Bottom left: Representative phenotype map of one EBV-positive and one EBV-negative FOV, showing the spatial organization of annotated tumor (red), macrophage (purple), and T cell populations (green). Bottom middle: Re-visualizing the same phenotype map to emphasize T cell dysfunction GSVA score on T cells. Bottom right: Comparison of T cell dysfunction GSVA scores between EBV-positive and EBV-negative tissues from this cohort. A two-sided Wilcoxon rank sum test was performed, with the null hypothesis that there is no difference in T cell dysfunction score between EBV-positive and EBV-negative tissues. (F) Cartoon model depicting contrasting immune state differences in the tumor-macrophage-CD4 T cell interaction axis between EBV-positive (more immunosuppressive) and EBV-negative (less immunosuppresive) DLBCL TMEs.

References

    1. Marx Vivien. Method of the year: spatially resolved transcriptomics. Nature methods, 18 (1):9–14, 2021. - PubMed
    1. Nature Methods. Method of the year 2024: spatial proteomics. nature methods, 21:2195–2196, 2024. - PubMed
    1. Vandereyken Katy, Sifrim Alejandro, Thienpont Bernard, and Voet Thierry. Methods and applications for single-cell and spatial multi-omics. Nature Reviews Genetics, 24(8):494–515, 2023. - PMC - PubMed
    1. Bodenmiller Bernd. Highly multiplexed imaging in the omics era: understanding tissue structures in health and disease. Nature Methods, 21(12):2209–2211, 2024. - PubMed
    1. Abreu Raquel de Sousa, Penalva Luiz O, Marcotte Edward M, and Vogel Christine. Global signatures of protein and mrna expression levels. Molecular BioSystems, 5(12):1512–1526, 2009. - PMC - PubMed

Publication types