[Preprint]. 2024 Dec 23:rs.3.rs-5671748.
doi: 10.21203/rs.3.rs-5671748/v1.

Unsupervised multi-scale clustering of single-cell transcriptomes to identify hierarchical structures of cell subtypes

Affiliations

Unsupervised multi-scale clustering of single-cell transcriptomes to identify hierarchical structures of cell subtypes

Won-Min Song et al. Res Sq. .

Abstract

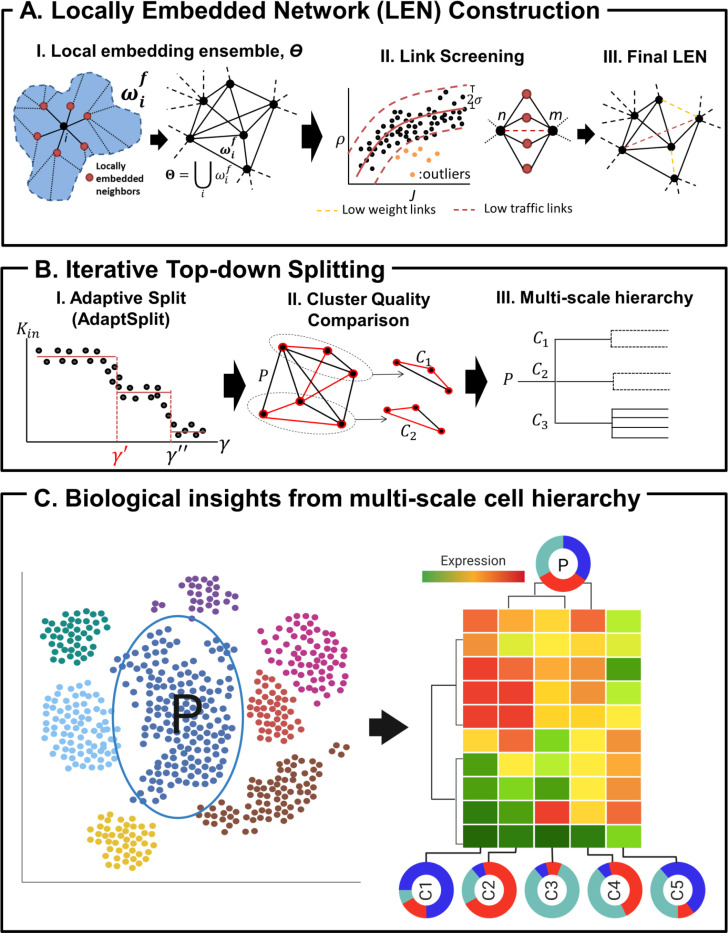
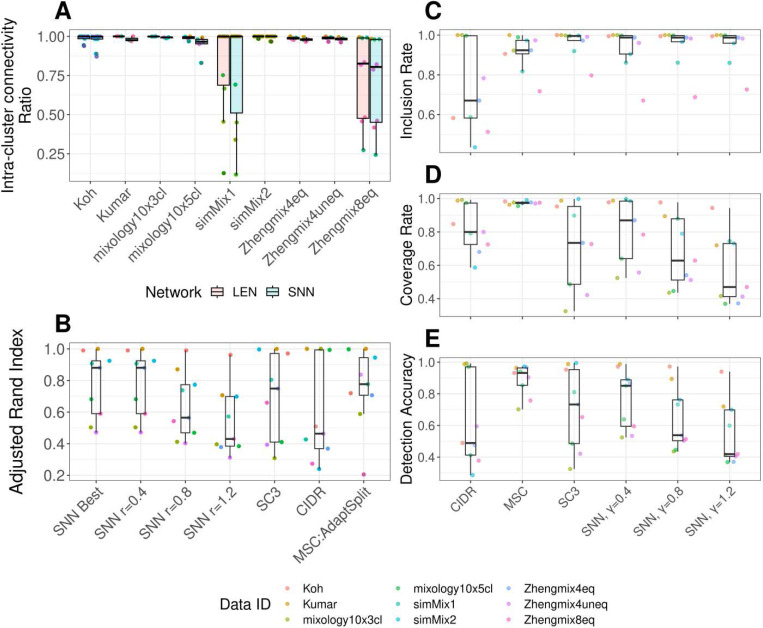
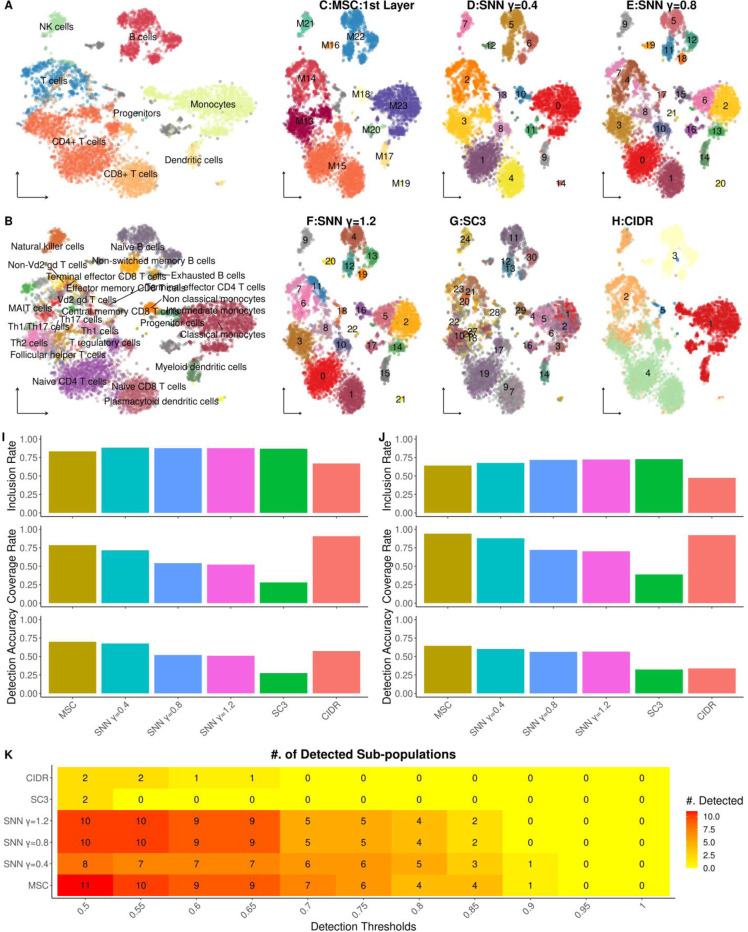
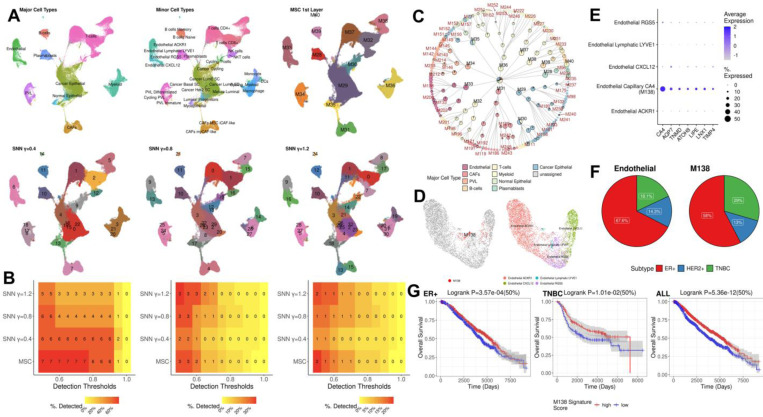
Cell clustering is an essential step in uncovering cellular architectures in single cell RNA-sequencing (scRNA-seq) data. However, the existing cell clustering approaches are not well designed to dissect complex structures of cellular landscapes at a finer resolution. Here, we develop a multi-scale clustering (MSC) approach to construct sparse cell-cell correlation network for identifying de novo cell types and subtypes at multiscale resolution in an unsupervised manner. Based upon simulated, silver and gold standard data as well as real scRNA-seq data in diseases, MSC showed much improved performance in comparison to established benchmark methods, and identified biologically meaningful cell hierarchy to facilitate the discovery of novel disease associated cell subtypes and mechanisms.

Keywords: bioinformatics; multi-scale clustering; scRNA-seq; similarity network.


Conflict of interest statement

Competing interests The authors declare that they have no competing interests. Additional Declarations: No competing interests reported.

Figures

Figure 1.
Figure 1.. MSC workflow.
A. Locally embedded network (LEN) construction. (I). Cell-wise local embedding, ωif (left), is combined into the ensemble, ϴ(right). (II). Low quality cell links are screened as outliers (marked orange, left) in the curve of cell-cell correlation coefficient (ρ) vs mutually shared gene expressions by Jaccard index (J), and redundant links with no improvements in mutual neighbor ratio, Mnm, after link removal (marked brown, right). The filtered links (marked in brown and orange) are discarded to obtain the final LEN. B Iterative top-down splitting. (I) For each split, the clustering resolution parameter, γ, is tuned to detect the first break point, γ(marked red), in γ vs Kin curve. (II). The parent cluster (P) is compared to its child clusters (C1 & C2) by cluster compactness and intra-cluster connectivity improvements. (III) Upon termination, MSC yields a multi-scale cluster hierarchy of parents and its more compact child clusters. C. Identification of multi-scale cell subsets and cluster markers by MSC. Conditioned on each parent cluster (P, marked in the schematic tSNE plot on the left), the child clusters (C1, C2,…,C5) are compared amongst them to evaluate heterogeneous cell group compositions (marked by schematic pie charts) and marker genes with distinct expressions in each child cluster (illustrated by the schematic heatmap).
Figure 2.
Figure 2.. Performance evaluation of single-cell clustering methods on simulated data by multivariate Gaussian generators with various clustering structures in the correlation matrices.
A-C. Heatmaps of A. single-layer clustering structure with intra-cluster correlation, ρin. B. Hierarchical clustering structures with two-layers (L1: the inner layer, L2: the outer layer) whose intra-cluster correlations differ by ∆ρ and regular cluster sizes and, C. Hierarchical clustering structures with two-layers and irregular cluster sizes.D-F. Performances on detecting single-layer clustering structure with irregular sizes (scenario I). The evaluation metrics are inclusion rate (D), coverage rate (E) and detection accuracy (F). G-I. Performances on detecting regular sized clusters embedded in two-layer hierarchy (G: Inclusion Rate, H: Coverage rate, I: Detection accuracy). L1 is the inner-layer cluster with higher intra-cluster correlation than L2, and L2 is the outer-layer cluster with a lower intra-cluster correlation. The intra-correlation difference between L1 and L2 is at Δρ=0.125. G-I. Performances on detecting irregular sized clusters embedded in two-layer hierarchy (J: Inclusion Rate, K: Coverage rate, L: Detection accuracy). The intra-correlation difference between L1 and L2 is at Δρ=0.125.
Figure 3.
Figure 3.. Evaluation of clustering performances in golden-standard data sets.
A, B. Evaluations of AdaptSplit and other single-cell clustering methods on gold standard data sets with ground-truth clusters by adjusted Rand Index (ARI, y-axis). ARI scores are shown per data set (A) and per method (B). C-E. Inclusion rate (C), Coverage rate (D) and Detection rate (E) of golden standard clusters (y-axis) by different methods (x-axis). Each dot is a ground-truth cluster, different colors remark different data sets.
Figure 4.
Figure 4.. Analysis of scRNA-seq of 8k PBMC cells from healthy human donor.
A. tSNE plot showing major immune cell types: Different colors represent broad immune cell types, and are labeled respectively. B. tSNE plot showing the immune subsets: The immune subsets are annotated into different colors with respective labels. C-H. Clustering results from various methods: Including AdaptSplit results from MSC (C), the clustering results are shown as different colors per panel. I. Detection of major immune cell types, evaluated by inclusion rate (Top), coverage rate (middle) and detection accuracy (bottom). J. Detection of immune cell subtypes, evaluated by inclusion rate (Top), coverage rate (middle) and detection accuracy (bottom). K. Number of detected immune subsets by different methods (y-axis) and detection accuracy threaholds (x-axis).
Figure 5.
Figure 5.. Application of MSC to scRNA-seq of PBMC from influenza infected, COVID-19 infected and healthy control samples.
A, B. UMAP plots showing the first split clusters by MSC (in A) and inferred cell types (in B). The cell type colors are specified in the legend in C. C, D. MSC cluster hierarchy plots: Each node shows inferred cell type composition (in C) or sample compositions (in D). E. Performance evaluation of MSC and SNN-based clustering at different resolutions. Top: Inclusion rate, Middle: Coverage rate, Bottom: Detection accuracy. F-J. Sunburst plots showing MSC cluster branches enriched for asymptomatic COVID-19 patients (in F), healthy controls (in G), influenza patients (in H), mild COVID-19 patients (in I) and severe COVID-19 patients (in J)
Figure 6.
Figure 6.. Unsupervised multi-scale clustering of breast cancer single-cell transcriptome atlas from Wu et al. 2021[35].
A. UMAP plots to show major cell types (top left), minor cell types (top middle), first layer clustering by MSC (top right), SNN-based Louvain clustering at γ=0.4 (bottom left), 0.8 (bottom middle) and 1.2 (bottom right). B. Number of detected cell types at different resolutions (left: major cell types, middle: minor cell types, right: cell subsets by supervised subclustering) by unsupervised clustering approaches (y-axis) at different detection accuracy thresholds (x-axis). C. Hierarchy of cell clusters and subsets identified by MSC. Each piechart shows major cell type composition of individual cluster, as annotated by Wu et al. 2021, and the central piechart summarizes the overall major cell type composition in the whole data set. MSC-unique clusters showing Jaccard Index < 10% with the annotated cell types and subsets, and clusters by SNN-based Louvain clustering at different resolutions are labeled with red. D. MSC identifies M138 as a unique endothelial subset (UMAP on left), compared to the annotated subsets by Wu et al. 2021 (UMAP on right). E. Dotplot of M138-specific marker genes in endothelial cells. F. Composition of breast cancer subtypes by ER, Her2 or triple-negative breast cancer (TNBC) status in the whole endothelial cells (left) and M138 (right). G. Kaplan-Meier plots of METABRIC breast cancer patients of different subtypes (left: ER+, middle: TNBC, right: the whole METABRIC cohort) stratified by the median ssGSEA score of M138-specific markers in individual transcriptome samples.

Similar articles

References

    1. Lee JS, Park S, Jeong HW, Ahn JY, Choi SJ, Lee H, Choi B, Nam SK, Sa M, Kwon JS, et al.: Immunophenotyping of COVID-19 and influenza highlights the role of type I interferons in development of severe COVID-19. Sci Immunol 2020, 5. - PMC - PubMed
    1. Masuda T, Sankowski R, Staszewski O, Bottcher C, Amann L, Sagar, Scheiwe C, Nessler S, Kunz P, van Loo G, et al.: Spatial and temporal heterogeneity of mouse and human microglia at single-cell resolution. Nature 2019, 566:388–392. - PubMed
    1. Keren-Shaul H, Spinrad A, Weiner A, Matcovitch-Natan O, Dvir-Szternfeld R, Ulland TK, David E, Baruch K, Lara-Astaiso D, Toth B, et al.: A Unique Microglia Type Associated with Restricting Development of Alzheimer’s Disease. Cell 2017, 169:1276–1290 e1217. - PubMed
    1. Jerby-Arnon L, Shah P, Cuoco MS, Rodman C, Su MJ, Melms JC, Leeson R, Kanodia A, Mei S, Lin JR, et al.: A Cancer Cell Program Promotes T Cell Exclusion and Resistance to Checkpoint Blockade. Cell 2018, 175:984–997 e924. - PMC - PubMed
    1. Andrews TS, Hemberg M: Identifying cell populations with scRNASeq. Mol Aspects Med 2018, 59:114–122. - PubMed

Publication types

LinkOut - more resources