[Preprint]. 2024 Dec 16:rs.3.rs-5125876.
doi: 10.21203/rs.3.rs-5125876/v1.

Mediator kinase inhibition drives myometrial stem cell differentiation and the uterine fibroid phenotype through super-enhancer reprogramming

Affiliations

Mediator kinase inhibition drives myometrial stem cell differentiation and the uterine fibroid phenotype through super-enhancer reprogramming

Subash Khadka et al. Res Sq. .

Update in

Abstract

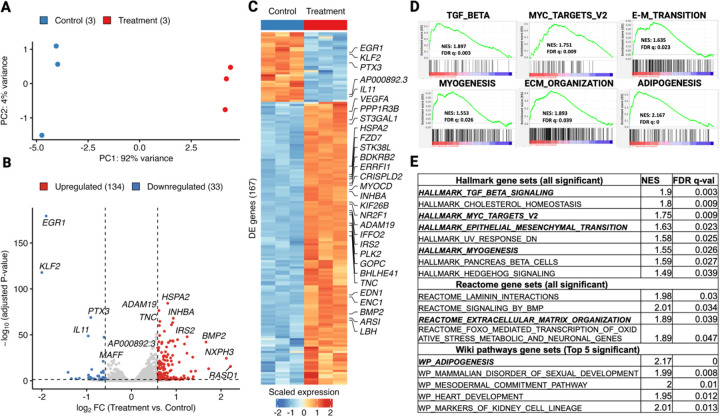
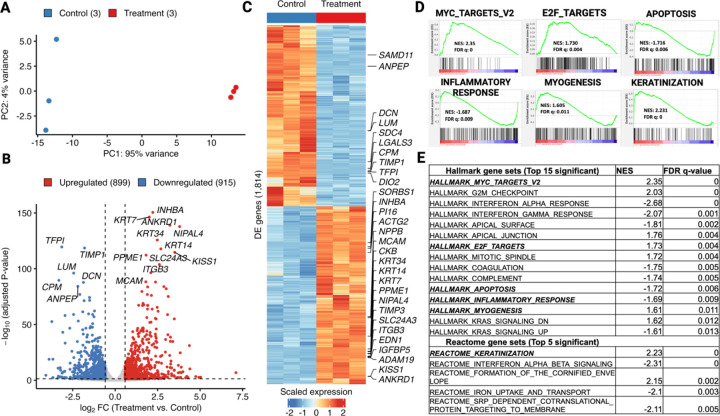
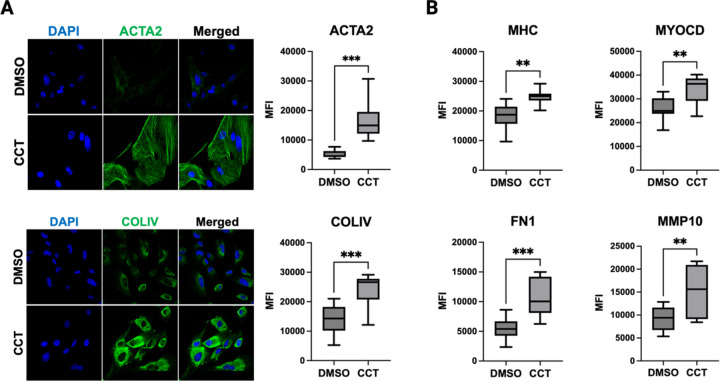
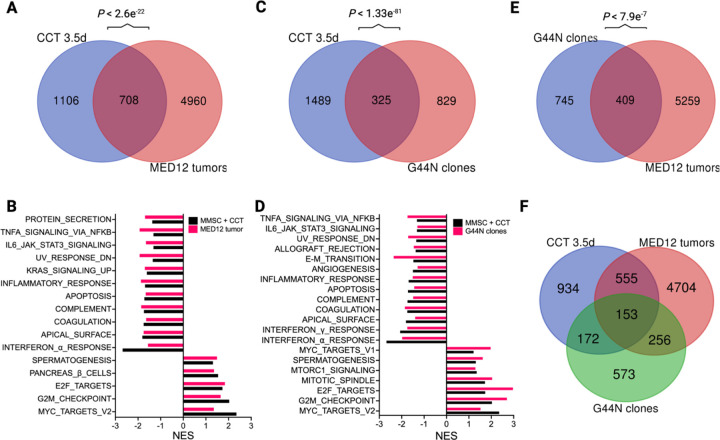
Uterine fibroids (UFs) are the most common non-cutaneous tumors in women worldwide. UFs arise from genetic alterations in myometrial stem cells (MM SCs) that trigger their transformation into tumor initiating cells (UF SCs). Mutations in the RNA polymerase II Mediator subunit MED12 are dominant drivers of UFs, accounting for 70% of these clinically significant lesions. Biochemically, UF driver mutations in MED12 disrupt CDK8/19 kinase activity in Mediator, but how Mediator kinase disruption triggers MM SC transformation remains unknown. Here, we show that pharmacologic inhibition of CDK8/19 in MM SCs removes a barrier to myogenic differentiation down an altered pathway characterized by molecular phenotypes characteristic of UFs, including oncogenic growth and extracellular matrix (ECM) production. These perturbations appear to be induced by transcriptomic changes, arising in part through epigenomic alteration and super-enhancer reprogramming, that broadly recapitulate those found in MED12-mutant UFs. Altogether these findings provide new insights concerning the biological role of CDK8/19 in MM SC biology and UF formation.


Conflict of interest statement

Competing Interests The authors have no relevant financial or non-financial interests to disclose.

Figures

Figure 1
Figure 1. Short-term (4.5hr) Mediator kinase inhibition in MM SCs activates multilineage gene expression programs.
A. Principal component analysis (PCA) plot of top 500 most variable genes in three replicate cultures of MM SCs treated with control DMSO (blue dots) or CCT251545 (red dots). B. Volcano plot showing 167 differentially expressed genes (DEGs; >1.5 absolute fold-change; Padj <0.05) in CCT251545-treated vs control MM SCs. Genes upregulated (n=134) and downregulated (n=33) are indicated by red and blue dots, respectively. C.Heat map of 167 DEGs with top 30 DEGs (ranked by adjusted P value) labeled by gene name. D. GSEA analysis of representative gene sets upregulated in MM SCs by 4.5hr treatment with CCT251545 includes TGF-Beta signaling, Myc Targets V2, E-M Transition, and Myogenesis (all Hallmark), as well as ECM Organization (Reactome) and Adipogenesis (WikiPathways). E.List of all significant (FDR-q val. < 0.05) gene sets from Hallmark and Reactome and top 5 from Wiki Pathways databases ranked by FDR q-values. Selected gene sets shown in D as GESA plots are italicized and bold.
Figure 2
Figure 2. Long-term (3.5d) Mediator kinase inhibition in MM SCs broadly alters gene expression programs associated with myogenic differentiation and the UF phenotype.
A. Principal component analysis (PCA) plot of top 500 most variable genes in three replicate cultures of MM SCs treated with control DMSO (blue dots) or CCT251545 (red dots). B.Volcano plot showing 1,814 DEGs (>1.5 absolute fold-change; Padj <0.05) in CCT251545-treated vs control MM SCs. Genes upregulated (n=899) and downregulated (n=915) are indicated by red and blue dots, respectively. C. Heat map of DEGs with top 30 DEGs (ranked by adjusted P value) labeled by gene name. D. GSEA analysis of representative gene sets upregulated in MM SCs by 3.5d treatment with CCT251545 includes MYC Targets V2, E2F Targets, and Myogenesis (all Hallmark), as well as Keratinization (Reactome). Representative gene sets downregulated include Apoptosis and Inflammatory Response (both Hallmark). E. List of all significant (FDR-q val. < 0.05) gene sets from Hallmark and top 5 from Reactome databases ranked by FDR q-values. Selected gene sets shown in D as GESA plots are italicized and bold.
Figure 3
Figure 3. Mediator kinase inhibition upregulates markers of myogenesis and ECM remodeling.
A. Representative immunocytochemical (ICC) staining and quantification for markers of myogenesis (ACTA2) and ECM (COL-IV) 3.5d post-treatment of MM SCs with DMSO or CCT251545 (CCT). B. Quantified ICC signals for additional markers of myogenesis (MHC, MYOCD) and ECM (FN1, MMP10) 3.5d post-treatment of MM SCs with DMSO or CCT251545 (CCT). Data represent quantified average fluorescent signals from 10 different fields in total from three independent experiments of control and CCT251545-treated cells. Images were taken in a single focal plane at 40X magnification using a ZEISS confocal imaging system. *P<0.05, **P≤0.01, ***P≤0.001; Unpaired t-test with Welch’s correction in GraphPad Prism10.
Figure 4
Figure 4. Mediator kinase inhibition in MM SCs induces a transcriptional program broadly reminiscent of MED12-mutant uterine fibroids.
A. Venn diagram depicting overlap between DEGs in 3.5d CCT251545 (CCT)-treated MM SCs and MED12-mutant uterine fibroids [38]. Hypergeometric P value for the comparison of these two DEG sets is indicated above Venn diagram. B. Bar plot showing common Hallmark gene sets (significance threshold of 25% FDR) shared between CCT251545-treated MM SCs and MED12-mutant uterine fibroids. C. Venn diagram depicting overlap between DEGs in CCT251545-treated MM SCs and engineered G44N UtSMC clones [39]. Hypergeometric P value for the comparison of these two DEG sets is indicated above Venn diagram. D. Common Hallmark gene sets between CCT25154-treated MM SCs and engineered G44N UtSMC clones. E. Venn diagram depicting overlap between DEGs in engineered G44N UtSMC clones and MED12-mutant uterine fibroids. F. Venn diagram depicting 3-way overlap between DEGs in 3.5d CCT251545-treated MM SCs, MED12-mutant tumors, and G44N UtSMC clones.
Figure 5
Figure 5. Mediator kinase inhibition in MM SCs reprograms the H3K27ac epigenome.
A. Heat map of differential H3K27ac peaks in both control (DMSO) and 3.5d CCT251545 (treatment) conditions (one sample per condition) shown around 5kb from the peak center. The density plots above the heat maps demonstrate that the average intensity of gained peaks upon treatment was much higher than that of lost peaks. B. Bar plot showing genomic distribution of gained and lost H3K27ac peaks in 3.5d CCT251545-treated MM SCs. Overall, H3K27ac peaks on intronic regions were lost while those on proximal promoters and distal intergenic regions were gained upon inhibitor treatment. Note that panels A and B represent qualitative assessments to provide a visual comparison between conditions and no formal statistics were applied. C. Scatter plot of changes in expression and H3K27ac (log2FC each) occurring in MM SCs 3.5d post CCT251545-treatment vs control. H3K27ac changes include only those found within 5Kb of the TSS of DEGs. The numbers of H3K27ac peaks gained (violet dots), common (pink dots), and lost (green dots) between samples are indicated. The Spearmen correlation coefficient (SCC) is shown. Statistics applied in panel C are described in Experimental Procedures.
Figure 6
Figure 6. Mediator kinase inhibition in MM SCs activates key cell identity genes through SE acquisition.
A and B. Rank Ordering of Super Enhancer (ROSE) plots show enhancer ranking based on H3K27ac signal intensities under control (DMSO) and CCT251545 (treatment) conditions. Representative genes that gained SEs upon CCT251545 treatment are highlighted in color and correspond to Hallmark gene sets as indicated (Myogenesis [olive], E2F Targets [purple] and keratinization [cyan]). C. Heat map of SE-associated DEGs shows overall upregulation of SE-linked genes in CCT251545-treated cells and the opposite trend in control (DMSO)-treated cells. D. Hallmark gene sets identified through functional enrichment (Enrichr) analysis of genes (1,712) associated with SEs in CCT251545-treated cells. The bar plot shows the top 10 enriched Hallmark gene sets ranked according to their Padj values. Pink bars correspond to significantly enriched gene sets (Padj <0.05), while gray bars correspond to gene sets that failed to reach significance. Note that significantly enriched Hallmark gene sets include those linked to cell growth (E2F Targets) and differentiation (Myogenesis, Adipogenesis). E. Enrichr analysis of 1,712 genes associated with SEs in CCT251545-treated cells also identified keratin related terms across multiple databases as the top enriched pathway (pink bar), which was further supported by upregulation of SE-linked keratin genes upon CCT251545 treatment (heat map).

Similar articles

References

    1. Doherty L, Mutlu L, Sinclair D, Taylor H (2014) Uterine Fibroids: Clinical Manifestations and Contemporary Management. Reproductive Sciences 21: 1067–1092. DOI 10.1177/1933719114533728 - DOI - PubMed
    1. Stewart EA, Laughlin-Tommaso SK, Catherino WH, Lalitkumar S, Gupta D, Vollenhoven B (2016) Uterine fibroids. Nature Reviews Disease Primers 2: 16043. DOI 10.1038/nrdp.2016.43 - DOI - PubMed
    1. Bulun SE (2013) Uterine Fibroids. New England Journal of Medicine 369: 1344–1355. DOI 10.1056/NEJMra1209993 - DOI - PubMed
    1. Bartels CB, Cayton KC, Chuong FS, Holthouser K, Arian SE, Abraham T, Segars JH (2016) An Evidence-based Approach to the Medical Management of Fibroids: A Systematic Review. Clin Obstet Gynecol 59: 30–52. DOI 10.1097/grf.0000000000000171 - DOI - PubMed
    1. Giuliani E, As-Sanie S, Marsh EE (2020) Epidemiology and management of uterine fibroids. Int J Gynaecol Obstet 149: 3–9. DOI 10.1002/ijgo.13102 - DOI - PubMed

Publication types

LinkOut - more resources