

This is a preprint.
Ultra-sensitive, tumor-informed ctDNA profiling in pembrolizumab-treated esophagogastric cancer patients predicts clinical responses
- PMID: 39764133
- PMCID: PMC11702795
- DOI: 10.21203/rs.3.rs-5349536/v1
Ultra-sensitive, tumor-informed ctDNA profiling in pembrolizumab-treated esophagogastric cancer patients predicts clinical responses
Abstract
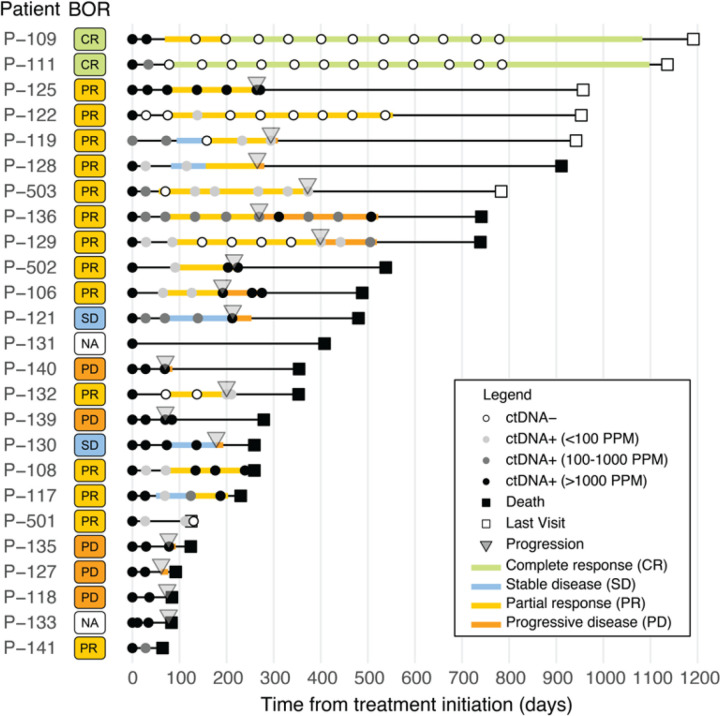
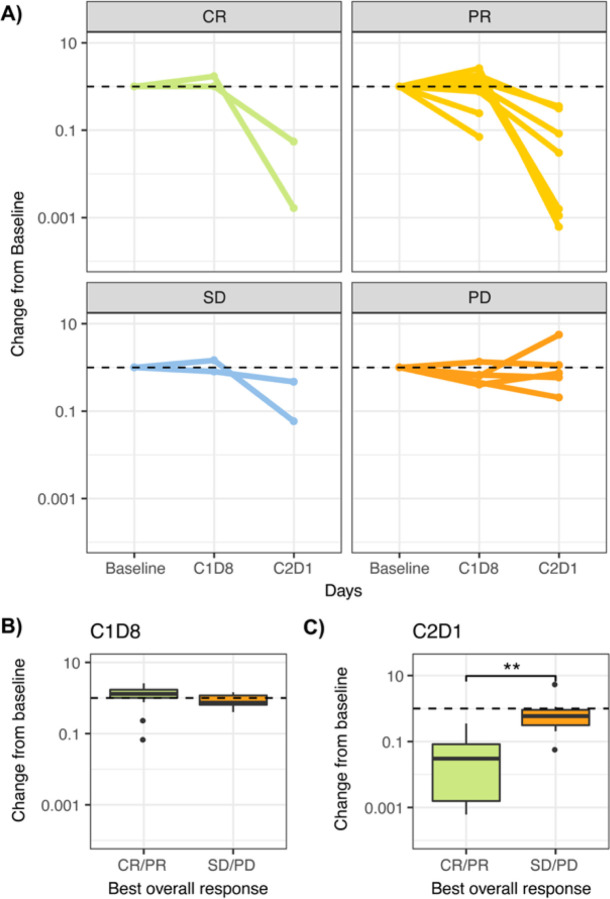
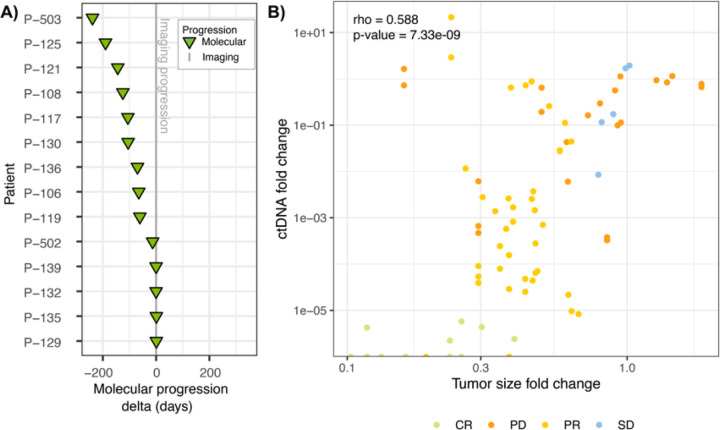
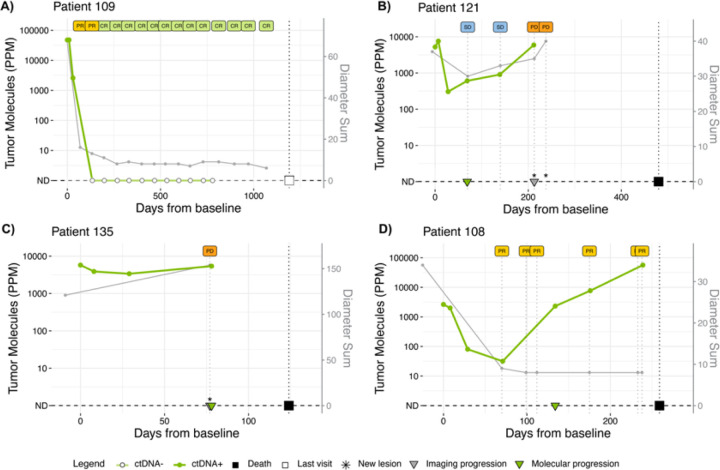
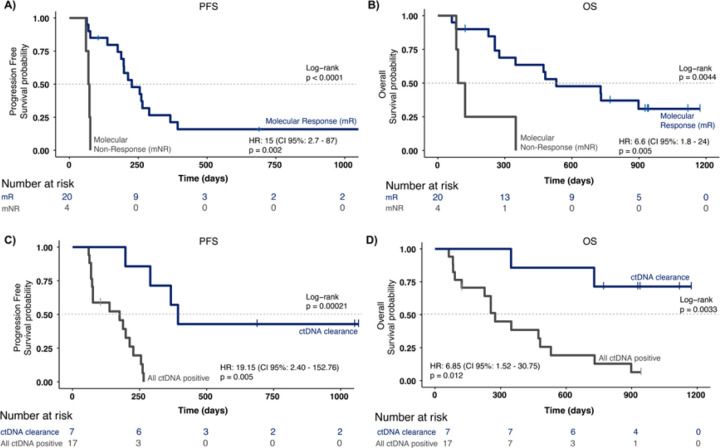
To explore whether ultra-sensitive circulating tumor DNA (ctDNA) profiling enables early prediction of treatment response and early detection of disease progression, we applied NeXT Personal, an ultra-sensitive bespoke tumor-informed liquid biopsy platform, to profile tumor samples from the KeyLargo study, a phase II trial in which metastatic esophagogastric cancer (mEGC) patients received capecitabine, oxaliplatin, and pembrolizumab. All 25 patients evaluated were ctDNA-positive at baseline. Minimal residual disease (MRD) events varied from 406,067 down to 1.5 parts per million (PPM) of ctDNA with a median limit of detection of 2.03 PPM. ctDNA dynamics were highly correlated with changes in tumor size (ρ = 0.59, p = 7.3×10⁻⁹). Lack of early molecular response (lack of ctDNA decrease) was associated with worse overall survival (OS) (HR 6.6, 95% CI 1.8-24.1, p = 0.005) and progression-free survival (PFS) (HR 15.4, 95% CI 2.7-87.0, p = 0.002). Lack of molecular clearance of ctDNA was associated with worse OS (HR 6.9, 95% CI 1.5-30.8, p = 0.012) and PFS (HR 19.2, 95% CI 2.4-152.8, p = 0.005). Molecular progression (ctDNA increase) preceded imaging-derived progression by a median lead time of 65 days. These results suggest that ultra-sensitive liquid biopsy approaches could improve treatment decision-making for mEGC patients receiving chemotherapy and immunotherapy.
Keywords: ctDNA; gastroesophageal cancer; pembrolizumab; personalized assay; ultra-sensitive detection.
Conflict of interest statement
Additional Declarations: Competing interest reported. ABN has received research funding from Genentech, Genmab, MedImmune/AstraZeneca, Seattle Genetics, and has received consultant/advisory compensation from Sanofi and Leap Therapeutics. LM has stock in Personalis and other intellectual property. JJ has received research funding from Bayer, Incyte, Roche/Genentech, and Xilis. JS has received research funding or contracted research from Abbvie, Amgen, AStar D3, Bayer, Beigene, Curegenix, Daiichi-Sankyo, Eli Lilly, Erasca, GSK, Leap Therapeutics, Novartis, Pfizer, Revolution Medicines, Roche/ Genentech, Seagen; has received consultant/advisory compensation from Abbvie, Agenus, Astellas, AstraZeneca, Bayer, Beigene, Daiichi-Sankyo, Eli Lilly, GSK, Johnson and Johnson, Jazz Pharmaceuticals, Merck, Natera, Pfizer, Roche/Genentech, Regeneron, Sanofi, Taiho, Takeda, Xilio Therapeutics; and has received stocks from Triumvira Immunologics. HU has received research funding from Adaptimmune, Arcus Biosciences, Bristol-Myers Squibb, Genentech/Roche, Leap Therapeutics, Macrogenics, Merck; and has received consultant/advisory compensation from AstraZeneca and Bristol-Myers Squibb/Medarex. FCPN, CA, LM, SMB, ROC are employed and have received stocks from Personalis, Inc. The other authors declared no conflicts of interest.
Figures


References
-
- Janjigian Y. Y. et al. First-line nivolumab plus chemotherapy versus chemotherapy alone for advanced gastric, gastro-oesophageal junction, and oesophageal adenocarcinoma (CheckMate 649): a randomised, open-label, phase 3 trial. Lancet 398, 27–40, doi: 10.1016/S0140-6736(21)00797-2 (2021). - DOI - PMC - PubMed
-
- Chau I. Nivolumab (NIVO) plus ipilimumab (IPI) or NIVO plus chemotherapy (chemo) versus chemo as first-line (1L) treatment for advanced esophageal squamous cell carcinoma (ESCC): First results of the CheckMate 648 study. J Clin Oncol 39, 2021 (suppl 15; abstr LBA4001), doi: 10.1200/JCO.2021.39.15_suppl.LBA4001 (2021). - DOI
Publication types
Grants and funding
LinkOut - more resources
Full Text Sources
