. 2024 Dec 23:15:1497017.
doi: 10.3389/fpls.2024.1497017. eCollection 2024.

Core transcriptome network modulates temperature (heat and cold) and osmotic (drought, salinity, and waterlogging) stress responses in oil palm

Affiliations

Core transcriptome network modulates temperature (heat and cold) and osmotic (drought, salinity, and waterlogging) stress responses in oil palm

Fong Chin Lee et al. Front Plant Sci. .

Abstract

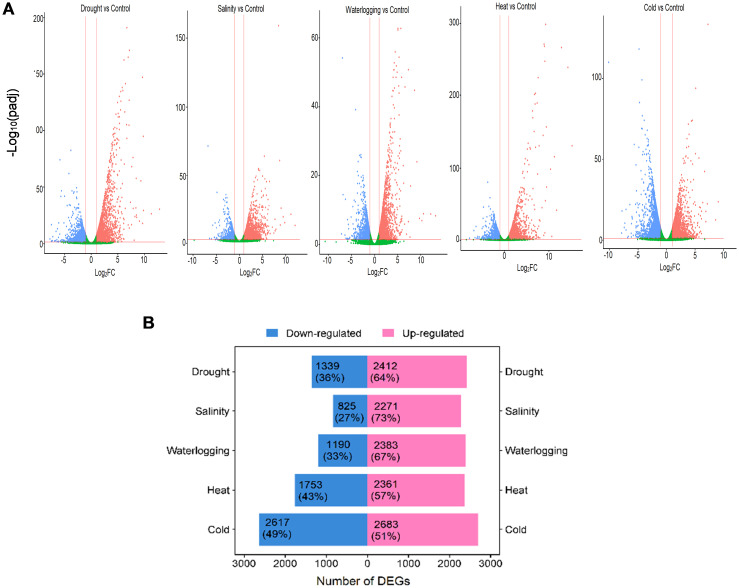
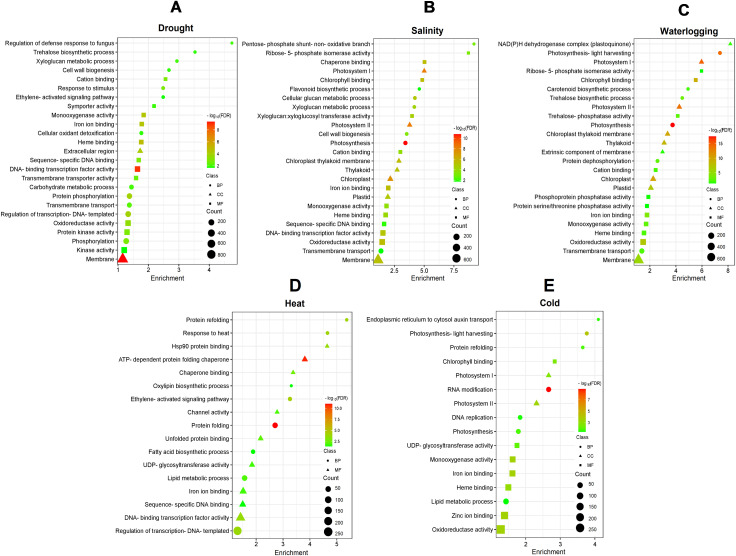
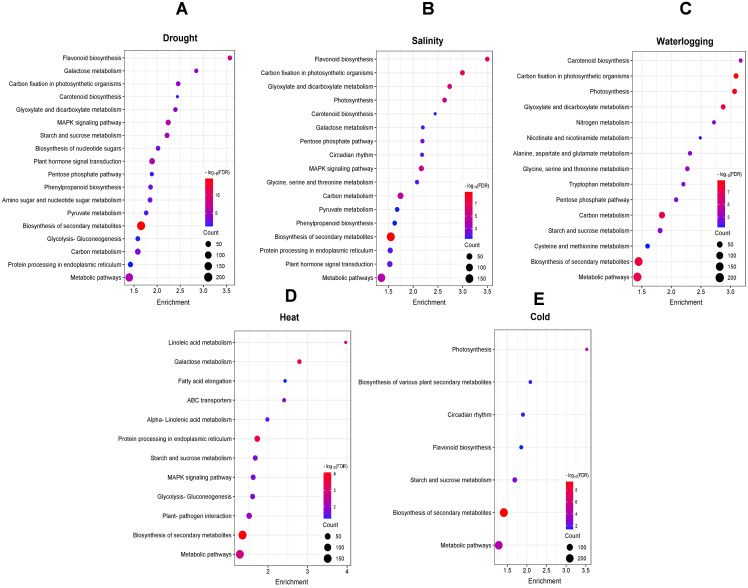
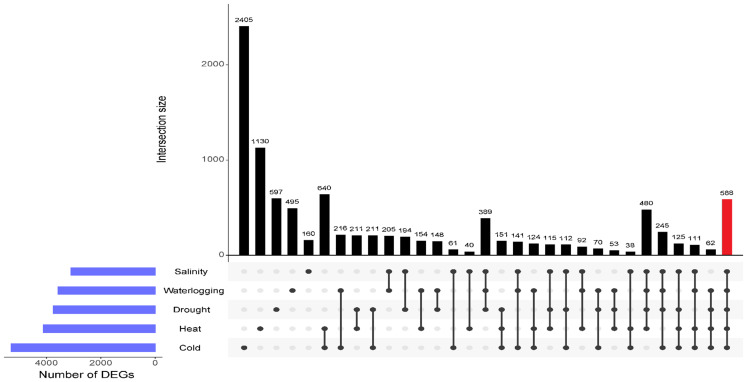
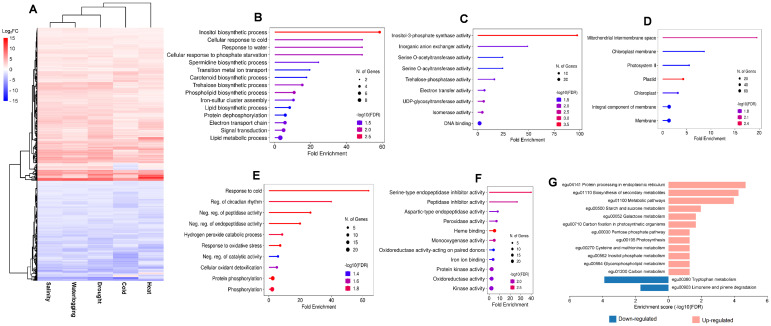
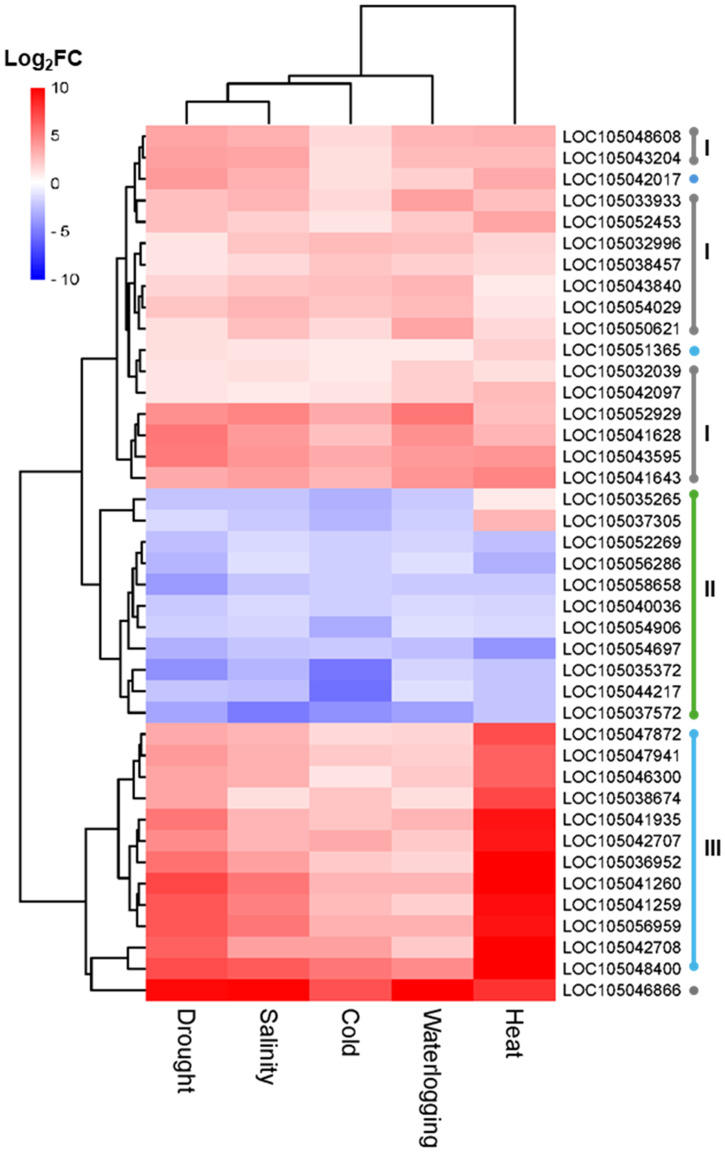
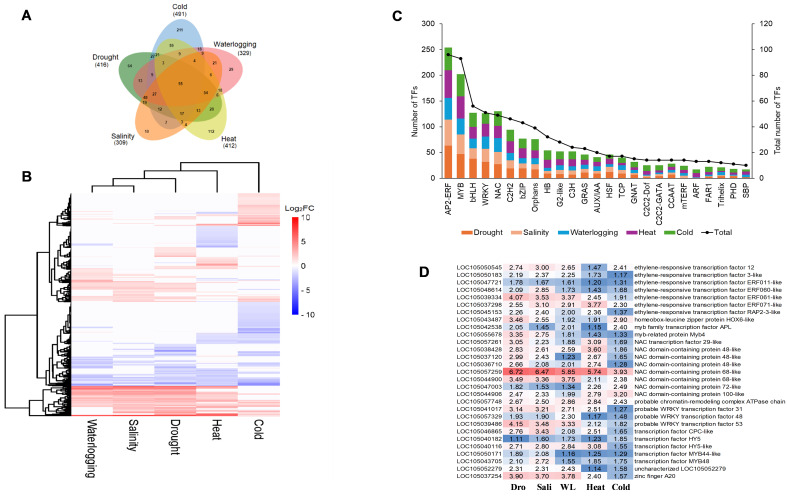
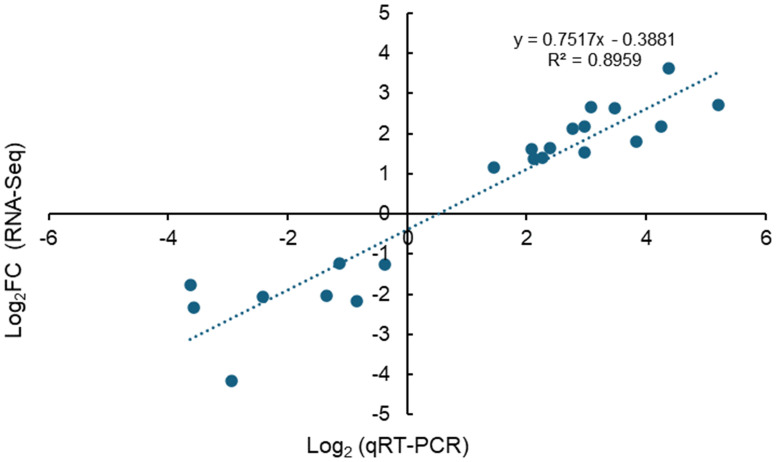
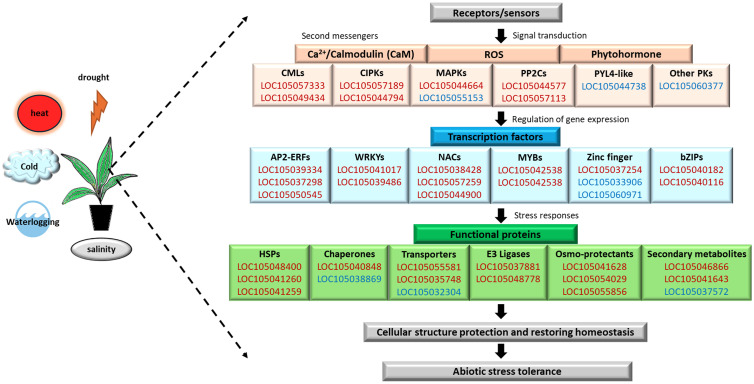
Oil palm (Elaeis guineensis) yield is impacted by abiotic stresses, leading to significant economic losses. To understand the core abiotic stress transcriptome (CAST) of oil palm, we performed RNA-Seq analyses of oil palm leaves subjected to drought, salinity, waterlogging, heat, and cold stresses. A total of 19,834 differentially expressed genes (DEGs) were identified. Cold treatment induced the highest number of DEGs (5,300), followed by heat (4,114), drought (3,751), waterlogging (3,573), and, lastly, salinity (3096) stress. Subsequent analysis revealed the CAST of oil palm, comprising 588 DEGs commonly expressed under drought, salinity, waterlogging, heat, and cold stress conditions. Function annotation of these DEGs suggests their roles in signal transduction, transcription regulation, and abiotic stress responses including synthesis of osmolytes, secondary metabolites, and molecular chaperones. Moreover, we identified core DEGs encoding kinases, ERF, NAC TFs, heat shock proteins, E3 ubiquitin-protein ligase, terpineol synthase, and cytochrome P450. These core DEGs may be potential key modulators that interplay in triggering rapid abiotic stress responses to achieve delicate equilibrium between productivity and adaptation to abiotic stresses. This comprehensive study provides insights into the key modulators in the CAST of oil palm, and their potential applications as markers for selecting climate-resilient oil palms or opportunities to develop future climate resilient oil palm using genome editing.

Keywords: RNA-seq; abiotic stresses; core transcriptome; differential expressed genes; oil palm.


Conflict of interest statement

All authors were employed by SD Guthrie Technology Centre / SD Guthrie Research, Malaysia.

Figures

Figure 1
Figure 1
Overview of DEGs in response to abiotic stresses. (A) Volcano plots show DEGs of each abiotic stress. Significantly upregulated DEGs (log2FC > 1, adjusted p-value < 0.05) are highlighted in red dots, and significantly downregulated DEGs (log2FC < −1, adjusted p-value < 0.05) are highlighted in blue dots. Non-significant genes are shown in green. (B) Bar chart shows the total and percentage of upregulated (pink bar) and downregulated (blue bar) DEGs in each abiotic stress.
Figure 2
Figure 2
GO enrichment analysis of DEGs under (A) drought, (B) salinity, (C) waterlogging, (D) heat, and (E) cold treatments. The color gradient from red to green represents the log10(FDR) of the enrichment, with red indicating higher significance. The size of each point indicates the count of DEGs associated with the corresponding GO term. Different shapes represent the GO categories: circles for biological process (BP), triangles for cellular component (CC), and squares for molecular function (MF).
Figure 3
Figure 3
KEGG pathway enrichment analysis of DEGs under (A) drought, (B) salinity, (C) waterlogging, (D) heat, and (E) cold treatments. The color gradient from red to blue represents the log10(FDR) of the enrichment, with red indicating higher significance. The size of each point indicates the count of DEGs associated with the corresponding pathway.
Figure 4
Figure 4
UpSet plot shows the intersection of DEGs across different comparisons of abiotic stress-treated samples. The horizontal blue bars on the left represent the total number of DEGs for each abiotic stress. The vertical bars represent the size of the intersections between gene sets of different comparisons as shown by the individual dots and connecting lines. DEGs common to five abiotic stresses are highlighted in red bar.
Figure 5
Figure 5
Expression profiles of core DEGs of five abiotic stresses and the enrichment analysis. (A) Hierarchical clustering analysis of expression patterns for all core DEGs for salinity, waterlogging, drought, and cold and heat stress that segregated DEGs into upregulated and downregulated cluster. Gene ontology enrichment analysis for upregulated core DEGs in the (B) biological process (BP) category, (C) molecular function (MF) category, and (D) cellular component (CC) category. Gene ontology enrichment analysis for downregulated core DEGs in the (E) biological process (BP) category and (F) molecular function (MF) category. (G) KEGG pathway enrichment analysis of core DEGs in upregulated (pink bar) and downregulated (blue bar) cluster.
Figure 6
Figure 6
Hierarchical clustering analysis of expression patterns of core DEGs identified in drought, salinity, cold, waterlogging, and heat samples that significantly enriched in the biosynthesis of secondary metabolites (egu01110, gray dot, I), heme binding (GO:0020037, green dot, II), and protein processing in endoplasmic reticulum (egu04141, blue dot, III).
Figure 7
Figure 7
Expression profile analysis of DEGs encode for TF. (A) Venn diagram of DEGs encode for TF indicates common and unique TF under different abiotic stress conditions. Numbers in bracket shows total number of DEGs identified. (B) Hierarchical clustering analysis of expression patterns for TF encoding DEGs identified in waterlogging, salinity, drought, and heat and cold samples. (C) Distribution of the top 25 abiotic stress-related transcription factor families identified in drought, salinity, waterlogging, and heat- and cold-treated samples. Analysis of DEGs encode for TF in response to drought, salinity, waterlogging, and heat and cold stress. (D) Heatmap of the 29 core DEGs encode for TF of oil palm abiotic stress response. The color gradient from red to blue represents the fold change (FC) of upregulated DEGs, with red indicating higher FC level. The numbers inside the cells represent the fold change (FC) values. Dro, drought; Sali, salinity; WL, waterlogging.
Figure 8
Figure 8
qRT-PCR validation of DEGs characterized by RNA-Seq. Correlation of fold change identified by the RNA-Seq method (x-axis) with expression data obtained using the qRT-PCR method (y-axis) to validate DEGs characterized by RNA-Seq.
Figure 9
Figure 9
Overview of the CAST of oil palm abiotic stress signaling pathways in oil palm highlighting the core upregulated DEGs (red) and downregulated DEGs (blue), which are involved in the signal transduction, gene regulation, stress responses, and abiotic stress tolerance.

Similar articles

References

    1. Abubakar A., Ishak M. Y., Makmom A. A. (2022). Nexus between climate change and oil palm production in Malaysia: a review. Environ. Monit. Assess. 194, 262. doi: 10.1007/s10661-022-09915-8 - DOI - PubMed
    1. Ali Z., Merrium S., Habib-ur-Rahman M., Hakeem S., Saddique M. A. B., Sher M. A. (2022). Wetting mechanism and morphological adaptation; leaf rolling enhancing atmospheric water acquisition in wheat crop—a review. Environ. Sci. pollut. Res. 29, 30967–30985. doi: 10.1007/s11356-022-18846-3 - DOI - PMC - PubMed
    1. Anders S., Huber W. (2012). Differential expression of RNA-Seq data at the gene level–the DESeq package. Heidelberg Germany: Eur. Mol. Biol. Lab. 10.
    1. Anders S., Pyl P. T., Huber W. J. B. (2015). HTSeq—a Python framework to work with high-throughput sequencing data Bioinformatics 31, 166–169. doi: 10.1093/bioinformatics/btu638 - DOI - PMC - PubMed
    1. Azzeme A. M., Abdullah S. N. A., Aziz M. A., Wahab P. E. M. (2016). Oil palm leaves and roots differ in physiological response, antioxidant enzyme activities and expression of stress-responsive genes upon exposure to drought stress. Acta Physiologiae Plantarum 38, 52. doi: 10.1007/s11738-016-2073-2 - DOI

LinkOut - more resources