

Triglycerides to apolipoprotein A1 ratio: an effective insulin resistance-associated index in identifying metabolic dysfunction-associated fatty liver disease in type 2 diabetes mellitus
- PMID: 39764250
- PMCID: PMC11700801
- DOI: 10.3389/fendo.2024.1384059
Triglycerides to apolipoprotein A1 ratio: an effective insulin resistance-associated index in identifying metabolic dysfunction-associated fatty liver disease in type 2 diabetes mellitus
Abstract
Background: The triglycerides to Apolipoprotein A1 ratio (TG/APOA1) holds promise to be a more valuable index of insulin resistance for the diagnosis of metabolic dysfunction-associated fatty liver disease (MAFLD) in type 2 diabetes mellitus (T2DM). This study aims to evaluate the correlation between TG/APOA1 and MAFLD, as well as compare the efficacy of TG/APOA1 with triglycerides to high-density lipoprotein cholesterol ratio (TG/HDL-c) and triglyceride-glucose (TyG) index in identifying MAFLD among individuals with T2DM.
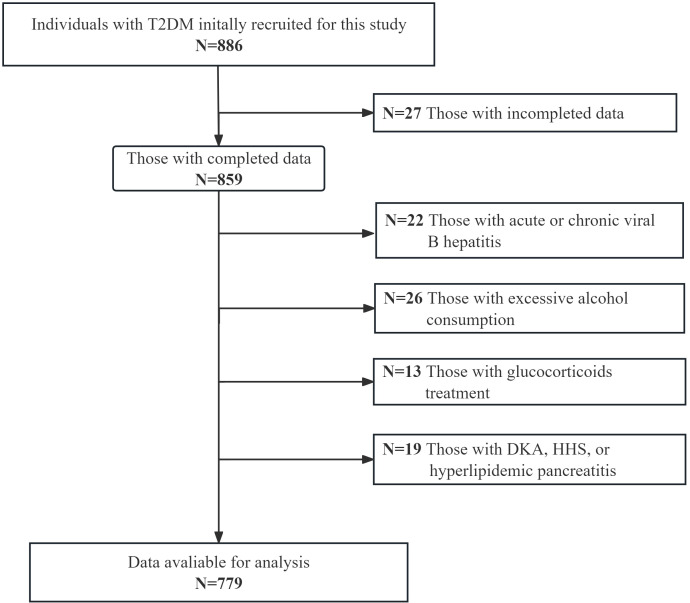
Method: This study consecutively recruited 779 individuals with T2DM for the investigation. The unenhanced abdominal CT scans were conducted to measure CT liver-spleen attenuation measurement (CTL-S). The CTL-S less than 1.0 and without other liver comorbidities were considered to be MAFLD. The binomial logistic regression analysis and restricted cubic spines (RCS) were employed to evaluate the association between TG/APOA1 and MAFLD. The receiver operating characteristic (ROC) curve analysis was performed to compare the efficacy of TG/APOA1 with TG/HDL-c and TyG index identifying MAFLD.
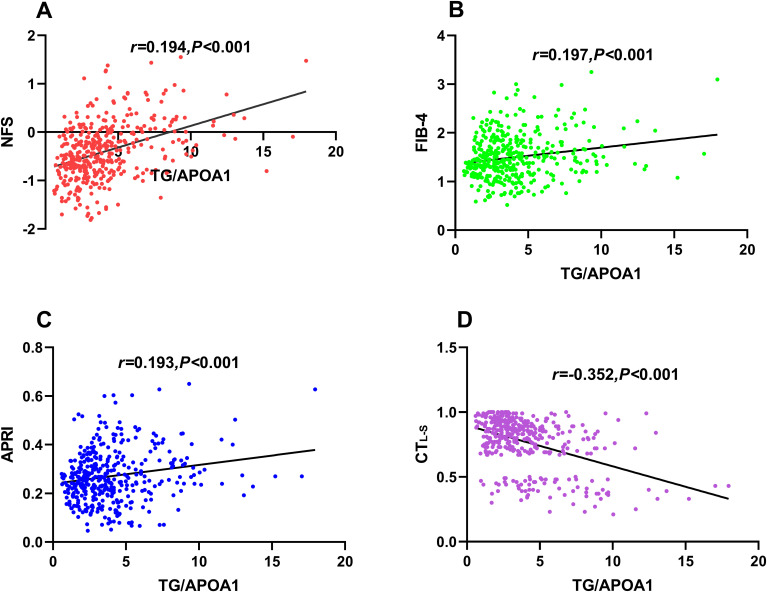
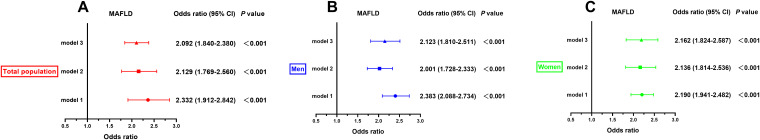
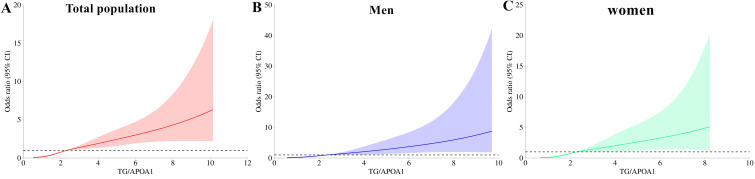
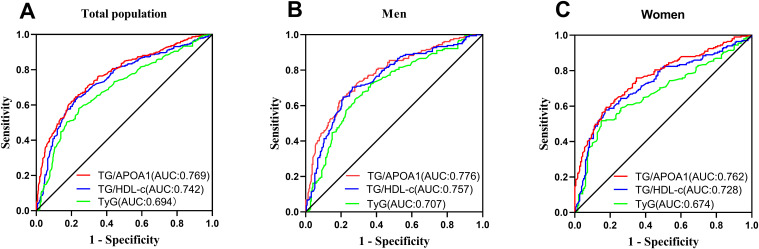
Results: The TG/APOA1 exhibited a substantial increase in the MAFLD group (P<0.05). Even after adjustments for potential confounding factors, TG/APOA1 exhibited significant associations with nonalcoholic fatty liver disease fibrosis score (β=0.266, P<0.001), fibrosis-4 index (β=0.123, P=0.029), aspartate aminotransferase-to-platelet ratio index (β=0.113, P=0.037), and CTL-S (β=-0.225, P<0.001). Meanwhile, TG/APOA1 contributed to an independent variable for MAFLD, the odds ratio with a 95% CI was 2.092 (1.840-2.380) in the total population, 2.123 (1.810-2.511) in men, and 2.162 (1.824-2.587) in women. Additionally, the results also revealed a nonlinear association between elevated TG/APOA1 and higher MAFLD risk according to the RCS analysis whether in the total population, men, or women (P for nonlinearity and overall <0.001). Furthermore, TG/APOA1 had higher AUC level compared to TG/HDL-c and TyG index in the total population (0.769 vs 0.742, P=0.025; 0.769 vs 0.694, P < 0.001), men (0.776 vs 0.744, P=0.044; 0.776 vs 0.709, P < 0.001), and women (0.762 vs 0.728, P=0.041; 0.762 vs 0.674, P < 0.001).
Conclusion: TG/APOA1 serves as an effective index of insulin resistance in identifying MAFLD, offering advantages in the screening of MAFLD in T2DM.
Keywords: insulin resistance; metabolic dysfunction-associated fatty liver disease; triglyceride glucose index; triglycerides to apolipoprotein A1 ratio; triglycerides to high-density lipoprotein cholesterol ratio; type 2 diabetes mellitus.
Copyright © 2024 Wang, Chen, Tu and Chen.
Conflict of interest statement
The authors declare that the research was conducted in the absence of any commercial or financial relationships that could be construed as a potential conflict of interest.
Figures
Similar articles
-
The serum uric acid to apolipoprotein A1 ratio is independently correlated with metabolic dysfunction-associated steatotic liver disease in type 2 diabetes mellitus: findings from a single national metabolic management center cohort.Front Endocrinol (Lausanne). 2025 Jun 4;16:1619003. doi: 10.3389/fendo.2025.1619003. eCollection 2025. Front Endocrinol (Lausanne). 2025. PMID: 40535329 Free PMC article.
-
Biochemical and Anthropometric Indices of Insulin Resistance in Obese and Overweight Children with Metabolic Dysfunction-Associated Fatty Liver Disease.Med Sci Monit. 2024 Jul 3;30:e943375. doi: 10.12659/MSM.943375. Med Sci Monit. 2024. PMID: 38956840 Free PMC article.
-
Prediction and Validation of Metabolic Dysfunction-Associated Fatty Liver Disease Using Insulin Resistance-Related Indices in the Japanese Population.Metab Syndr Relat Disord. 2023 Nov;21(9):489-496. doi: 10.1089/met.2023.0116. Epub 2023 Oct 25. Metab Syndr Relat Disord. 2023. PMID: 37878804
-
Risk factor analysis and predictive model construction of lean MAFLD: a cross-sectional study of a health check-up population in China.Eur J Med Res. 2025 Feb 25;30(1):137. doi: 10.1186/s40001-025-02373-1. Eur J Med Res. 2025. PMID: 40001266 Free PMC article. Review.
-
The Management of Cardiometabolic Risk in MAFLD: Therapeutic Strategies to Modulate Deranged Metabolism and Cholesterol Levels.Medicina (Kaunas). 2025 Feb 23;61(3):387. doi: 10.3390/medicina61030387. Medicina (Kaunas). 2025. PMID: 40142198 Free PMC article. Review.
Cited by
-
Liraglutide Reduces Liver Steatosis and Improves Metabolic Indices in Obese Patients Without Diabetes: A 3-Month Prospective Study.Int J Mol Sci. 2025 Jun 19;26(12):5883. doi: 10.3390/ijms26125883. Int J Mol Sci. 2025. PMID: 40565353 Free PMC article.
-
The serum uric acid to apolipoprotein A1 ratio is independently correlated with metabolic dysfunction-associated steatotic liver disease in type 2 diabetes mellitus: findings from a single national metabolic management center cohort.Front Endocrinol (Lausanne). 2025 Jun 4;16:1619003. doi: 10.3389/fendo.2025.1619003. eCollection 2025. Front Endocrinol (Lausanne). 2025. PMID: 40535329 Free PMC article.
References
MeSH terms
Substances
LinkOut - more resources
Full Text Sources
Medical
Miscellaneous