. 2024 Dec 23:15:1473213.
doi: 10.3389/fphar.2024.1473213. eCollection 2024.

Chronic nicotine exposure induces molecular and transcriptomic endophenotypes associated with mood and anxiety disorders in a cerebral organoid neurodevelopmental model

Affiliations

Chronic nicotine exposure induces molecular and transcriptomic endophenotypes associated with mood and anxiety disorders in a cerebral organoid neurodevelopmental model

Emma K Proud et al. Front Pharmacol. .

Abstract

Introduction: Prenatal nicotine exposure (PNE) from maternal smoking disrupts regulatory processes vital to fetal development. These changes result in long-term behavioral impairments, including mood and anxiety disorders, that manifest later in life. However, the relationship underlying PNE, and the underpinnings of mood and anxiety molecular and transcriptomic phenotypes remains elusive.

Methods: To model nicotine exposure during prenatal development, our study used human cerebral organoids that were chronically exposed to nicotine and collected for molecular analyses.

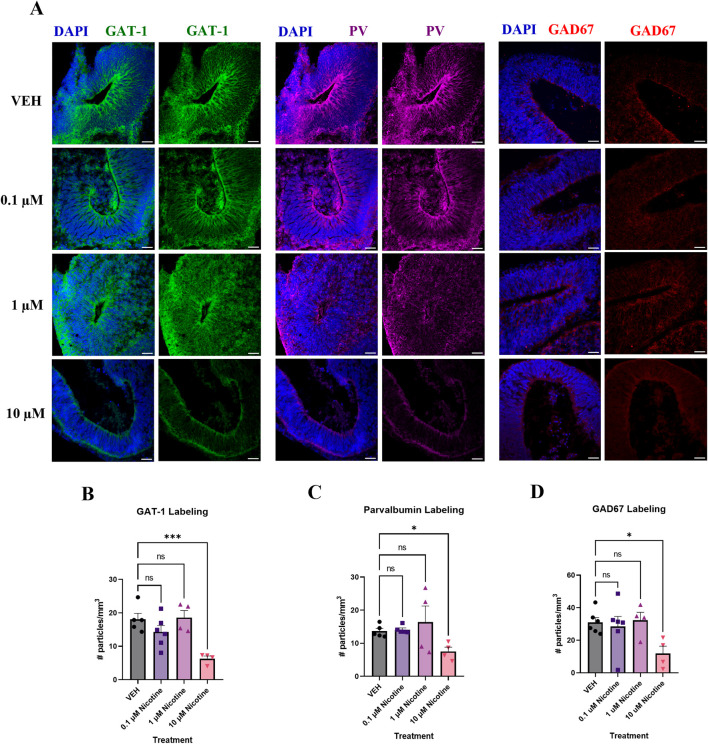
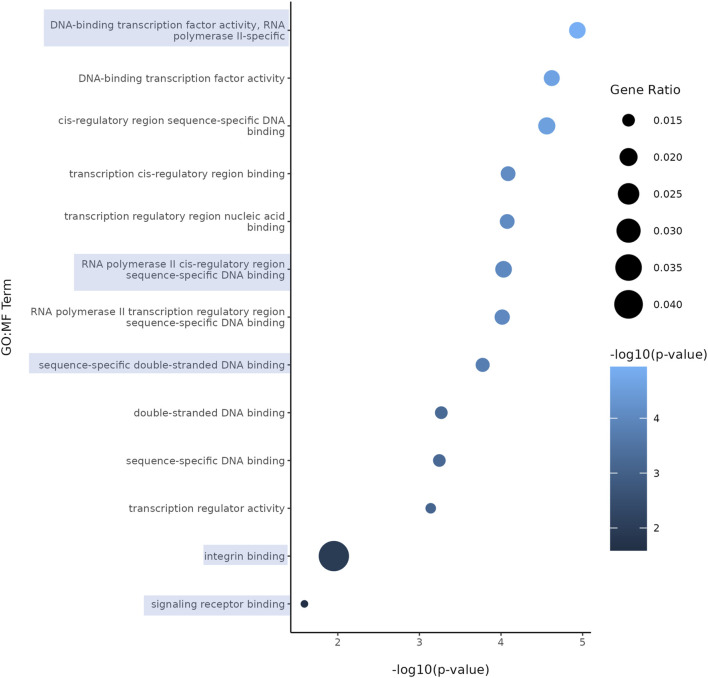
Results: Short-term, nicotine altered molecular markers of neural identity, mood and anxiety disorders and those involved in maintaining the excitatory/inhibitory (E/I) balance in the cortex. RNA sequencing further revealed transcriptomic changes in genes pertaining to embryonic development, neurogenesis, and DNA binding. Long-term, mature organoids demonstrated similar disruptions in E/I balance, decreased expression of neural identity markers, and altered dopamine receptor expression.

Discussion: Collectively, our results demonstrate that nicotine-induced alterations occur acutely and persist at later stages of development. These findings validate an in vitro model of PNE to better comprehend the emergence of neuropsychiatric molecular and transcriptomic endophenotypes resulting from gestational nicotine exposure.

Keywords: anxiety; depression; human cerebral organoids; prenatal development; prenatal nicotine exposure.


Conflict of interest statement

The authors declare that the research was conducted in the absence of any commercial or financial relationships that could be construed as a potential conflict of interest. The author(s) declared that they were an editorial board member of Frontiers, at the time of submission. This had no impact on the peer review process and the final decision.

Figures

FIGURE 1
FIGURE 1
(A) Description of the cerebral organoid culture system and representative microscopic images. The iPSCs were maintained in culture for 2 weeks prior to organoid generation. On day 0, the iPSCs were cultured in an EB Formation Medium, and aggregated to form EBs. On day 5, the EBs were cultured in an Induction Medium which induced them to a neural fate. On day 7, the organoids were embedded in Matrigel and cultured in an Expansion Medium to allow expansion of the neuroepithelium. On day 10, the organoids were cultured in Maturation Medium and placed on an orbital shaker. Aside from nicotine treatment, when the medium was changed daily, the Maturation Medium was changed once every 3 days. (B) Details of nicotine treatment and organoid collection. Beginning on D28, the organoids were treated daily with VEH medium or medium containing one of three doses of nicotine, for 14 days. Following nicotine exposure, on D42 and at D180, the organoids were collected for IF, RNA-Seq and qPCR. Figure made using BioRender.
FIGURE 2
FIGURE 2
iPSC-derived cerebral organoids express markers specific to early brain regionalization and vital to development. Scale bar = 50 μm. (A–F) Immunofluorescent images were captured using confocal microscopy. (A–C) Staining of VEH organoids was performed for the expression of proliferation marker Ki67 (A) and regional markers FZD9 (B) and PROX1 (C) on D42. (D–F) VEH organoids also expressed neuronal marker MAP2 (D), developmental markers FGFR1 (E) and CDH13 (F).
FIGURE 3
FIGURE 3
Nicotine significantly increases cell death and the number of early-born neurons on D42. (A) Immunofluorescent images captured using confocal microscopy of CCasp3 (green) and CTIP2 (red) in brain organoids treated with (0.1, 1 or 10 μM) nicotine or without (VEH) for 14 days. Scale bar = 50 μm. (B, C) Quantification of immunofluorescent images by the number of particles per area (mm3). (B) Organoids treated with 10 μM displayed a significant increase in apoptotic cell death, denoted by increased expression of CCasp3. (C) Nicotine significantly increased the presence of cortical layer marker CTIP2. Comparisons were made with Kruskal Wallis followed by Fisher’s LSD post hoc test. Data are mean ± SEM, n = 3 organoids per group; 20 total ROIs per marker, **p < 0.01, *p < 0.05, trending = p < 0.1, ns = not significant, p > 0.05. Each data point represents one ROI.
FIGURE 4
FIGURE 4
Nicotine selectively upregulates certain nAchR populations at D42. (A) Immunofluorescent images captured using confocal microscopy of α7 (green), α4 (magenta) and β2 nAchR (red) in brain organoids treated with (0.1, 1 or 10 μM) nicotine or without (VEH) for 14 days. Scale bar = 50 μm. (B–D) Quantification of immunofluorescent images by the number of particles per area (mm3). Nicotine did not affect α7 nAchR expression (B) but significantly increased α4 (C) and β2 (D) compared to VEH organoids. Comparisons were made with one-way ANOVA or Kruskal Wallis followed by Fisher’s LSD post hoc test. Data are mean ± SEM, n = 3 organoids per group; 18–20 total ROIs per marker, ***p < 0.001, *p < 0.05, ns = not significant, p > 0.05. Each data point represents one ROI.
FIGURE 5
FIGURE 5
Nicotine induces significant alterations in dopaminergic receptors implicated in mood and anxiety disorders at D42. (A) Immunofluorescent images captured using confocal microscopy of D1R (green) and D2R (red) brain organoids treated with (0.1 or 1 μM) nicotine or without (VEH) for 14 days. Scale bar = 50 μm. (B, C) Quantification of immunofluorescent images by the number of particles per area (mm3). Compared to VEH, organoids treated with nicotine had significantly decreased levels of D1R at 0.1 μM (B) and D2R at 0.1 and 1 μM (C). Comparisons were made with one-way ANOVA or Kruskal Wallis followed by Fisher’s LSD post hoc test. Data are mean ± SEM, n = 3 organoids per group; 16 total ROIs per marker, **p < 0.01, *p < 0.05, trending = p < 0.1, ns = not significant, p > 0.05. Each data point represents one ROI.
FIGURE 6
FIGURE 6
Nicotine induces significant deficits in markers vital to GABAergic synthesis, transport and signaling on D42. (A) Immunofluorescent images captured using confocal microscopy of GABA transporter GAT-1 (green), interneuron marker PV (magenta) and GABA synthesis marker GAD67 (red) in brain organoids treated with (0.1, 1 or 10 μM) nicotine or without (VEH) for 14 days. Scale bar = 50 μm. (B–D) Quantification of immunofluorescent images by the number of particles per area (mm3). At the 10 μM dose, organoids exhibited a significant decrease in GAT-1 (B), PV (C), and GAD67 (D) expression compared to VEH. Comparisons were made with one-way ANOVA or Kruskal Wallis followed by Fisher’s LSD post hoc test. Data are mean ± SEM, n = 3 organoids per group; 18–20 total ROIs per marker, ***p < 0.001, *p < 0.05, trending = p < 0.1, ns = not significant, p > 0.05. Each data point represents one ROI.
FIGURE 7
FIGURE 7
Nicotine elicits short-term changes in gene expression of various neural identity markers on D42. (A–C) Expression of relative abundance of mRNA of neural identity markers by qPCR in brain organoids exposed to nicotine (0.1, or 1 μM) or without (VEH) for 14 days. Relative mRNA abundance was calculated by normalizing the marker of interest to the geometric means of two housekeeping genes, GAPDH and ACTB. Organoids demonstrated a trending increase in cortical marker EMX1 (A) and forebrain marker FOXG1 (B). There is a significant decrease in ISL1, a marker of embryonic development (C). Comparisons were made with one-way ANOVA or Kruskal Wallis followed by Fisher’s LSD post hoc test. Data are mean ± SEM, n = 5–6 organoids per group, *p < 0.05, trending = p < 0.1, ns = not significant, p > 0.05.
FIGURE 8
FIGURE 8
RNA-Seq differential gene expression and functional enrichment analysis of D42 VEH and 0.1 μM nicotine-treated organoids. (A) Multidimensional scaling plot demonstrating the separation of VEH (green) and 0.1 μM (red) nicotine-treated organoids. (B) Volcano plot illustrating the number of DEGs in VEH and 0.1 μM treated organoids. Upregulated genes in red (n = 40), downregulated genes in blue (n = 91). (C) Heatmap of log2 transformed normalized CPM values for all DEGs for VEH and 0.1 μM treated organoids. Values were centered, scaled across rows, and clustered using Ward’s clustering algorithm. Upregulated genes in red (n = 40), downregulated genes in blue (n = 91), n = 3 per group, FDR ≤ 0.05. (D) Overrepresented genes are categorized according to their functional characteristics quantified by the number of genes (counts) within a certain category. The categories originate from certain databases and include, from left to right, gene ontology (GO) biological processes (GO BP; 111), GO cellular component (GO CC; 2), GO molecular function (GO MF; 13), Human Protein Atlas (HPA; 4), Transfac (TF; 3) and Wikipathways (WP; 3).
FIGURE 9
FIGURE 9
Enriched GO terms in D42 VEH and 0.1 μM nicotine-treated organoids. GO BP terms reveal that PNE elicits alterations in genes within processes such as nervous system development, neurogenesis, and other developmental processes. Circle size represents gene ratio and color represents fold change (-log10 transform of the adjusted p-value). Blue boxes represent terms of particular interest.
FIGURE 10
FIGURE 10
Enriched GO terms in D42 VEH and 0.1 μM nicotine-treated organoids. GO MF terms illustrate genes enriched in functions pertaining to DNA, signaling receptor and integrin binding activity. Circle size represents gene ratio and color represents fold change (-log10 transform of the adjusted p-value). Blue boxes represent terms of particular interest.
FIGURE 11
FIGURE 11
Nicotine induces long-term alterations in neuronal differentiation, dopaminergic and glutamatergic markers at D180. (A) Immunofluorescent images captured using confocal microscopy of CTIP2 (red), D1R (green), NR2B (red) and mGLUR2/3 (green) in brain organoids treated with (0.1 or 1 μM) nicotine or without (VEH) for 14 days. Scale bar = 50 μm. (B–E) Quantification of immunofluorescent images by the number of particles per area (mm3). Compared to VEH, organoids treated with nicotine had significantly decreased cortical layer marker CTIP2 levels at 0.1 and 1.0 μM (B). Nicotine also significantly increased D1R (C) and glutamatergic markers NR2B (D) and mGLUR2/3 (E). Comparisons were made with one-way ANOVA or Kruskal Wallis followed by Fisher’s LSD post hoc test. Data are mean ± SEM, n = 3 organoids per group; 31–36 total ROIs per marker, **p < 0.01, *p < 0.05, trending = p < 0.1, ns = not significant, p > 0.05. Each data point represents one ROI.
FIGURE 12
FIGURE 12
Nicotine elicits persistent, long-term changes in neural identity markers, glutamatergic, GABAergic and dopaminergic markers implicated in mood and anxiety disorders at D180. (A–E) Expression of relative abundance of mRNA by qPCR in mature D180 brain organoids exposed to nicotine (0.1, or 1 μM) or without (VEH) for 14 days. Relative mRNA abundance was calculated by normalizing the marker of interest to the geometric means of two housekeeping genes, GAPDH and ACTB. Nicotine was associated with a trending decrease in pre-plate marker TBR1 (A) and a significant decrease in progenitor marker EOMES (B). (C) Nicotine induced a trending, dose-dependent decrease in glutamatergic receptor GRM2. (D) Nicotine significantly downregulated the expression of GABA synthesis marker GAD1. (E) There was a significant decrease in D1R expression following nicotine exposure. Comparisons were made with one-way ANOVA or Kruskal Wallis followed by Fisher’s LSD post hoc test. Data are mean ± SEM, n = 3–7 organoids per group, ***p < 0.001, *p < 0.05, trending = p < 0.1, ns = not significant, p > 0.05.

Similar articles

References

    1. Alkam T., Nabeshima T. (2019). Prenatal nicotine exposure and neuronal progenitor cells. Neurosci. Nicotine Mech. Treat., 41–48. 10.1016/b978-0-12-813035-3.00006-x - DOI
    1. Aoyama Y., Toriumi K., Mouri A., Hattori T., Ueda E., Shimato A., et al. (2016). Prenatal nicotine exposure impairs the proliferation of neuronal progenitors, leading to fewer glutamatergic neurons in the medial prefrontal cortex. Neuropsychopharmacol 41, 578–589. 10.1038/npp.2015.186 - DOI - PMC - PubMed
    1. Blood-Siegfried J., Rende E. K. (2010). The long-term effects of prenatal nicotine exposure on neurologic development. J. Midwifery Women's Health 55, 143–152. 10.1016/j.jmwh.2009.05.006 - DOI - PMC - PubMed
    1. Brooks A. C., Henderson B. J. (2021). Systematic review of nicotine exposure’s effects on neural stem and progenitor cells. Brain. Sci. 11, 172–218. 10.3390/brainsci11020172 - DOI - PMC - PubMed
    1. Cao B. J., Li Y. (2002). Reduced anxiety- and depression-like behaviors in Emx1 homozygous mutant mice. Brain Res. 937, 32–40. 10.1016/s0006-8993(02)02461-7 - DOI - PubMed

LinkOut - more resources