. 2025 Jan 6;6(1):e70037.
doi: 10.1002/mco2.70037. eCollection 2025 Jan.

PDPN+ cancer-associated fibroblasts enhance gastric cancer angiogenesis via AKT/NF-κB activation and the CCL2-ACKR1 axis

Affiliations

PDPN+ cancer-associated fibroblasts enhance gastric cancer angiogenesis via AKT/NF-κB activation and the CCL2-ACKR1 axis

Zhenxiong Zhao et al. MedComm (2020). .

Abstract

Cancer-associated fibroblasts (CAFs) are intrinsic components of the tumor microenvironment that promote cancer progression and metastasis. Through an unbiased integrated analysis of gastric tumor grade and stage, we identified a subset of proangiogenic CAFs characterized by high podoplanin (PDPN) expression, which are significantly enriched in metastatic lesions and secrete chemokine (CC-motif) ligand 2 (CCL2). Mechanistically, PDPN(+) CAFs enhance angiogenesis by activating the AKT/NF-κB signaling pathway. The canonical NF-κB signaling protein P65 binds to the promoter region of CCL2, inducing its expression. Additionally, we found that CCL2 interacts with its nonclassical receptor ACKR1 (expressed on endothelial cells) to exert its proangiogenic effects. Furthermore, the disruption of CCL2-ACKR1 communication via a CCL2 neutralizing antibody or the inhibition of AKT signaling transduction using AKT inhibitors effectively suppressed tumor growth. Together, this study elucidates the mechanism by which PDPN(+) CAFs promote angiogenesis, providing a deeper understanding of the molecular processes underlying CAF-mediated angiogenesis and suggesting potential therapeutic targets for gastric cancer treatment.

Keywords: CCL2; PDPN; angiogenesis; cancer‐associated fibroblasts; gastric cancer.


Conflict of interest statement

The authors declare no conflicts of interest.

Figures

FIGURE 1
FIGURE 1
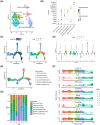
Elevated podoplanin (PDPN) levels in patient‐derived cancer‐associated fibroblasts (CAFs) correlate with tumor angiogenesis in gastric cancer (GC). (A) Hematoxylin and eosin (H&E) staining to show vascular structures within the stroma of both cancer and adjacent normal tissues. Scale bar, 100 µm. (B) Left panel: Immunohistochemical analysis of CD31 illustrating the distribution of vascular structures within the cancer nest and stroma regions. Right panel: Quantitative analysis of the percent of CD31‐positive cells, statistically evaluating the vascular density across the examined regions. Scale bar, 50 µm. (C) Immunohistochemical analysis of CD31 and fibroblast activation protein (FAP; a CAF marker) expressions in GC tissue samples with different infiltration depths, lymph node metastasis status, and distant metastasis status. Scale bar, 50 µm. (D) Positive correlation between the percent of FAP‐ and CD31‐positive cells in GC tissue samples, as determined by Pearson's correlation test. (E) Schematic representation of the workflow for sample preparation from GC patients for fibroblasts isolation and RNA‐sequencing. The scheme was drawn by Figdraw (www.figdraw.com). (F, G) Wound healing assay (F) and tube formation assay (G) performed on human umbilical vein endothelial cells (HUVECs) cultured in conditioned medium (CM) derived from normal fibroblast (NF), nonCAFs, and anCAFs (scale bar = 100 µm; **p < 0.01). (H, I) Heatmap showing significantly dysregulated genes in CAFs versus NF (H; n = 12) and in anCAFs versus nonCAFs (I; n = 6). (J) Western blots results showed the PDPN expression levels in NF, nonCAFs and anCAFs (n = 4). (K) Uniform manifold approximation and projection (UMAP) of cells representing 10 unique cell states color‐coded by their corresponding cell lineage or subtype. Each dot in the UMAP represents a single cell. (L) UMAP plot displaying PDPN expression across the total cell population. (M) Representative immunofluorescent staining for 4',6‐diamidino‐2‐phenylindole (DAPI), FAP, and PDPN in clinical GC and normal gastric tissues (scale bar = 40 µm).
FIGURE 2
FIGURE 2
The heterogeneity within fibroblast subpopulations. (A) Uniform manifold approximation and projection (UMAP) visualization of fibroblast subclusters. Each dot represents a single cell. (B) Marker genes from each fibroblast subclusters are illustrated using a dot plot. (C–F) Pseudotime cell trajectories analysis using Monocle 2 to investigate the dynamic changes in fibroblast cells. Visualization in pseudotime (C), state (D), facet wrap by state (E), and Seurat clusters (F). Pseudotime trajectory analysis results indicated activation of fibroblast activation protein (FAP) and NDUFA4L2 over the pseudotime, while the CXCL14, TCF21, and WNT5A lost their expression during the process. (G) Stack graph showed the ratio of fibroblast subsets in each state.
FIGURE 3
FIGURE 3
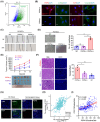
Podoplanin (PDPN)(+) cancer‐associated fibroblasts (CAFs) induce angiogenesis in vitro and in vivo. (A) PDPN(+) CAFs were sorted by fluorescence‐activated cell sorting (FACS) after incubation with FITC‐conjugated anti‐human PDPN antibody. (B) Immunofluorescent staining showing the expression PDPN, alpha‐smooth muscle actin (α‐SMA), and fibroblast activation protein (FAP) expression in PDPN(+) CAFs and PDPN(−) CAFs (scale bar = 25 µm). (C, D) Wound healing assay (C) and tube formation assay (C) performed on human umbilical vein endothelial cells (HUVECs) cultured in conditioned medium (CM) derived from PDPN(+) CAFs and PDPN(−) CAFs (scale bar = 100 µm; ***p < 0.001). (E) Tumor growth curve (upper) and representative tumor size at day 13th (lower) for each group of xenograft mice (n = 5 per group) are shown (*p < 0.05, ***p < 0.001). (F) Representative hematoxylin and eosin (H&E) staining and immunofluorescent staining images (left), along with quantitative results (right), showing CD31 expression in harvested xenograft tumors (scale bar = 40 µm; *p < 0.05). (G) Representative immunofluorescent staining for DAPI, PDPN and CD31 in clinical gastric cancer (GC) and normal gastric tissues (scale bar = 40 µm). (H) Correlation of PDPN and CD31 mRNA expression in tumor tissue samples of 407 GC patients in the TCGA dataset. (I) Correlation of PDPN and CD31 mRNA expression, detected by immunohistochemistry (IHC), in tumor tissue samples of 400 GC patients in the in‐house dataset.
FIGURE 4
FIGURE 4
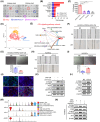
Podoplanin (PDPN)(+) cancer‐associated fibroblasts (CAFs) induce angiogenesis by secreting chemokine (CC‐motif) ligand 2 (CCL2). (A) Cytokine profiles produced by conditioned medium (CM) of PDPN(+) CAFs and PDPN(−) CAFs were examined by RayBio Human Cytokine Antibody Array. The red, blue, and purple frame represents the most significantly overexpressed cytokines. (B) Top 10 cytokines significantly upregulated in CM of PDPN(+) CAFs compared to PDPN(−) CAFs (***p < 0.001). (C) Enzyme‐linked immunosorbent assay (ELISA) results showing the amount of soluble CCL2 produced by PDPN(+) CAFs, PDPN(−) CAFs, normal fibroblasts (NFs), and human umbilical vein endothelial cells (HUVECs). (D) Uniform manifold approximation and projection (UMAP) of endothelial cells representing three unique cell states, color‐coded by their corresponding cell lineage or subtype. Each dot in the UMAP represents a single cell. (E) Circle plots showing the cellular interactions of CAFs and endothelial cells (ECs) involved in the CCL signaling pathway network in gastric cancer (GC). CAFs and ECs were the core of the cellular interaction network (edge width represents the numbers of interactions and node size represents the abundance of cell populations). (F, G) Wound healing assay (F) and tube formation assay (G) on HUVECs cultured in CM of PDPN(+) CAFs with or without a neutralizing antibody against CCL2 (anti‐CCL2). Scale bar = 100 µm; **p < 0.01. (H, I) Wound healing assay (H) and tube formation assay (I) on HUVECs treated with or without CCL2 (scale bar = 100 µm; **p < 0.01). (J) Representative immunofluorescent staining for PDPN, CCL2, and CD31 in clinical GC sample (scale bar = 40 µm). (K) Immunoblot analysis of p‐PI3K, PI3K, p‐AKT, AKT expression in HUVECs treated with CM from PDPN(+) CAFs and CCL2 neutralizing antibody (anti‐CCL2). (L) Immunoblot analysis of p‐PI3K, PI3K, p‐AKT, AKT expression in HUVECs treated with CCL2. (M) Violin plots showing the expression of genes involved in the CCL signaling pathway. CCL2 and CCL11 are primarily expressed in fibroblast subsets, while their potential receptor ACKR1, is predominantly expressed in endothelial cells. (N) Immunoblot analysis of p‐PI3K, PI3K, p‐AKT, AKT expression in HUVECs with indicated treatment.
FIGURE 5
FIGURE 5
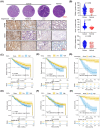
High expression of podoplanin (PDPN), CD31 and chemokine (CC‐motif) ligand 2 (CCL2) in gastric cancer (GC) is associated with poor prognosis. (A) Representative hematoxylin and eosin (H&E) and immunohistochemical images showing PDPN, CD31, and CCL2 protein expression in GC and normal gastric mucus; (B) Semiquantitative analysis of PDPN, CD31, and CCL2 protein expression between GC and normal gastric mucosa; (C–H) Kaplan–Meier survival curves with log‐rank tests depicting disease‐free survival (C, E, G) and overall survival (D, F, H) of GC patients (n = 400) based on the expression levels of PDPN, CCL2, and intersection of all three proteins in cancer tissues in the in‐house cohort.
FIGURE 6
FIGURE 6
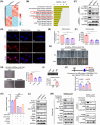
Podoplanin (PDPN) regulates NF‐κB activity in cancer‐associated fibroblasts (CAFs) through AKT/IKK signaling, leading to chemokine (CC‐motif) ligand 2 (CCL2) secretion. (A) Heatmap representing significantly dysregulated genes from RNA‐seq analysis of PDPN(+) CAFs and PDPN(−) CAFs (n = 3). (B) Pathway analysis of differentially expressed genes enriched in PDPN(+) CAFs compared to PDPN(−) CAFs. (C) Immunoblot analysis of nuclear and cytoplasmic p‐P65 and P65 protein expression in PDPN(+) CAFs, PDPN(−) CAFs and normal fibroblasts (NFs). (D) Representative immunofluorescent staining of p‐P65 in PDPN(+) CAFs, PDPN(−) CAFs, and NFs (scale bar = 25 µm). (E) Quantitative reverse transcription polymerase chain reaction (qRT‐PCR) results showing the differential mRNA expression levels of CCL2 in PDPN(+) CAFs transfected with P65 siRNA or control siRNA (n = 3; **p < 0.01). (F) Enzyme‐linked immunosorbent assay (ELISA) results showing the amount of soluble CCL2 in conditioned medium (CM) from PDPN(+) CAFs transfected with P65 siRNA or control siRNA (**p < 0.01). (G, H) Wound healing assay (G) and tube formation assay (H) on human umbilical vein endothelial cells (HUVECs) treated with CM from PDPN(+) CAFs transfected with P65 siRNA or control siRNA (scale bar = 100 µm; **p < 0.01). (I) Chromatin immunoprecipitation (ChIP) assay was performed to verify P65 binding to the CCL2 promoter. CCL2 promoter segments were quantified using qRT‐PCR, with results normalized against IgG. Data are presented as the mean ± SD from three independent experiments is presented (***p < 0.001). (J) Top: Schematic representation of the CCL2 reporter construct. The consensus P65 binding sequences are marked as with blue box. The consensus sequence and the putative P65 binding site sequences are shown. Bottom: Effects of ectopic expression of P65 siRNA on wild type (WT) and mutant (MUT) CCL2 promoter reporter activity (**p < 0.01). (K) Effects of ectopic expression of P65 siRNA (siP65#1), AKT inhibitors perifosine (10 µmol/L), NF‐κB inhibitor pyrrolidine dithiocarbamate (PDTC, 0.05 µmol/L) on CCL2 promoter reporter activity (**p < 0.01). (L) Immunoblot analysis of AKT/IKK pathway in PDPN(+) CAFs, PDPN(−) CAFs and NFs. (M) Immunoblot analysis of AKT/IKK/NF‐κB pathway and nuclear/cytoplasmic distribution of P65 in PDPN(+) CAFs treated with or without perifosine (10 µmol/L) and LY294002 (20 µmol/L) for 24 h.
FIGURE 7
FIGURE 7
Targeting podoplanin (PDPN)(+) cancer‐associated fibroblasts (CAFs) restrains angiogenesis via inhibiting AKT/NF‐κB signaling. (A) Schematic diagram of in vivo animal experiment. (B) Tumor image (left) and tumor growth curve (right) of xenografted mice inoculated with HGC27 cells and PDPN(+) CAFs pretreated with or without perifosine (10 µmol/L) and Bay117082 (10 µmol/L; ***p < 0.001). (C) Representative images of hematoxylin and eosin (H&E) and immunofluorescent staining for CD31 as indicated in the xenografted tumors (scale bar = 40 µm; *p < 0.05). (D) Schematic view of the proposed mechanism. A schematic diagram illustrating the proposed mechanism by which PDPN(+) CAFs‐derived chemokine (CC‐motif) ligand 2 (CCL2) promotes angiogenesis in gastric cancer (GC). The Akt/NF‐κB pathway was significantly activated in PDPN(+) CAFs. P65 directly bind to the CCL2 promoter, thereby increasing the CCL2 transcription and secretion in CAFs; CCL2, which was transcriptional activated by P65 in PDPN(+) CAFs, sustains tumor angiogenesis by interacting with ACKR1 and activating PI3K/AKT signaling in endothelial cells. The scheme was drawn by biorender (https://biorender.com/).

References

    1. Bray F, Ferlay J, Soerjomataram I, Siegel RL, Torre LA, Jemal A. Global cancer statistics 2018: GLOBOCAN estimates of incidence and mortality worldwide for 36 cancers in 185 countries. CA Cancer J Clin. 2018;68(6):394‐424. - PubMed
    1. Shah MA. Update on metastatic gastric and esophageal cancers. J Clin Oncol. 2015;33(16):1760‐1769. - PubMed
    1. Claesson‐Welsh L, Welsh M. VEGFA and tumour angiogenesis. J Intern Med. 2013;273(2):114‐127. - PubMed
    1. Nienhüser H, Schmidt T. Angiogenesis and anti‐angiogenic therapy in gastric cancer. Int J Mol Sci. 2017;19(1):43. - PMC - PubMed
    1. Kang Y‐K, Kang W, Di Bartolomeo M, et al. Randomized phase III ANGEL study of rivoceranib (apatinib)+ best supportive care (BSC) vs placebo+ BSC in patients with advanced/metastatic gastric cancer who failed≥ 2 prior chemotherapy regimens. Ann Oncol. 2019;30:v877‐v878.

LinkOut - more resources