. 2025 Jan;31(1):e70191.
doi: 10.1111/cns.70191.

Impact of LITAF on Mitophagy and Neuronal Damage in Epilepsy via MCL-1 Ubiquitination

Affiliations

Impact of LITAF on Mitophagy and Neuronal Damage in Epilepsy via MCL-1 Ubiquitination

Fuli Min et al. CNS Neurosci Ther. 2025 Jan.

Abstract

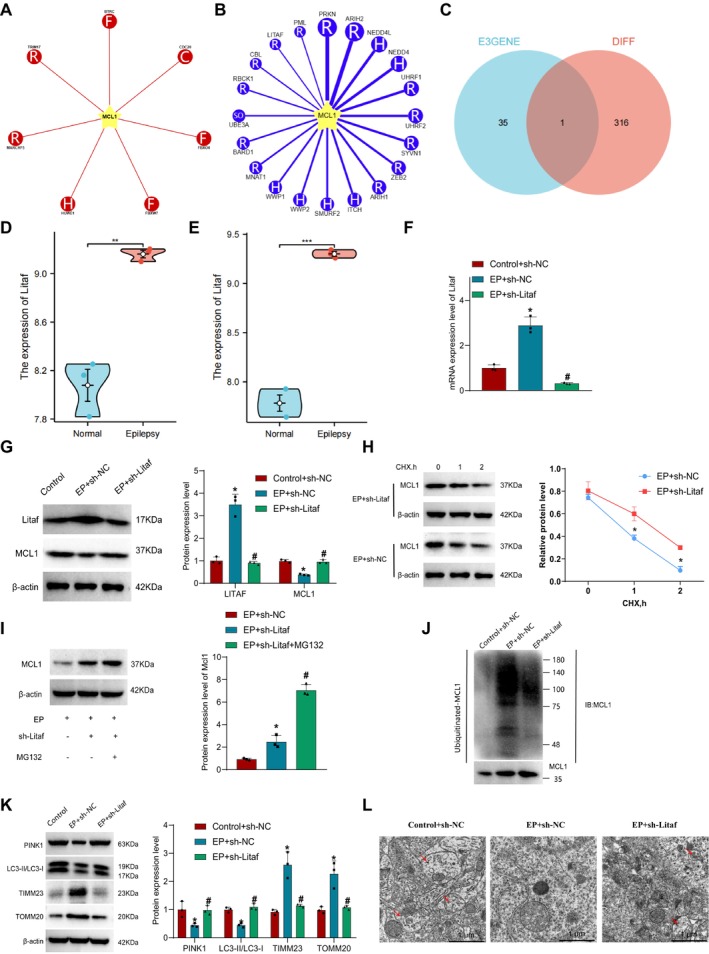
Objective: This study aims to investigate how the E3 ubiquitin ligase LITAF influences mitochondrial autophagy by modulating MCL-1 ubiquitination, and its role in the development of epilepsy.

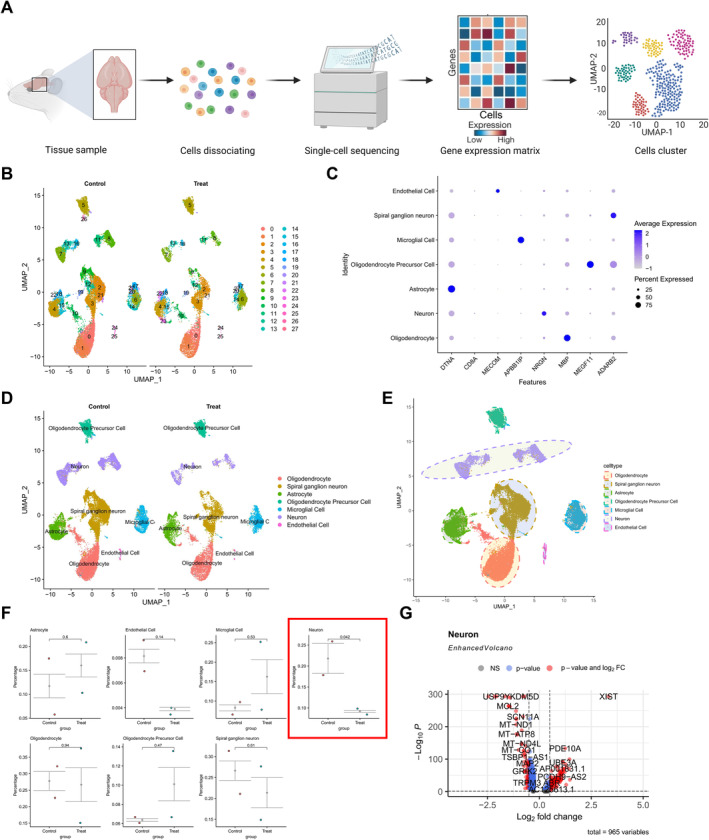
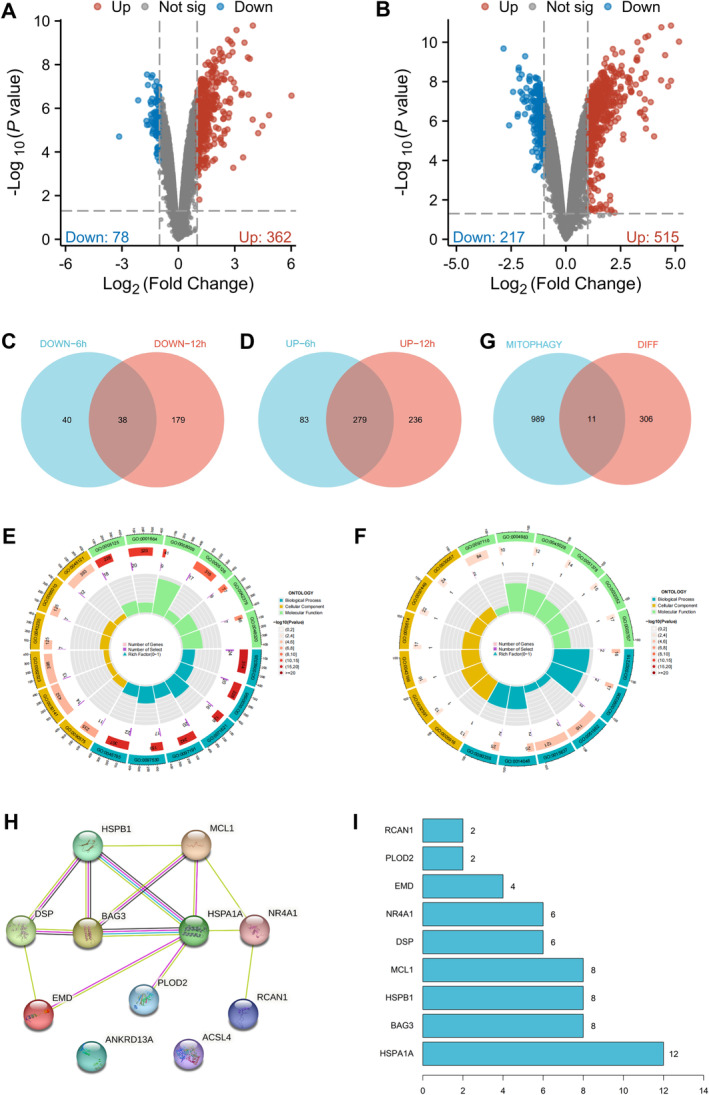
Methods: Employing single-cell RNA sequencing (scRNA-seq) to analyze brain tissue from epilepsy patients, along with high-throughput transcriptomics, we identified changes in gene expression. This was complemented by in vivo and in vitro experiments, including protein-protein interaction (PPI) network analysis, western blotting, and behavioral assessments in mouse models.

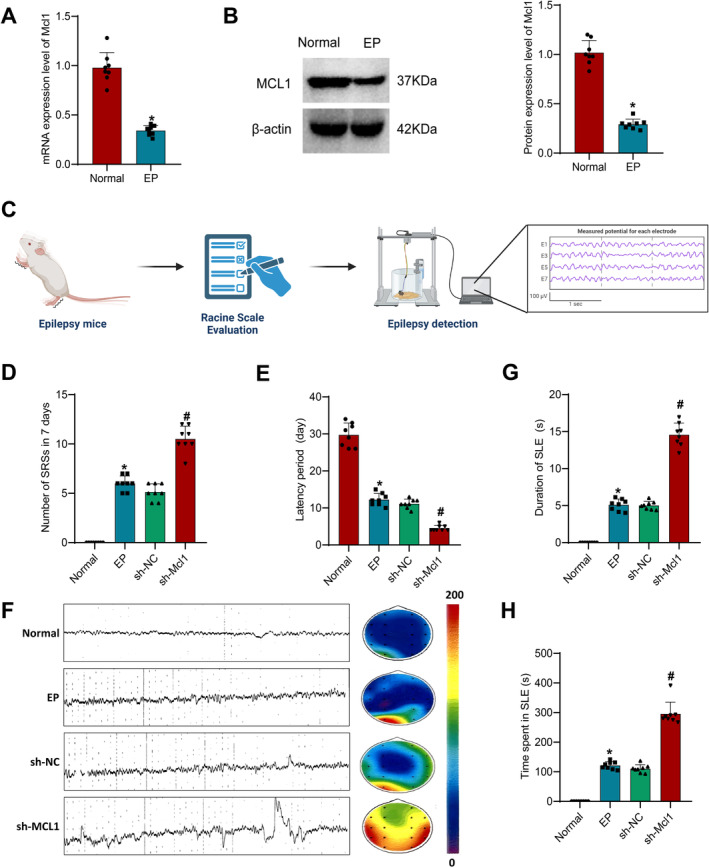
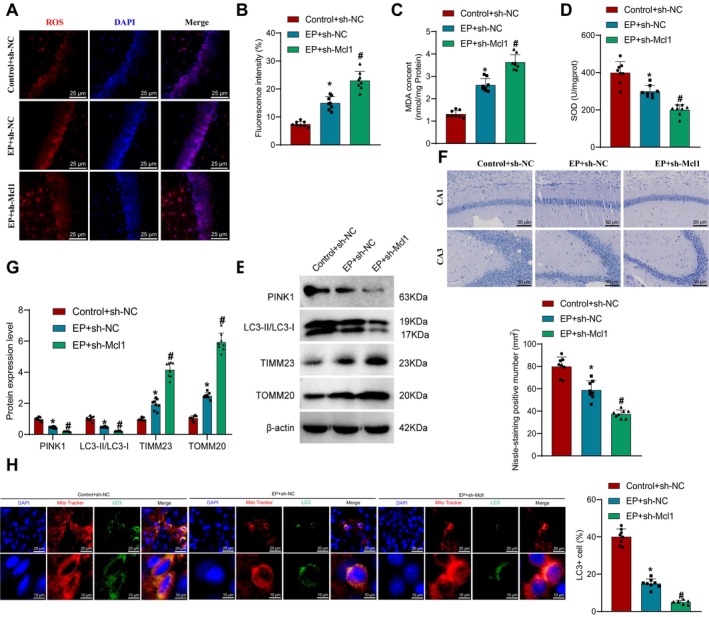
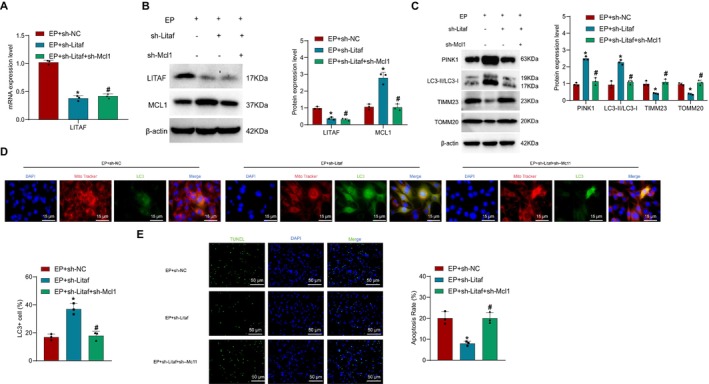
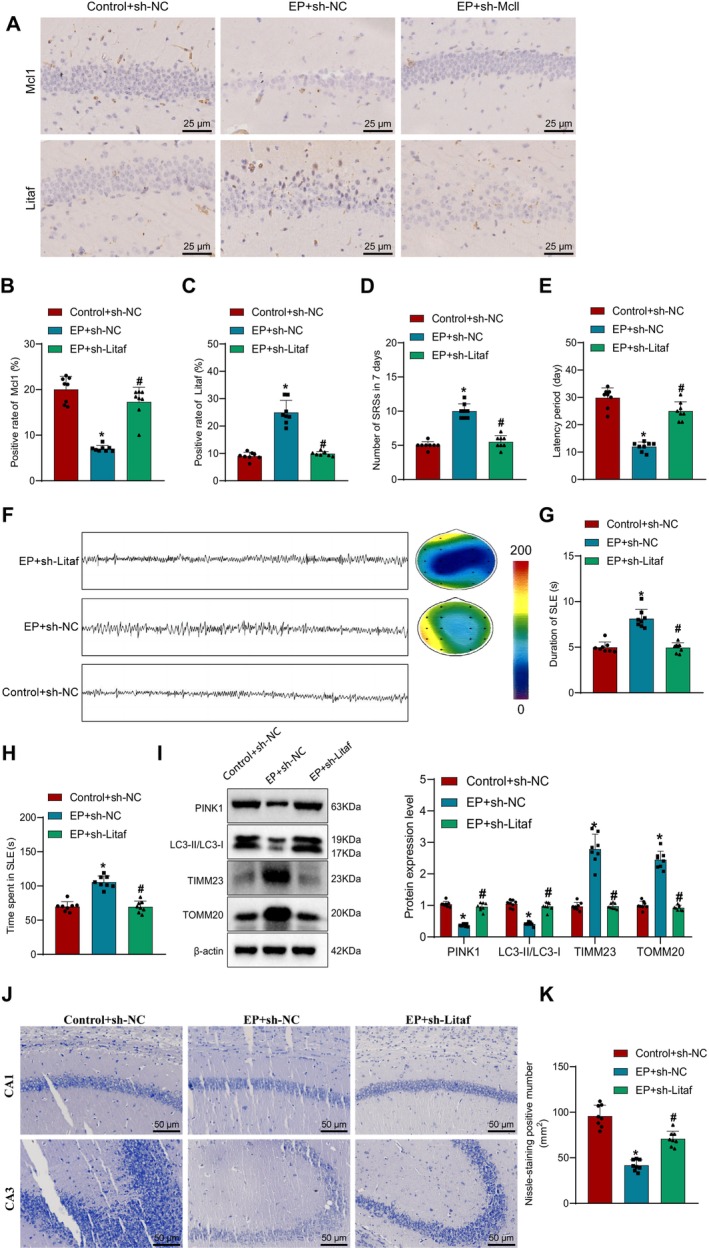
Results: Neuronal cells in epilepsy patients exhibited significant gene expression alterations, with increased activity in apoptosis-related pathways and decreased activity in neurotransmitter-related pathways. LITAF was identified as a key upregulated factor, inhibiting mitochondrial autophagy by promoting MCL-1 ubiquitination, leading to increased neuronal damage. Knockdown experiments in mouse models further confirmed that LITAF facilitates MCL-1 ubiquitination, aggravating neuronal injury.

Conclusion: Our findings demonstrate that LITAF regulates MCL-1 ubiquitination, significantly impacting mitochondrial autophagy and contributing to neuronal damage in epilepsy. Targeting LITAF and its downstream mechanisms may offer a promising therapeutic strategy for managing epilepsy.

Keywords: LPS‐induced TNF‐alpha factor; MCL1; epilepsy; mitochondrial autophagy; neuroprotection; ubiquitination regulation.


Conflict of interest statement

The authors declare no conflicts of interest.

Figures

FIGURE 1
FIGURE 1
Cell clustering and annotation of scRNA‐Seq Data. (A) Schematic diagram of single‐cell data sample acquisition and analysis process; (B) Visualization of UMAP clustering results showing the cell aggregation and distribution in healthy samples (Control, N = 2) and EP samples (Treat, N = 2), with each color representing a cluster; (C) Expression of known lineage‐specific marker genes in different clusters of healthy samples (Control, N = 2) and EP samples (Treat, N = 2), where deeper blue indicates higher average expression levels, and larger circles represent more cells expressing the gene; (D) Visualization of cell annotation results in healthy group (N = 2) and EP group (N = 2) based on UMAP clustering, with each color representing a cell subtype; (E) Circular visualization of UMAP clustering results showing the cell aggregation and distribution in healthy and EP samples; (F) Significance levels of cell content differences between healthy group (N = 2) and EP group (N = 2) analyzed by T‐test, where the p‐values denote the significance of intergroup cell content differences; (G) Volcano plot of differentially expressed genes between Neuron cells in healthy group (N = 2) and EP group (N = 2) samples, where red dots on the left of the dashed line represent genes highly expressed in EP group samples, and dots on the right represent genes with low expression in EP group samples.
FIGURE 2
FIGURE 2
Identification of key regulators of mitophagy in the pathogenesis of EP. (A) Volcano plot showing differential gene expression in the hippocampus of mice at 6 h post‐injection, with blue dots indicating downregulated genes, red dots indicating upregulated genes, and gray dots indicating no significant difference, n = 3; (B) Volcano plot showing differential gene expression in the hippocampus of mice at 12 h post‐injection, with color coding as in (A); (C) Venn diagram depicting the intersection of downregulated genes in the hippocampus of mice at 6 and 12 h; (D) Venn diagram depicting the intersection of upregulated genes in the hippocampus of mice at 6 and 12 h; (E) Enrichment analysis results of intersecting upregulated genes, with color representation of GO categories (BP in blue, CC in green, MF in red, darker colors indicating more significant enrichment); (F) Enrichment analysis results of intersecting downregulated genes, following the same color scheme as in (E); (G) Venn diagram showing the intersection of differentially expressed genes with genes related to mitophagy retrieved from the GeneCard online database; (H) PPI network graph of proteins encoded by significantly differentially expressed genes related to mitophagy; (I) Bar graph depicting the top 10 genes ranked by node count in the PPI network of significantly differentially expressed genes related to mitophagy.
FIGURE 3
FIGURE 3
The expression of MCL1 and its impact on the onset of EP. (A) RT‐qPCR analysis of Mcl1 mRNA expression in the hippocampal tissues of normal mice and mice with EP; (B) Western Blot experiment investigating the protein expression of Mcl1 in the hippocampal tissues of normal mice and mice with EP; (C) Flowchart of the EP detection process in mice; (D) Spontaneous seizure frequency visible to the naked eye under behavioral monitoring, graded using the Racine scale; (E) Latency period of EP occurrence; (F) Local field potential spectra of mice in each group, with the heatmap on the right showing the frequency changes in brain electrical activity over time, where red indicates high‐intensity electrical activity; (G) Duration of EP in each group of mice; (H) Total duration of EP in each group of mice. * indicates a significance level of p < 0.05 compared to the Normal group; # indicates a significance level of p < 0.05 compared to the sh‐NC group. Mouse experiments, n = 8.
FIGURE 4
FIGURE 4
Impact of MCL1 on neuronal injury. (A) Evaluation of ROS levels in the hippocampal tissue of mice in each group using the DCFH‐DA probe method. ROS is represented in red, while DAPI is represented in blue. Scale bar = 25 μm; (B) Quantitative analysis of ROS detection fluorescence. Five independent fields were assessed per group, n = 5; (C) Measurement of MDA content in the hippocampal tissue using a commercial assay kit; (D) Detection of SOD levels in the hippocampal tissue of mice using a commercial assay kit; (E) Evaluation of the expression of key mitophagy proteins (PINK1, LC3‐I, LC3‐II, TIMM23, TOMM20) in the hippocampal tissue of mice through Western Blot; (F) Assessment of neuronal status and Nissl body count using Nissl staining method. Scale bar = 50 μm; (G) Statistical analysis of Nissl body counts observed under a microscope. Five independent fields were counted per group, n = 5; (H) Co‐localization of mitochondria and LC3 in neuronal cells of each group observed by confocal laser microscopy (scale bar: 25 μm). * indicates significant difference compared to the Control + sh‐NC group, p < 0.05, # indicates significant difference compared to the EP + sh‐NC group, p < 0.05. n = 8 for mouse experiments.
FIGURE 5
FIGURE 5
The impact of LITAF on MCL Ub and mitophagy. (A) Seven E3 ubiquitin ligases confirmed to regulate MCL1 Ub obtained from the Ubibrowser database; (B) Twenty‐nine E3 ubiquitin ligases potentially regulating MCL1 Ub obtained from the Ubibrowser database; (C) Venn diagram showing the intersection of identified E3 ubiquitin ligases regulating MCL1 with differentially expressed genes; (D) Expression of Litaf in the mouse hippocampus at 6 h post‐injection; (E) Expression of Litaf in the mouse hippocampus at 12 h post‐injection, n = 3; (F) RT‐qPCR analysis of Litaf mRNA expression in isolated neuronal cells; (G) Western Blot analysis of Litaf and MCL1 protein expression in isolated neuronal cells; (H) Protein imprinting assay to detect MCL1 protein levels in neuronal cells treated with the protein synthesis inhibitor CHX; (I) Examination of MCL1 protein expression after treatment with the proteasome inhibitor MG132 using protein imprinting; (J) Immunoblot analysis of MCL1 Ub levels in neuronal cells; (K) Western Blot analysis of key proteins involved in mitophagy in isolated neuronal cells; (L) Transmission electron microscopy observation of the morphology of neurons and mitochondria in the hippocampal tissue, scale bar = 1μm. * indicates p < 0.05 compared to the Control+sh‐NC group, ** represents p < 0.01 compared to the Normal group; *** signifies p < 0.001 compared to the Normal group, # indicates p < 0.05 compared to the EP + sh‐NC group. All cell experiments were repeated three times.
FIGURE 6
FIGURE 6
Impact of LITAF regulation on MCL Ub on mitophagy and neuronal cell Apoptosis. (A) RT‐qPCR experiments to measure the expression levels of LITAF in neuronal cells of each group; (B) Western blot experiments to examine the expression levels of LITAF and MCL1 in neuronal cells of each group; (C) Western blot experiments to assess the expression of key proteins related to mitophagy in isolated neuronal cells; (D) Co‐localization results of mitochondria and LC3 in neuronal cells of each group observed by confocal laser scanning microscopy (scale bar: 15 μm); (E) TUNEL assay to determine the apoptosis rate of neuronal cells in each group (Scale bar = 50 μm). * indicates significant difference compared to the EP + sh‐NC group, p < 0.05, # indicates significant difference compared to the EP + sh‐Litaf group, p < 0.05. The cell experiments were repeated three times.
FIGURE 7
FIGURE 7
Investigation of LITAF promoting MCL‐1 Ub and activating mitophagy in influencing epileptic seizures. (A) Immunohistochemistry detection of protein expression of Mcl1 and Litaf in mouse hippocampal tissue, scale bar = 25 μm; (B) Statistical chart of positive protein expression of Mcl1; (C) Statistical chart of positive protein expression of Litaf; (D) Spontaneous EP seizure frequency visible to the naked eye under behavioral monitoring, grading can be done using the Racine scale; (E) Latency period of EP occurrence; (F) Local field potential spectra in various groups of mice; (G) Duration of EP in different groups of mice; (H) Total duration of EP in different groups of mice; (I) Expression of key proteins of mitophagy in neuron cells separated by Western Blot experiment; (J) Assessment of neuron status and Nissl body quantity using Nissl staining method; (K) Statistical chart of Nissl body quantity observed under a microscope. * indicates p < 0.05 compared to the Control+sh‐NC group; # indicates p < 0.05 compared to the EP + sh‐NC group. Experimental sample size n = 8 mice.

Similar articles

Cited by

References

    1. Klamer S., Ethofer T., Torner F., et al., “Unravelling the Brain Networks Driving Spike‐Wave Discharges in Genetic Generalized Epilepsy‐Common Patterns and Individual Differences,” Epilepsia Open 3, no. 4 (2018): 485–494, 10.1002/epi4.12252. - DOI - PMC - PubMed
    1. Falco‐Walter J., “Epilepsy‐Definition, Classification, Pathophysiology, and Epidemiology,” Seminars in Neurology 40, no. 6 (2020): 617–623, 10.1055/s-0040-1718719. - DOI - PubMed
    1. Thijs R. D., Surges R., O'Brien T. J., and Sander J. W., “Epilepsy in Adults,” Lancet 393, no. 10172 (2019): 689–701, 10.1016/S0140-6736(18)32596-0. - DOI - PubMed
    1. Beghi E., Giussani G., and Sander J. W., “The Natural History and Prognosis of Epilepsy,” Epileptic Disorders 17, no. 3 (2015): 243–253, 10.1684/epd.2015.0751. - DOI - PubMed
    1. Zhong W., Johnson C. M., Cui N., Xing H., Wu Y., and Jiang C., “Effects of Chronic Exposure to Low Dose THIP on Brainstem Neuronal Excitability in Mouse Models of Rett Syndrome: Evidence From Symptomatic Females,” Neuropharmacology 116 (2017): 288–299, 10.1016/j.neuropharm.2017.01.002. - DOI - PubMed

MeSH terms