

The miRNA-mRNA Regulatory Network in Human Hepatocellular Carcinoma by Transcriptomic Analysis From GEO
- PMID: 39764737
- PMCID: PMC11705453
- DOI: 10.1002/cnr2.70098
The miRNA-mRNA Regulatory Network in Human Hepatocellular Carcinoma by Transcriptomic Analysis From GEO
Abstract
Background: Bioinformatics analysis of hepatocellular carcinoma (HCC) expression profiles can aid in understanding its molecular mechanisms and identifying new targets for diagnosis and treatment.
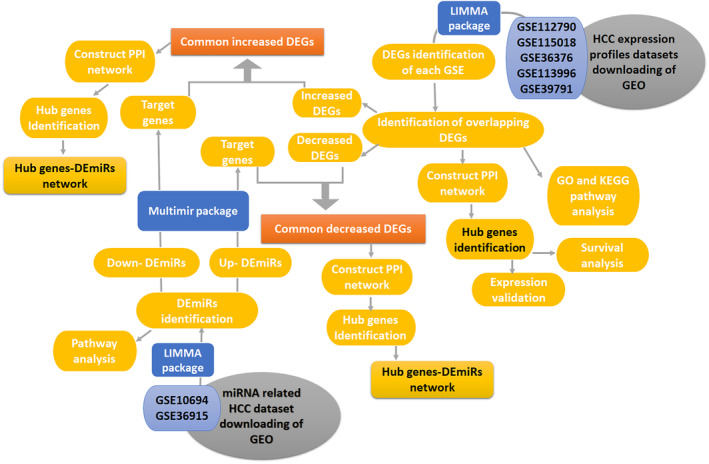
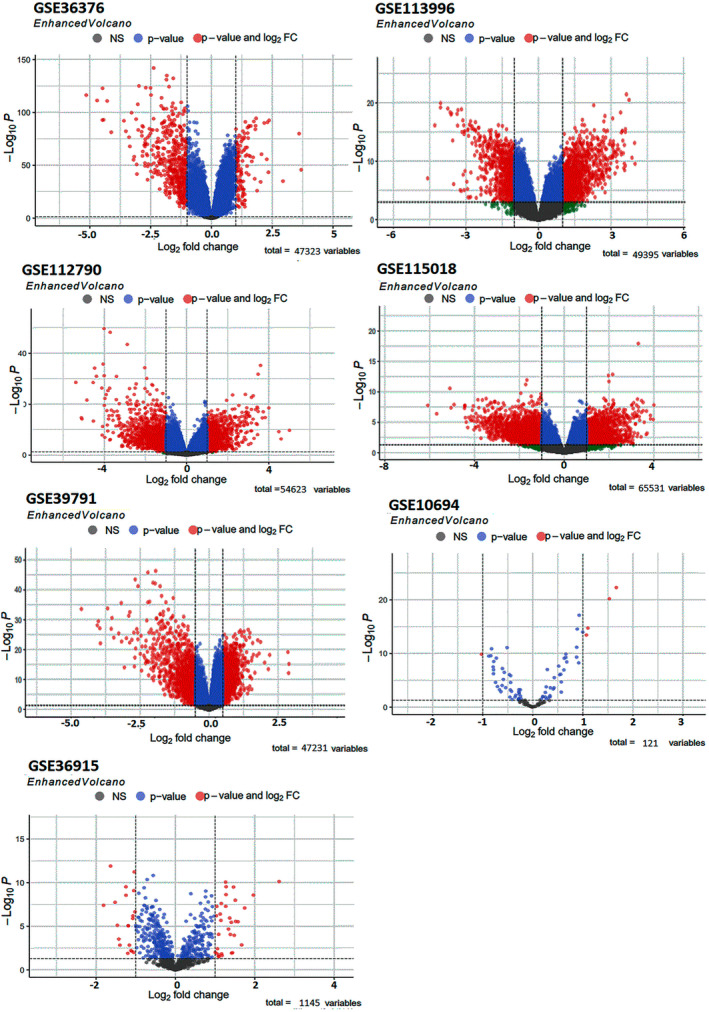
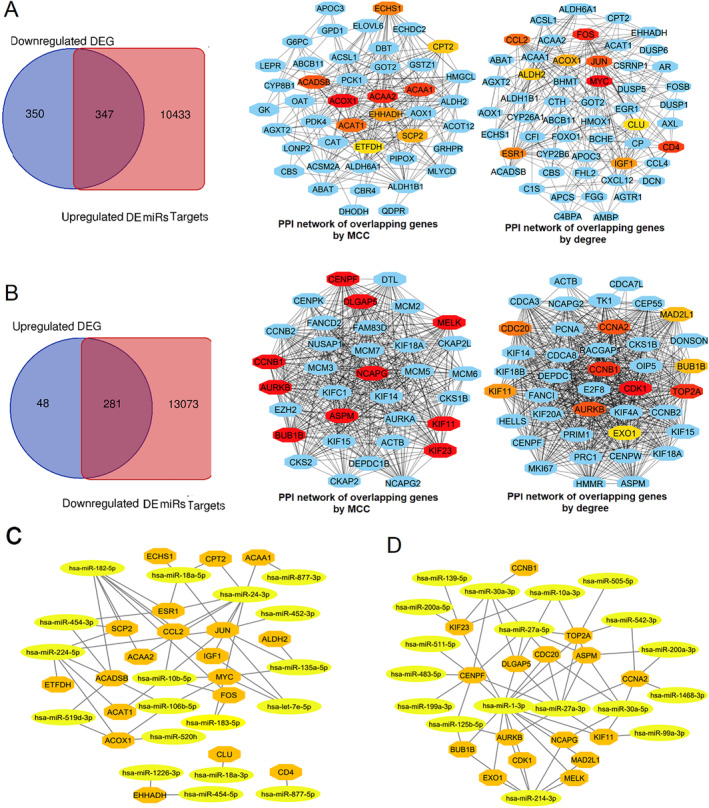
Aim: In this study, we analyzed expression profile datasets and miRNA expression profiles related to HCC from the GEO using R software to detect differentially expressed genes (DEGs) and differentially expressed miRNAs (DEmiRs).
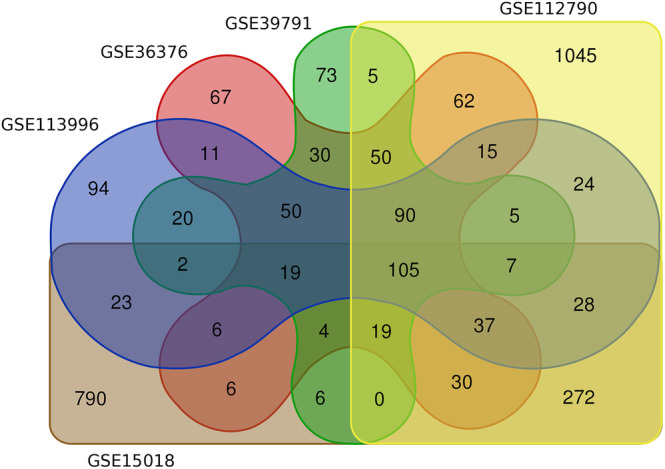
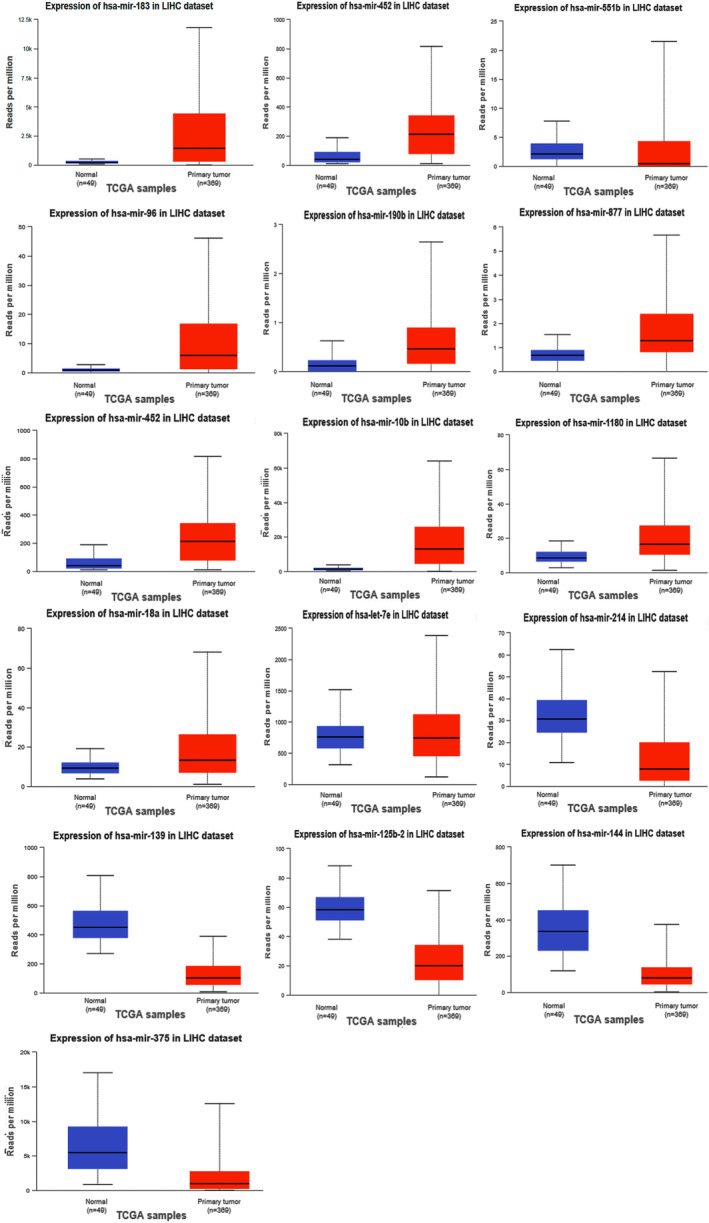
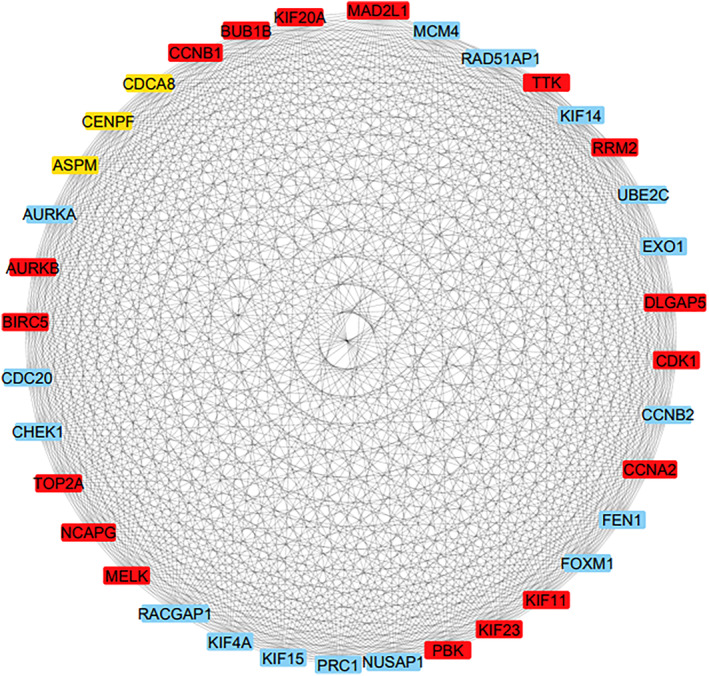
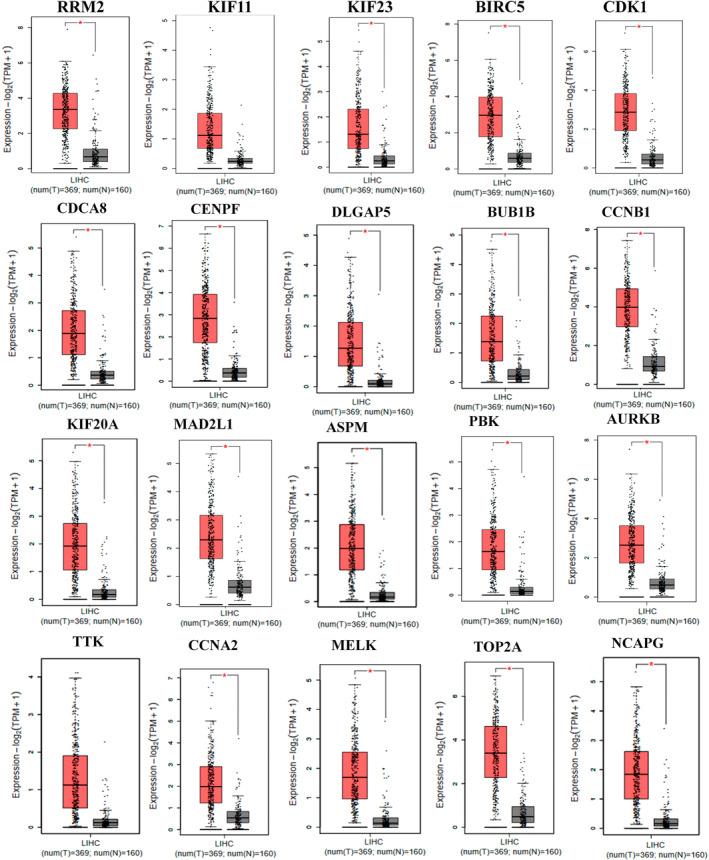
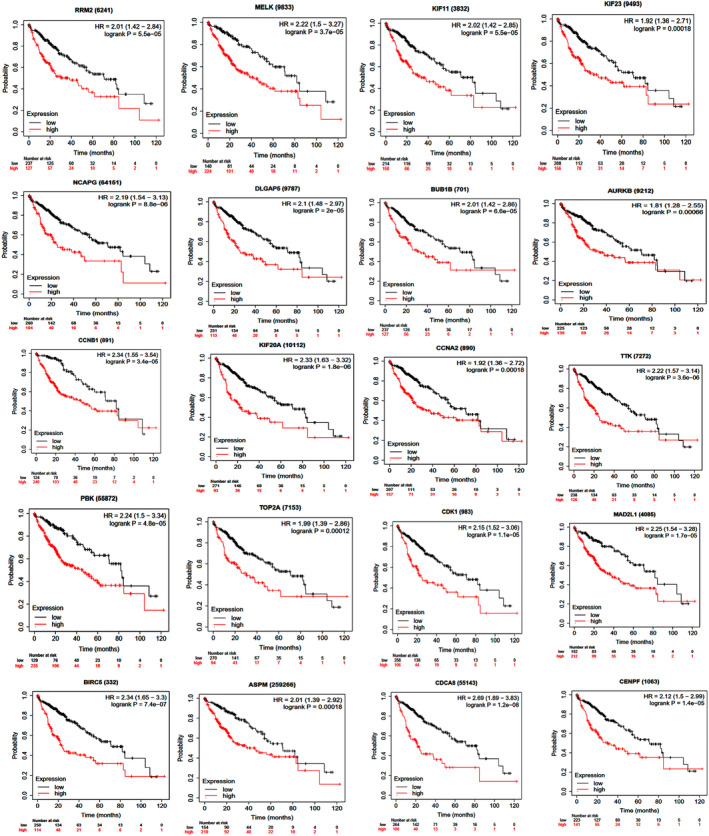
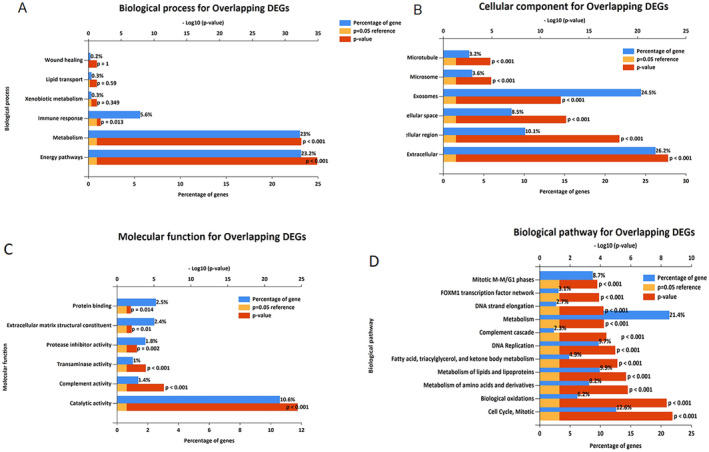
Methods and results: Common DEGs were identified, and a PPI network was constructed using the STRING database and Cytoscape software to identify hub genes. The reduced levels of tumor suppressor miRNAs or down regulated DEmiRs may be increased levels of oncogenes, the oncomirs or up regulated DEmiRs may be decreased levels of tumor suppressor genes in cancerous cells. According to this strategy, increased and decreased DEGs, also increased and decreased DEmiRs were selected. The multimir package was employed to predict target genes for DEmiRs then DEmiRs-hub gene network created. We identified approximately 1000 overlapping DEGs and 60 DEmiRs. Hub genes included RRM2, MELK, KIF11, KIF23, NCAPG, DLGAP5, BUB1B, AURKB, CCNB1, KIF20A, CCNA2, TTK, PBK, TOP2A, CDK1, MAD2L1, BIRC5, ASPM, CDCA8, and CENPF, all associated with significantly worse survival in HCC. miR-224, miR-24, miR-182, miRNA-1-3p, miR-30a, miR-27a, and miR-214 were identified as important DEmiRs with targeting more than six hub genes.
Conclusion: Generally, our findings offer insight into the interaction of hub genes and miRNAs in the development of HCC by bioinformatics analysis, information that may prove useful in identifying biomarkers and therapeutic targets in HCC.
Keywords: HCC; bioinformatics; biomarker; hepatocellular carcinoma; microRNA; microarray.
© 2025 The Author(s). Cancer Reports published by Wiley Periodicals LLC.
Conflict of interest statement
The authors declare no conflicts of interest.
Figures
Similar articles
-
Deciphering the Molecular Complexity of Hepatocellular Carcinoma: Unveiling Novel Biomarkers and Therapeutic Targets Through Advanced Bioinformatics Analysis.Cancer Rep (Hoboken). 2024 Aug;7(8):e2152. doi: 10.1002/cnr2.2152. Cancer Rep (Hoboken). 2024. PMID: 39118438 Free PMC article.
-
Integrated Bioinformatics Analysis for the Screening of Hub Genes and Therapeutic Drugs in Hepatocellular Carcinoma.Curr Pharm Biotechnol. 2023;24(8):1035-1058. doi: 10.2174/1389201023666220628113452. Curr Pharm Biotechnol. 2023. PMID: 35762549
-
Screening Hub Genes as Prognostic Biomarkers of Hepatocellular Carcinoma by Bioinformatics Analysis.Cell Transplant. 2019 Dec;28(1_suppl):76S-86S. doi: 10.1177/0963689719893950. Epub 2019 Dec 11. Cell Transplant. 2019. PMID: 31822116 Free PMC article.
-
Bioinformatics Analysis of Candidate Genes and Pathways Related to Hepatocellular Carcinoma in China: A Study Based on Public Databases.Pathol Oncol Res. 2021 Mar 26;27:588532. doi: 10.3389/pore.2021.588532. eCollection 2021. Pathol Oncol Res. 2021. PMID: 34257537 Free PMC article.
-
A comprehensive review and in silico analysis of the role of survivin (BIRC5) in hepatocellular carcinoma hallmarks: A step toward precision.Int J Biol Macromol. 2025 Jun;311(Pt 1):143616. doi: 10.1016/j.ijbiomac.2025.143616. Epub 2025 Apr 28. Int J Biol Macromol. 2025. PMID: 40306500 Review.
Cited by
-
Selenium protected NMRI mice against methotrexate induced testicular injury : Selenium effectiveness in methotrexate treated testis.Sci Rep. 2025 Jul 8;15(1):24448. doi: 10.1038/s41598-025-09728-y. Sci Rep. 2025. PMID: 40629028 Free PMC article.
References
-
- Cavalcante D. F., Garcia É. M., Farias N. S. O., Koizumi I. K., Figueiredo G. M., and Sato A. P. S., “Mortality due to Hepatocellular Carcinoma Associated With Hepatitis B and C Viruses in the State of São Paulo, Brazil,” Revista Brasileira de Epidemiologia 25 (2022): e220004. - PubMed
-
- Kobayashi K., Sugimoto T., Makino H., et al., “Screening Methods for Early Detection of Hepatocellular Carcinoma,” Hepatology 5, no. 6 (1985): 1100–1105. - PubMed
MeSH terms
Substances
Grants and funding
LinkOut - more resources
Full Text Sources
Medical
Research Materials
Miscellaneous
