. 2024 Dec 14;14(24):3606.
doi: 10.3390/ani14243606.

Comparison of Fecal Microbiota and Metabolites Between Captive and Grazing Male Reindeer

Affiliations

Comparison of Fecal Microbiota and Metabolites Between Captive and Grazing Male Reindeer

Fei Zhao et al. Animals (Basel). .

Abstract

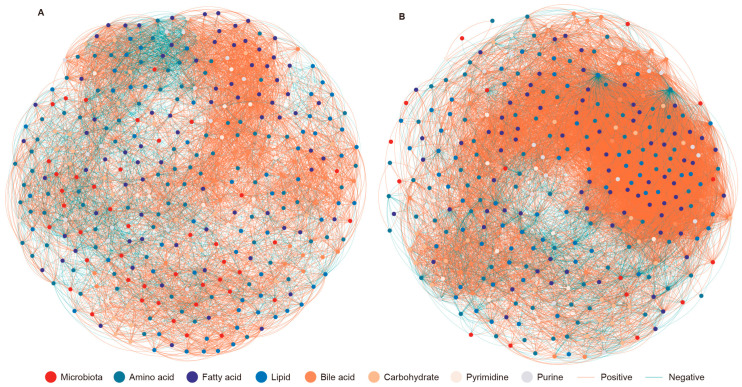
The reindeer (Rangifer tarandus) is a circumpolar member of the Cervidae family, and has adapted to a harsh environment. Summer is a critical period for reindeer, with peak digestibility facilitating body fat accumulation. The gut microbiota plays a pivotal role in nutrient metabolism, and is affected by captivity. However, differences in the composition of the gut microbiota and metabolites between captive and grazing reindeer during summer remain poorly understood. Here, we conducted a comparative study of the fecal microbiota and metabolites between captive (n = 6) and grazing (n = 6) male reindeer, using full-length 16S rRNA gene sequencing and gas chromatography-time-of-flight mass spectrometry, respectively. Our results indicated that Prevotella, Phocaeicola, Papillibacter, Muribaculum, and Bacteroides were the predominant genera in the feces of reindeer. However, microbial diversity was significantly higher in captive reindeer compared to their grazing counterparts. Principal coordinate analysis revealed significant differences in the fecal microbiota between captive and grazing reindeer. In captive reindeer, the relative abundances of the genera Clostridium, Paraprevotella, Alistipes, Paludibacter, Lentimicrobium, Paraclostridium, and Anaerovibrio were significantly higher, while those of the genera Prevotella, Phocaeicola, Pseudoflavonifractor, and Lactonifactor were significantly lower. A comparison of predicted functions indicated that pathways involved in fat digestion and absorption, histidine metabolism, lysine biosynthesis, and secondary bile acid biosynthesis were more abundant in captive reindeer, whereas the pathways of fructose and mannose metabolism and propanoate metabolism were less abundant. An untargeted metabolomic analysis revealed that 624 metabolites (e.g., amino acids, lipids, fatty acids, and bile acids) and 645 metabolites (e.g., carbohydrates and purines) were significantly increased in the feces of captive and grazing reindeer, respectively. In conclusion, we unveiled significant differences in fecal microbiota and metabolites between captive and grazing male reindeer, with the results suggesting a potentially enhanced ability to utilize plant fibers in grazing reindeer.

Keywords: captivity; full-length 16S rRNA gene; metabolome; reindeer; summer.


Conflict of interest statement

The authors declare no conflicts of interest.

Figures

Figure 1
Figure 1
Microbial community composition and diversity in the feces of captive and grazing reindeer. Microbial community composition in the feces of the Cap and Gra groups at the phylum (A) and genus (B) levels. (C) A comparison of alpha-diversity indices in feces between the Cap and Gra groups. (D) PCoA illustrating the differences in microbial community membership and structure in reindeer feces between the Cap and Gra groups at the OTU level, based on Bray–Curtis dissimilarity, Unweighted UniFrac distance, and Weighted UniFrac distance. * p < 0.05.
Figure 2
Figure 2
The significantly different genera in the feces of captive and grazing reindeer. (A) A Venn diagram illustrating genera that were common and unique to the Cap and Gra groups. (B) A heatmap depicting the significantly different genera in feces between the Cap and Gra groups. Individuals are shaded from blue to red to represent relative abundances (low to high). * p < 0.05 and ** p < 0.01.
Figure 3
Figure 3
A comparison of the potential functions of microbes in the feces of captive and grazing reindeer. (A) PCoA illustrating the variation in microbial functions at KEGG level 3, based on the Bray–Curtis dissimilarity matrix, in feces between the Cap and Gra groups. (B) A heatmap showing the significantly different metabolic pathways of fecal microbiota between the Cap and Gra groups. Individuals are shaded from blue to red to indicate relative abundances (low to high). * p < 0.05 and ** p < 0.01.
Figure 4
Figure 4
Differences in fecal metabolites between captive and grazing reindeer. (A) A pie chart illustrating the classification of identified metabolites in feces. (B) PCA and PLS-DA plots highlighting the differences in fecal metabolites between the Cap (blue) and Gra (red) groups. (C) A comparison of the total concentrations of lipids, fatty acids, bile acids, carbohydrates, purines, pyrimidines, and amino acids between the Cap and Gra groups. (D) Volcano plots depicting the significantly different metabolites in feces between the Cap and Gra groups. (E) A heatmap showing the significantly different metabolites in reindeer feces when comparing the Gra group to the Cap group. Individuals are shaded from yellow to purple to indicate concentrations (low to high). (F) A lollipop chart displaying the enriched metabolic pathways of significantly different metabolites. * p < 0.05 and ** p < 0.01.
Figure 5
Figure 5
The co-occurrence of significantly different microbiota and metabolites in the feces of captive (A) and grazing (B) reindeer. The Spearman correlation coefficient (|rho| > 0.8 and p ≤ 0.05) was calculated from the abundances of microbiota and the concentrations of metabolites. Node colors indicate microbiota and metabolites, with yellow and blue edges representing positive and negative correlations, respectively.

Similar articles

References

    1. Yildirim E., Ilina L., Laptev G., Filippova V., Brazhnik E., Dunyashev T., Dubrovin A., Novikova N., Tiurina D., Tarlavin N., et al. The structure and functional profile of ruminal microbiota in young and adult reindeers (Rangifer tarandus) consuming natural winter-spring and summer-autumn seasonal diets. PeerJ. 2021;9:e12389. doi: 10.7717/peerj.12389. - DOI - PMC - PubMed
    1. Wang S.N., Zhai J.C., Liu W.S., Xia Y.L., Han L., Li H.P. Origins of Chinese reindeer (Rangifer tarandus) based on mitochondrial DNA analyses. PLoS ONE. 2019;14:e0225037. doi: 10.1371/journal.pone.0225037. - DOI - PMC - PubMed
    1. Forbes B.C., Kumpula T., Meschtyb N., Laptander R., Macias-Fauria M., Zetterberg P., Verdonen M., Skarin A., Kim K.-Y., Boisvert L.N. Sea ice, rain-on-snow and tundra reindeer nomadism in Arctic Russia. Biol. Lett. 2016;12:20160466. doi: 10.1098/rsbl.2016.0466. - DOI - PMC - PubMed
    1. Pösö A. Seasonal changes in reindeer physiology. Rangifer. 2005;25:31–38. doi: 10.7557/2.25.1.335. - DOI
    1. Larsen T.S., Lagercrantz H., Riemersma R.A., Blix A.S. Seasonal changes in blood lipids, adrenaline, noradrenaline, glucose and insulin in Norwegian reindeer. Acta Physiol. Scand. 1985;124:53–59. doi: 10.1111/j.1748-1716.1985.tb07631.x. - DOI - PubMed

LinkOut - more resources