. 2024 Dec 9;13(12):1500.
doi: 10.3390/antiox13121500.

Protective Effects of Exogenous Melatonin Administration on White Fat Metabolism Disruption Induced by Aging and a High-Fat Diet in Mice

Affiliations

Protective Effects of Exogenous Melatonin Administration on White Fat Metabolism Disruption Induced by Aging and a High-Fat Diet in Mice

Dongying Lv et al. Antioxidants (Basel). .

Abstract

Obesity has emerged as a major risk factor for human health, exacerbated by aging and changes in dietary habits. It represents a significant health challenge, particularly for older people. While numerous studies have examined the effects of obesity and aging on fat metabolism independently, research on their combined effects is limited. In the present study, the protective action against white fat accumulation after a high-fat diet (HFD) exerted by exogenous melatonin, a circadian hormone endowed with antioxidant properties also involved in fat metabolism, was investigated in a mouse model. For this purpose, a battery of tests was applied before and after the dietary and melatonin treatments of the animals, including epididymal white adipose tissue (eWAT) histological evaluations, transcriptomic and lipidomic analyses, real-time PCR tests, immunofluorescence staining, Western blot, the appraisal of serum melatonin levels, and transmission electron microscopy. This study found that aged mice on a high-fat diet (HFD) showed increased lipid deposition, inflammation, and reduced antioxidant glutathione (GSH) levels compared to younger mice. Lipidomic and transcriptomic analyses revealed elevated triglycerides, diglycerides, ceramides, and cholesterol, along with decreased sphingomyelin and fatty acids in eWAT. The genes linked to inflammation, NF-κB signaling, autophagy, and lipid metabolism, particularly the melatonin and glutathione pathways, were significantly altered. The aged HFD mice also exhibited reduced melatonin levels in serum and eWAT. Melatonin supplementation reduced lipid deposition, increased melatonin and GSH levels, and upregulated AANAT and MTNR1A expression in eWAT, suggesting that melatonin alleviates eWAT damage via the MTNR1A pathway. It also suppressed inflammatory markers (e.g., TNF-α, NLRP3, NF-κB, IL-1β, and CEBPB) and preserved mitochondrial function through enhanced mitophagy. This study highlights how aging and HFD affect lipid metabolism and gene expression, offering potential intervention strategies. These findings provide important insights into the mechanisms of fat deposition associated with aging and a high-fat diet, suggesting potential intervention strategies.

Keywords: aging; eWAT; inflammation; lipidomics; melatonin; obesity.


Conflict of interest statement

The authors declare no conflicts of interest.

Figures
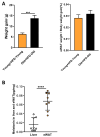
Figure A1
Figure A1
High-fat-induced increases in body weight and eWAT weight were exacerbated in aged mice. (A) Average weight gain (left) and eWAT weight/weight gain (right) of mice; (B) melatonin levels in liver and eWAT detected by liquid chromatography. All data are represented as mean ± SEM. *** p < 0.001, **** p < 0.0001.
Figure A2
Figure A2
Changes in antioxidant-related genes in eWAT of the OC and OH groups. (A) Transcriptome GO enrichment barplot of annotations analysis in OC and OH groups. (B) Violin plot shows the relative expression levels of three antioxidant-related genes (GPST2, GPX3, and GPX4) in the OC and OH groups in the transcriptome. (C) Top left: GSEA of genes regulating glutathione transferase activity, enrichment score NES = −1.97, p < 0.01; bottom right: ranked gene list of GSEA. All the data are represented as mean ± SEM. * p < 0.05, ** p < 0.01, and *** p < 0.001.
Figure A3
Figure A3
The melatonin content was detected by liquid chromatography, and the characteristic ion mass chromatograph of the melatonin standard solution was used (0.05 μg/L).
Figure 1
Figure 1
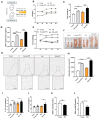
Effect of high-fat diet (HFD) and aging on eWAT of mice. (A) Schematic diagram of the experimental procedure; (B) body weight curves; (C) average weights of the mice; (D) average eWAT weight/weight of the mice; (E) mean food consumption; (F) representative images of the eWAT of the mice; (G) histopathological assessment of the eWAT using H&E staining; (H) adipocyte surface area; (I,J) IL-1β and TNF-α level in serum of mice detected by ELISA; (K) GSH level in serum; (L) GSH in eWAT; (L) data are expressed as the mean ± SEM (n = 7). All the data are represented as mean ± SEM. * p < 0.05, ** p < 0.01, *** p < 0.001, and **** p < 0.0001.
Figure 2
Figure 2
Changes in the overall lipid composition and distribution in the eWAT of the OC and OH group. (A) Left: Venn diagram of shared differentially expressed Lipidomics analysis. Right: the numbers of lipid classes and scores (PCA) in the OC and OH groups. (B,C) Heatmap for Lipid in OC and OH groups classification bubble chart; (D) Lipid ontology (GO) annotations analysis in OC and OH groups; (E) KEGG enrichment analysis in the OC and OH groups. Data are expressed as the mean ± SEM (n = 6). All the data are represented as mean ± SEM. * p < 0.05, ** p < 0.01, and *** p < 0.001.
Figure 3
Figure 3
Characterization of mice eWAT transcriptomic characteristics. (A) Left: Venn diagram of shared differentially expressed genes. Right: volcano plot of differentially expressed genes in the OC and OH groups. The yellow dots represent upregulated genes, black dots represent downregulated genes, and gray dots represent genes with no significant differences. * p < 0.05, ** p < 0.01, *** p < 0.001, and **** p < 0.0001. (B) Heatmap and hierarchical clustering of genes involved in different stages. The colors represent the relative gene expression values after normalization adjustments. The red and green colors refer to up- and downregulation, respectively. (C) Strategy for the enrichment analysis of metabolites in the highlighted cluster with MetaboAnalyst 5.0 based on the KEGG and SMPDB (the Small Molecule Pathway Database) database. (D,E) PGC-1α, Leptin, Sptlc3, Sptlc1, NLRP3, TNF-α, CEBPB, IL-6, IL-10, PINK1, Parkin, and LC3II mRNA transcription assays, mouse eWAT from the OC group (normal diet aged mice) and OH group (HFD aged mice) followed by qPCR analysis (n = 6, mean ± SEM). (F) Serum melatonin levels in the groups Young, Old, and Old + HFD. (G) eWAT melatonin levels in the groups Young, Old, and Old + HFD. All the data are represented as mean ± SEM. * p < 0.05, ** p < 0.01, and **** p < 0.0001.
Figure 4
Figure 4
Correlation analysis of transcriptome and lipidomics revealed the changes in the regulation of eWAT by a high-fat diet in the aged mice. (A,B) Correlation KEGG enrichment analysis for differential genes and lipid molecules. (C) From left to right: heatmap of the genes with the most significant differences between the OH and OC group; the molecular changes in different kinds of lipids between the OH and OC group; and correlation analysis of genes and lipids. (D) Summary of the regulatory pathway changes in eWAT through lipidome and transcriptome.The red arrow in the figure indicates upregulation of expression and the green arrow indicates downregulation.
Figure 5
Figure 5
Effect of melatonin on the eWAT of the aged mice with high-fat diet. (A) Schematic diagram of the experimental procedure; (B) body weight curves; (C) average weights of the mice; (D) average eWAT weight/weight of the mice; (E) representative images of the eWAT of the mice; (F) histopathological assessment of the eWAT using H&E staining; (G) adipocyte surface area; (H,I) melatonin level in serum and eWAT detected by liquid chromatography; (J) GSH level in serum; (K) GSH in eWAT. All the data are represented as mean ± SEM. ns p > 0.05, * p < 0.05, ** p < 0.01, and **** p < 0.0001.
Figure 6
Figure 6
Melatonin increases AANAT and MTNR1A expression in eWAT. (A) AANAT and MTNR1A in eWAT detected by immunofluorescence double staining (scale bar is 50 μm); (B) immunofluorescence analysis of CEBPB in eWAT (scale: 50 μm); (CE) statistical graph of MTNR1A,AANAT and CEBPB positive expression rate; (F) Western blot analysis of MTNR1A protein expression in eWAT; (G) statistical graph of protein expression; (H) relative expression of MTNR1A, AANAT and CEBPB mRNA expression by qPCR analysis. All data are represented as mean ± SEM. * p < 0.05, ** p < 0.01, *** p < 0.001, and **** p < 0.0001.
Figure 7
Figure 7
Melatonin improves mitochondrial autophagy and inflammation in eWAT. (AC) immunofluorescence analysis of NLRP3, NF-κB, and IL-1β in eWAT (scale: 50 μm); (D,F) statistical graph of NLRP3, NF-κB, and IL-1β positive expression rate; (E) Western blot analysis of NLRP3, NF-κB, MMP9, and IL-1β protein expression in eWAT; (G,H) IL-1β, TNF-α level in serum of mice detected by ELISA; (I) transmission electron microscope picture of eWAT (scale: 50 nm); (J) Western blot analysis of PINK1 and PARKIN protein expression in eWAT; (K) statistical graph of protein expression. The red arrow points to the mitochondria. All data are represented as mean ± SEM. * p < 0.05, ** p < 0.01, *** p < 0.001, and **** p < 0.0001.
Figure 8
Figure 8
Summary of signaling pathways involved in adipocyte metabolic disorders caused by melatonin decline with aging and HFD in eWAT. Upward arrows indicate upregulated expression levels and downward arrows indicate downregulated expression levels.

References

    1. Kuntic M., Kuntic I., Hahad O., Lelieveld J., Mü T., Daiber A. Impact of air pollution on cardiovascular aging. Mech. Ageing Dev. 2023;214:111857. doi: 10.1016/j.mad.2023.111857. - DOI - PubMed
    1. Zhou Q., Wan Q., Jiang Y., Liu J., Qiang L., Sun L. A Landscape of Murine Long Non-Coding RNAs Reveals the Leading Transcriptome Alterations in Adipose Tissue during Aging. Cell Rep. 2020;31:107694. doi: 10.1016/j.celrep.2020.107694. - DOI - PMC - PubMed
    1. Nguyen T.T., Corvera S. Adipose tissue as a linchpin of organismal ageing. Nat. Metab. 2024;6:793–807. doi: 10.1038/s42255-024-01046-3. - DOI - PMC - PubMed
    1. Benayoun B.A., Pollina E.A., Singh P.P., Mahmoudi S., Harel I., Casey K.M., Dulken B.W., Kundaje A., Brunet A. Remodeling of epigenome and transcriptome landscapes with aging in mice reveals widespread induction of inflammatory responses. Genome Res. 2019;29:697–709. doi: 10.1101/gr.240093.118. - DOI - PMC - PubMed
    1. Maniyadath B., Zhang Q., Gupta R.K., Mandrup S. Adipose tissue at single-cell resolution. Cell Metab. 2023;35:386–413. doi: 10.1016/j.cmet.2023.02.002. - DOI - PMC - PubMed

LinkOut - more resources