. 2024 Dec 20;13(12):1573.
doi: 10.3390/antiox13121573.

Synergistic Anti-Cancer Effects of Curcumin and Thymoquinone Against Melanoma

Affiliations

Synergistic Anti-Cancer Effects of Curcumin and Thymoquinone Against Melanoma

Hana Mohd et al. Antioxidants (Basel). .

Abstract

Combining anti-cancer agents in cancer therapies is becoming increasingly common because of their improved efficacy, reduced toxicity, and decreased risk of resistance development. Melanoma, a highly aggressive form of skin cancer characterized by limited treatment options due to chemoresistance, poses a considerable challenge for effective management. Here, we test the hypothesis that dietary supplements such as thymoquinone (TQ) and curcumin (CU) cooperatively modulate cancer-associated cellular mechanisms to inhibit melanoma progression. Through a series of in vitro experiments utilizing the A375 melanoma cell line, including assessments of cell viability, apoptosis, multicellular tumor spheroid models, reactive oxygen species (ROS) quantification, metabolomics analysis, and RNA sequencing, we established that the combined application of TQ and CU exhibited superior anti-tumor effects compared to their individual use. Our results indicate that the combination treatment significantly inhibited cell viability and induced apoptosis more effectively than either agent alone, with optimal synergy observed at concentrations of 25 µM CU and 10 µM TQ against A375 cells. Additionally, the combination treatment markedly elevated ROS levels, selectively activating the mitochondrial apoptotic pathway via caspase-9. Differential gene expression analysis further revealed a unique synergistic effect of the combination treatment, with enhanced regulation of genes related to oxidative stress and apoptosis. Notably, pathways such as mitochondrial apoptotic signaling and redox homeostasis were more effectively influenced by the combination, with genes such as GPX3, CYP4F11, and HSPB8 cooperatively regulated. Overall, the findings suggest that, in combination, TQ and CU acts synergistically against melanoma; however, further experimental and clinical studies are required to confirm its therapeutic potential.

Keywords: RNAseq; cancer; curcumin; melanoma; thymoquinone.


Conflict of interest statement

The authors declare no conflict of interest.

Figures

Figure 1
Figure 1
Effect of thymoquinone, curcumin, and their combination on the viability of human (A375) metastatic melanoma cells and the two healthy human keratinocyte (HaCaT) and human dermal fibroblast (HDfa) cell lines. The values are presented as the percentage of cell death. The data represent the mean ± SD of three independent experiments conducted in triplicate (vs. control, * p < 0.001).
Figure 2
Figure 2
Synergism between TQ and CU in A375 cells. Bliss and HSA synergy scores (SynergyFinder.com) were calculated to predict the potential synergism of TQ and CU.
Figure 3
Figure 3
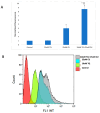
(A) Representative histograms obtained using flow cytometry on an apoptosis assay from various groups are shown (quadrant: upper left—dead cells; upper right—late apoptosis; lower left—live cells; lower right—early apoptosis); (B) percentage of viable, dead, early apoptotic, and late apoptotic cells in the control and compound-treated groups. n = 3; value are presented as the mean ± SD. * p < 0.05 vs. control cells; ** p < 0.05 combination vs. 25 μM CU; *** p < 0.05 combination vs. 10 μM TQ.
Figure 4
Figure 4
(A) Calcein-AM/PI dual-stained A375 multicellular tumor spheroids after 24 h of treatment with CU, TQ, or their combination. A red signal indicates dead cells, and a green signal indicates viable cells. Images obtained using an ECHO Revolve Microscope (Model RVL-100-M, Serial #: M-00395-RVL) (20×/0.4 objective). Scale bar: 180 µM. (B) Effect of thymoquinone, curcumin, and their combination on the viability of human (A375) metastatic melanoma cells in an MCTS model using a CellTiter-Glo 3D assay.p-Values are presented as the mean ± SD. * p < 0.05 vs. control.
Figure 4
Figure 4
(A) Calcein-AM/PI dual-stained A375 multicellular tumor spheroids after 24 h of treatment with CU, TQ, or their combination. A red signal indicates dead cells, and a green signal indicates viable cells. Images obtained using an ECHO Revolve Microscope (Model RVL-100-M, Serial #: M-00395-RVL) (20×/0.4 objective). Scale bar: 180 µM. (B) Effect of thymoquinone, curcumin, and their combination on the viability of human (A375) metastatic melanoma cells in an MCTS model using a CellTiter-Glo 3D assay.p-Values are presented as the mean ± SD. * p < 0.05 vs. control.
Figure 5
Figure 5
(A) Intracellular ROS levels in A375 cells after treatment with CU, TQ, and their combination. After the indicated treatment for 24 h, cells were incubated with 10 μM DCFH-DA for 30 min and then immediately subjected to a flow cytometry analysis. The results are expressed as a ratio of the relative fluorescence intensity compared to the control group. (B) The DCFH-DA spectrum represents the fluorescence intensities of the probe. DCFH-DA (10 μM) was incubated with the cell culture for 30 min. (C) Caspases-9 and -8 were measured using Caspase-Glo 8 Assay and Caspase-Glo 9 Assay kits. p-Values were recorded as the mean ± SD. * p < 0.05 vs. control cells; ** p < 0.05 combination vs. 25 μM CU; *** p < 0.05 combination vs. 10 μM TQ.
Figure 5
Figure 5
(A) Intracellular ROS levels in A375 cells after treatment with CU, TQ, and their combination. After the indicated treatment for 24 h, cells were incubated with 10 μM DCFH-DA for 30 min and then immediately subjected to a flow cytometry analysis. The results are expressed as a ratio of the relative fluorescence intensity compared to the control group. (B) The DCFH-DA spectrum represents the fluorescence intensities of the probe. DCFH-DA (10 μM) was incubated with the cell culture for 30 min. (C) Caspases-9 and -8 were measured using Caspase-Glo 8 Assay and Caspase-Glo 9 Assay kits. p-Values were recorded as the mean ± SD. * p < 0.05 vs. control cells; ** p < 0.05 combination vs. 25 μM CU; *** p < 0.05 combination vs. 10 μM TQ.
Figure 6
Figure 6
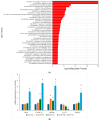
Significantly differentially expressed genes were clustered by their gene ontology, and the enrichment of gene ontology terms was tested using Fisher’s exact test (GeneSCF v1.1-p2): (A) significantly enriched gene ontology terms with adjusted p-values less than 0.05 in the differentially expressed gene sets (up to 40 terms) between 10 μM TQ+ 25 μM CU and the control; (B) mRNA expression of highly regulated genes, measured by RT-PCR and shown as the fold change compared to the control group. p-Values are presented as the mean ± SD. * p < 0.05 vs. control.
Figure 7
Figure 7
A bi-clustering heatmap for the combination vs. the control, which visualizes the expression profiles of the top 30 differentially expressed genes sorted by their adjusted p-values by plotting their log2-transformed expression values in the samples.
Figure 8
Figure 8
Metabolomics of TQ, CU, and their combination on treated melanoma cell lines: (A) PCA analysis of three groups showing that samples in each group are clustered away from one another; (B) heatmap of pairwise correlation values of 120 metabolites and depiction of the major metabolic pathways in A375 cells; (C) identified pathways altered by the combination treatment vs. the control treatment in A375 cell lines.
Figure 8
Figure 8
Metabolomics of TQ, CU, and their combination on treated melanoma cell lines: (A) PCA analysis of three groups showing that samples in each group are clustered away from one another; (B) heatmap of pairwise correlation values of 120 metabolites and depiction of the major metabolic pathways in A375 cells; (C) identified pathways altered by the combination treatment vs. the control treatment in A375 cell lines.

Similar articles

References

    1. Saginala K., Barsouk A., Aluru J.S., Rawla P., Barsouk A. Epidemiology of Melanoma. Med. Sci. 2021;9:63. doi: 10.3390/medsci9040063. - DOI - PMC - PubMed
    1. Miller A.J., Mihm M.C., Jr. Melanoma. N. Engl. J. Med. 2006;355:51–65. doi: 10.1056/NEJMra052166. - DOI - PubMed
    1. Shain A.H., Bastian B.C. From melanocytes to melanomas. Nat. Rev. Cancer. 2016;16:345–358. doi: 10.1038/nrc.2016.37. - DOI - PubMed
    1. Longley D.B., Johnston P.G. Molecular mechanisms of drug resistance. J. Pathol. 2005;205:275–292. doi: 10.1002/path.1706. - DOI - PubMed
    1. Ravindranathan P., Pasham D., Balaji U., Cardenas J., Gu J., Toden S., Goel A. A combination of curcumin and oligomeric proanthocyanidins offer superior anti-tumorigenic properties in colorectal cancer. Sci. Rep. 2018;8:13869. doi: 10.1038/s41598-018-32267-8. - DOI - PMC - PubMed

LinkOut - more resources