

Obesity, Physical Activity, and Cancer Incidence in Two Geographically Distinct Populations; The Gulf Cooperation Council Countries and the United Kingdom-A Systematic Review and Meta-Analysis
- PMID: 39766104
- PMCID: PMC11674634
- DOI: 10.3390/cancers16244205
Obesity, Physical Activity, and Cancer Incidence in Two Geographically Distinct Populations; The Gulf Cooperation Council Countries and the United Kingdom-A Systematic Review and Meta-Analysis
Abstract
Background: The relationship between obesity, physical activity, and cancer has not been well studied across different countries. The age-standardized rate of cancer in the UK is double-triple that in the Gulf Cooperation Council Countries (GCCCs). Here, we study the association between obesity, physical activity, and cancer incidence with the aim to elucidate cancer epidemiology and risk factors in two geographically, ethnically, and climatically different parts of the world.
Methods: Our systematic search (from 2016 to 2023) in PubMed, EMBASE, Scopus, and APA PsycINFO databases resulted in 64 studies totaling 13,609,578 participants. The Cochrane risk of bias tool, GRADE, R programming language, and the meta package were used.
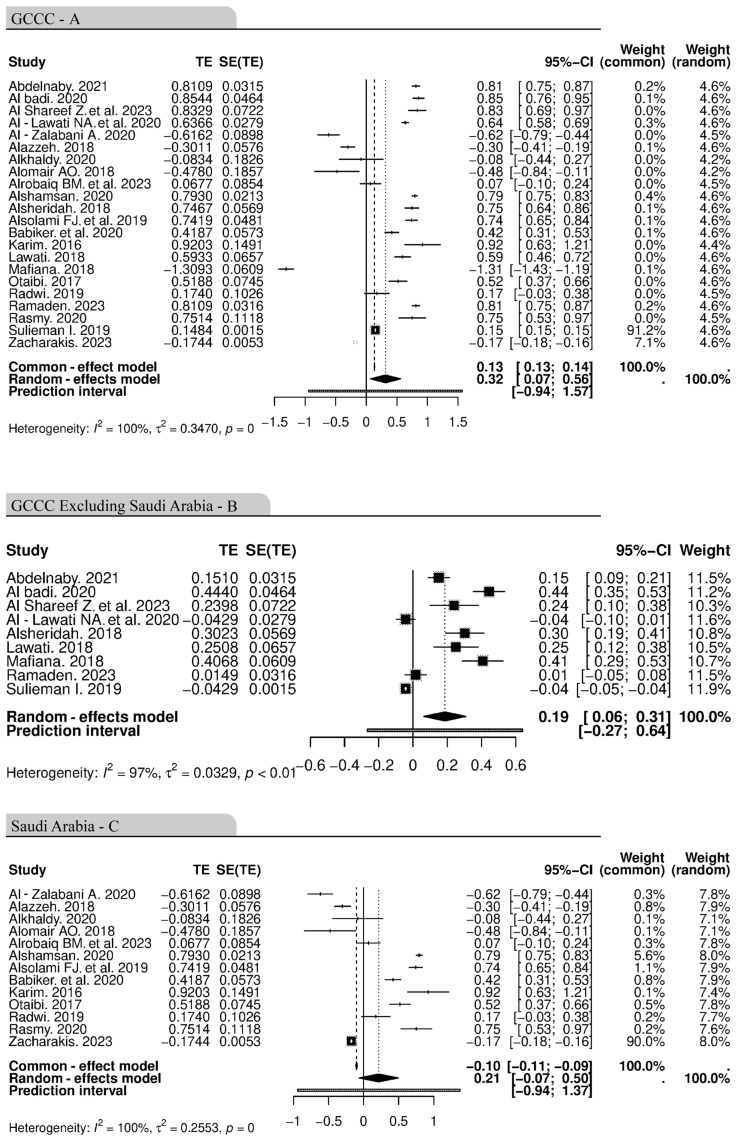
Results: Significant associations between obesity and cancer were found in both regions, with a stronger association in the UK (p ≤ 0.0001) than the GCCCs (p = 0.0042). While physical inactivity alone did not show a statistically significant association with cancer incidence, the pooled hazard ratio analysis revealed that the presence of both obesity and physical inactivity was associated with a significantly higher cancer incidence. The most common types of cancer were breast cancer in the UK and colorectal cancer across the GCCCs.
Conclusion: Although both regions share similarities, advanced healthcare systems, genetic characteristics, dietary habits, and cultural practices may influence cancer incidence and types.
Keywords: Gulf Cooperation Council Countries; United Kingdom; cancer; meta-analysis; obesity; physical activity; systematic review.
Conflict of interest statement
The authors declare no conflicts of interest.
Figures


Similar articles
-
Correlation between breast cancer and lifestyle within the Gulf Cooperation Council countries: A systematic review.World J Clin Oncol. 2020 Apr 24;11(4):217-242. doi: 10.5306/wjco.v11.i4.217. World J Clin Oncol. 2020. PMID: 32355643 Free PMC article.
-
Epidemiology of overweight and obesity in early childhood in the Gulf Cooperation Council countries: a systematic review and meta-analysis protocol.BMJ Open. 2018 Jun 8;8(6):e019363. doi: 10.1136/bmjopen-2017-019363. BMJ Open. 2018. PMID: 29884693 Free PMC article.
-
Variables associated with the relationship between obesity and mental health among university students in the Gulf Cooperation Council countries: a systematic review.Front Public Health. 2024 Aug 29;12:1411229. doi: 10.3389/fpubh.2024.1411229. eCollection 2024. Front Public Health. 2024. PMID: 39267651 Free PMC article.
-
Polycystic ovarian syndrome among women diagnosed with infertility in the Gulf Cooperation Council countries: A protocol for systematic review and meta-analysis of prevalence studies.Womens Health (Lond). 2023 Jan-Dec;19:17455057231160940. doi: 10.1177/17455057231160940. Womens Health (Lond). 2023. PMID: 36999302 Free PMC article.
-
The relationship between daytime napping and obesity: a systematic review and meta-analysis.Sci Rep. 2023 Jul 26;13(1):12124. doi: 10.1038/s41598-023-37883-7. Sci Rep. 2023. PMID: 37495671 Free PMC article.
Cited by
-
Obesity and cancer: unravelling the microbiome's hidden role.Front Nutr. 2025 Jun 9;12:1602603. doi: 10.3389/fnut.2025.1602603. eCollection 2025. Front Nutr. 2025. PMID: 40551741 Free PMC article. Review.
References
-
- Chen S.L.F., Nøst T.H., Botteri E., Ferrari P., Braaten T., Sandanger T.M., Borch K.B. Overall lifestyle changes in adulthood are associated with cancer incidence in the Norwegian Women and Cancer Study (NOWAC)—A prospective cohort study. BMC Public Health. 2023;23:633. doi: 10.1186/s12889-023-15476-3. - DOI - PMC - PubMed
-
- Abbafati C., Abbas K.M., Abbasi-Kangevari M., Abd-Allah F., Abdelalim A., Abdollahi M., Abdollahpour I., Abegaz K.H., Abolhassani H., Aboyans V., et al. Global burden of 369 diseases and injuries in 204 countries and territories, 1990–2019: A systematic analysis for the Global Burden of Disease Study 2019. Lancet. 2020;396:1204–1222. doi: 10.1016/S0140-6736(20)30925-9. - DOI - PMC - PubMed
-
- Franco-García J.M., Castillo-Paredes A., Rodríguez-Redondo Y., Carlos-Vivas J., García-Carrillo R.M., Denche-Zamorano Á. Greater physical activity levels are associated with lower prevalence of tumors and risk of cancer in Spanish population: A cross-sectional study. Heliyon. 2024;10:e29191. doi: 10.1016/j.heliyon.2024.e29191. - DOI - PMC - PubMed
Publication types
LinkOut - more resources
Full Text Sources
