. 2024 Dec 23;16(24):4273.
doi: 10.3390/cancers16244273.

Disrupted Lipid Metabolism, Cytokine Signaling, and Dormancy: Hallmarks of Doxorubicin-Resistant Triple-Negative Breast Cancer Models

Affiliations

Disrupted Lipid Metabolism, Cytokine Signaling, and Dormancy: Hallmarks of Doxorubicin-Resistant Triple-Negative Breast Cancer Models

Radhakrishnan Vishnubalaji et al. Cancers (Basel). .

Abstract

Background: Chemoresistance in triple-negative breast cancer (TNBC) presents a significant clinical hurdle, limiting the efficacy of treatments like doxorubicin. This study aimed to explore the molecular changes associated with doxorubicin resistance and identify potential therapeutic targets to overcome this resistance, thereby improving treatment outcomes for TNBC patients.

Methods: Doxorubicin-resistant (DoxR) TNBC models (MDA-MB-231 and BT-549) were generated by exposing cells to increasing concentrations of doxorubicin. RNA sequencing (RNA-Seq) was performed using the Illumina platform, followed by bioinformatics analysis with CLC Genomics Workbench and iDEP. Functional assays assessed proliferation, sphere formation, migration, and cell cycle changes. Protein expression and phosphorylation were confirmed via Western blotting. Pathway and network analyses were conducted using Ingenuity Pathway Analysis (IPA) and STRING, while survival analysis was performed using Kaplan-Meier Plotter database.

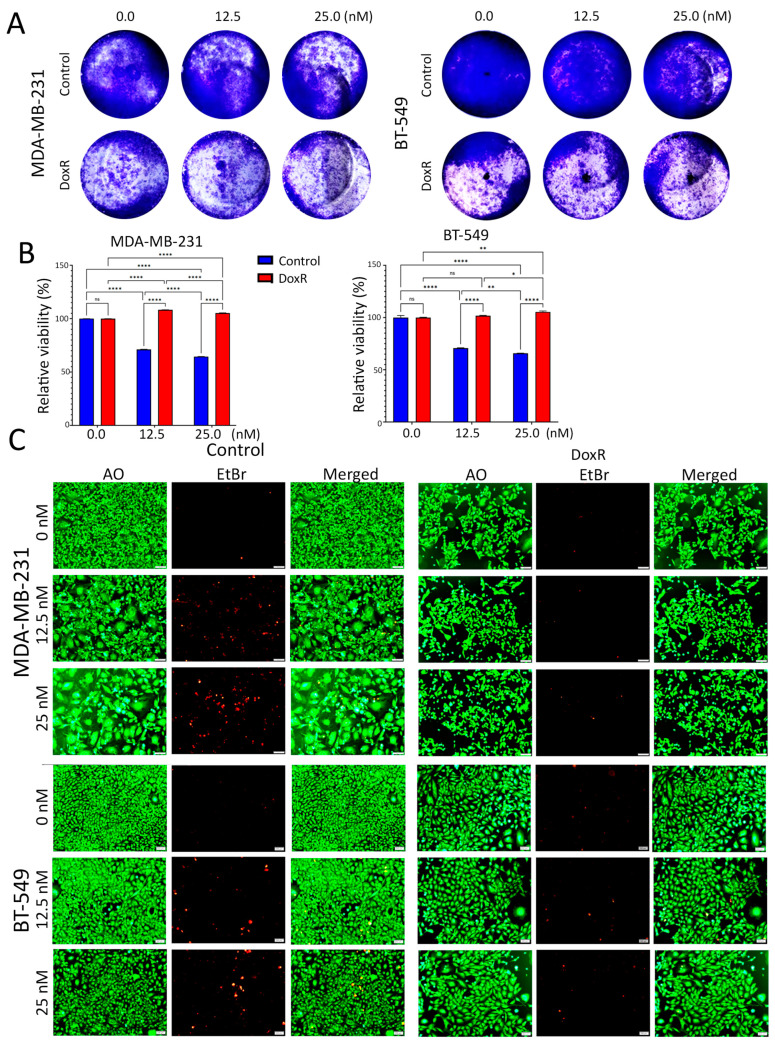
Results: DoxR cells exhibited reduced proliferation, sphere formation, and migration, but showed enhanced tolerance to doxorubicin. Increased CHK2 and p53 phosphorylation indicated cellular dormancy as a resistance mechanism. RNA-Seq analysis revealed upregulation of cytokine signaling and stress-response pathways, while cholesterol and lipid biosynthesis were suppressed. Activation of the IL1β cytokine network was prominent in DoxR cells, and CRISPR-Cas9 screens data identified dependencies on genes involved in rRNA biogenesis and metabolism. A 27-gene signature associated with doxorubicin resistance was linked to worse clinical outcomes in a large breast cancer cohort (HR = 1.76, FDR p < 2.0 × 10⁻¹³).

Conclusions: This study uncovers potential therapeutic strategies for overcoming TNBC resistance, including dormancy reversal and targeting onco-ribosomal pathways and cytokine signaling networks, to improve the efficacy of doxorubicin-based treatments.

Keywords: cellular dormancy; chemoresistance; doxorubicin; therapeutic strategies; triple-negative breast cancer (TNBC).


Conflict of interest statement

The authors declare no conflicts of interest.

Figures

Figure 1
Figure 1
Proliferation and morphological changes in parental and DoxR TNBC cells following doxorubicin treatment. (A) Clonogenic survival assay (CFU) showing dose-dependent suppression of proliferation in parental TNBC cells (MDA-MB-231 and BT-549) treated with 12.5 nM and 25 nM doxorubicin, while DoxR cells maintained higher proliferation rates. (B) Quantitative analysis of CFU potential reveals reduced inhibition of cell proliferation in DoxR MDA-MB-231 and BT-549 cells compared to parental cells at both doxorubicin concentrations. Data are presented as mean  ±  S.E.M., n  =  6. n.s., not significant; * p  <  0.05; ** p  <  0.005; **** p  <  0.00005. Two-way ANOVA testing was employed. (C) Acridine orange/ethidium bromide (AO/EtBr) staining of parental and DoxR cells, demonstrating the presence of necrotic cells (red) and morphological abnormalities in response to doxorubicin in parental cells.
Figure 2
Figure 2
Suppressed migration and organotypic growth in DoxR TNBC models. Representative organotypic images for MDAMB-231 (A) or BT-549 (B) DoxR and control TNBC cells. (C) Spheroid formation assay showing reduced spheroid formation capacity in DoxR TNBC cells compared to parental cells. Migration assay illustrates a significant reduction in the migration of DoxR MDA-MB-231 (D) and BT-549 (E) cells compared to parental cells. Quantification of relative wound areas (%) are shown below. Data are presented as mean ± S.D., n = 2. n.s., not significant; ** p  <  0.005; *** p  <  0.0005.
Figure 3
Figure 3
Alterations in cell cycle regulation in DoxR TNBC cells. (A) Flow cytometry analysis of cell cycle distribution in parental and DoxR cells post-doxorubicin treatment on day 3. (B) Quantification of cell cycle distribution form (A). Data are presented as mean ± S.D., n = 2. (C) Annexin V staining of control and DoxR TNBC cells at the indicated doxorubicin concentrations on day 3. (D) Representative Western blot analysis showing phosphorylated Retinoblastoma protein (p-Rb), phosphorylated ChK kinases, and p53 in DoxR TNBC cells. Quantifications of band intensity are shown on the right panel. Data are presented as mean ± S.D., n = 2. n.s., not significant; * p < 0.05; ** p < 0.005.
Figure 4
Figure 4
Molecular profiling of DoxR TNBC models. (A) Heatmap of differentially expressed genes (DEGs) showing 231 upregulated and 420 downregulated genes in DoxR cells compared to parental TNBC models. (B) Hierarchical clustering of enriched gene ontology (GO) biological processes, with upregulated genes associated with defense and immune responses and downregulated genes involved in cholesterol synthesis. (C) RT-qPCR validation of selected upregulated and downregulated genes in DoxR MDA-MB-231 cells. Data are presented as mean  ±  S.E.M., n = 9. * p  <  0.05, *** p  <  0.0005. (D) Disease and function heatmap depicting activated (orange) and suppressed (blue) categories in DoxR vs. control TNBC cells. (E) Upstream regulator analysis illustrating IL1β as a key driver of gene expression changes in DoxR TNBC models. n.s., not significant; ** p < 0.005; **** p < 0.00005.
Figure 5
Figure 5
Dependency map of DoxR TNBC models highlighting the role of ribosomal RNA. (A) CRISPR-Cas9 functional screen data from DepMap identifying essentiality of 27 genes among 211 upregulated genes in DoxR TNBC models. (B) The effects of each identified gene in the panel of 22 TNBC models are depicted as a heatmap. The heatmap represents the dependency scores calculated by DepMap for the identified genes. (C) Kaplan–Meier plot showing that the identified 27-gene signature is associated with poor relapse-free survival (RFS) in breast cancer patients. (D) GeneMANIA analysis showing significant enrichment of the identified genes in functional networks associated with rRNA biogenesis and metabolism, underscoring their critical role in TNBC pathophysiology. (E) Functional enrichment among the DoxR-derived signature employment GeneMANIA.

Similar articles

Cited by

References

    1. Garrido-Castro A.C., Lin N.U., Polyak K. Insights into Molecular Classifications of Triple-Negative Breast Cancer: Improving Patient Selection for Treatment. Cancer Discov. 2019;9:176–198. doi: 10.1158/2159-8290.CD-18-1177. - DOI - PMC - PubMed
    1. Lehmann B.D., Bauer J.A., Chen X., Sanders M.E., Chakravarthy A.B., Shyr Y., Pietenpol J.A. Identification of human triple-negative breast cancer subtypes and preclinical models for selection of targeted therapies. J. Clin. Investig. 2011;121:2750–2767. doi: 10.1172/JCI45014. - DOI - PMC - PubMed
    1. Vishnubalaji R., Elango R., Alajez N.M. LncRNA-Based Classification of Triple Negative Breast Cancer Revealed Inherent Tumor Heterogeneity and Vulnerabilities. Non-Coding RNA. 2022;8:44. doi: 10.3390/ncrna8040044. - DOI - PMC - PubMed
    1. Santonja A., Sanchez-Munoz A., Lluch A., Chica-Parrado M.R., Albanell J., Chacon J.I., Antolin S., Jerez J.M., de la Haba J., de Luque V., et al. Triple negative breast cancer subtypes and pathologic complete response rate to neoadjuvant chemotherapy. Oncotarget. 2018;9:26406–26416. doi: 10.18632/oncotarget.25413. - DOI - PMC - PubMed
    1. Vishnubalaji R., Alajez N.M. Transcriptional landscape associated with TNBC resistance to neoadjuvant chemotherapy revealed by single-cell RNA-seq. Mol. Ther. Oncolytics. 2021;23:151–162. doi: 10.1016/j.omto.2021.09.002. - DOI - PMC - PubMed

LinkOut - more resources