. 2024 Nov 28;14(12):1528.
doi: 10.3390/biom14121528.

Senescence-like Phenotype After Chronic Exposure to Isoproterenol in Primary Quiescent Immune Cells

Affiliations

Senescence-like Phenotype After Chronic Exposure to Isoproterenol in Primary Quiescent Immune Cells

Michael Laumann et al. Biomolecules. .

Abstract

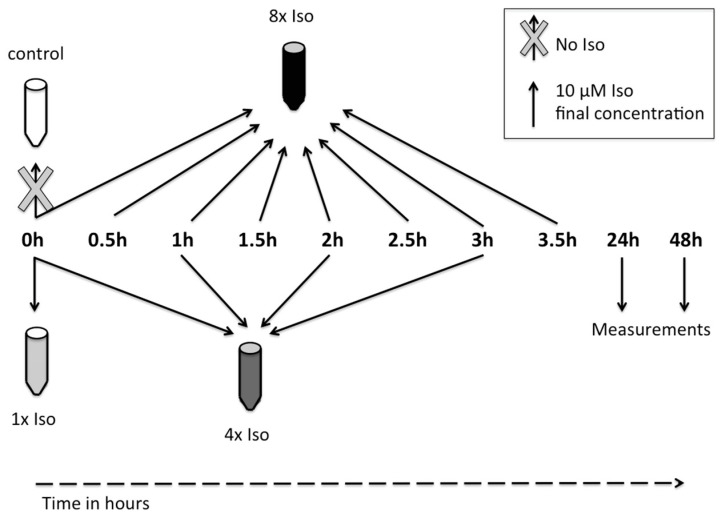
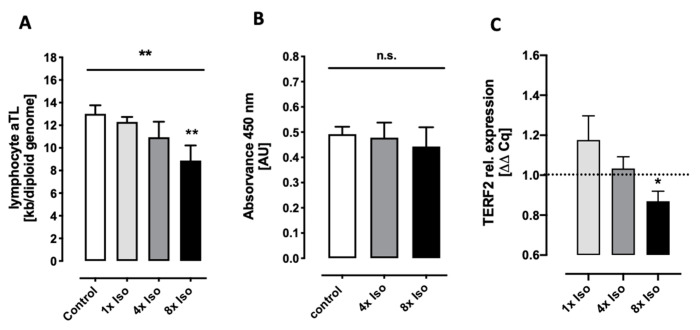
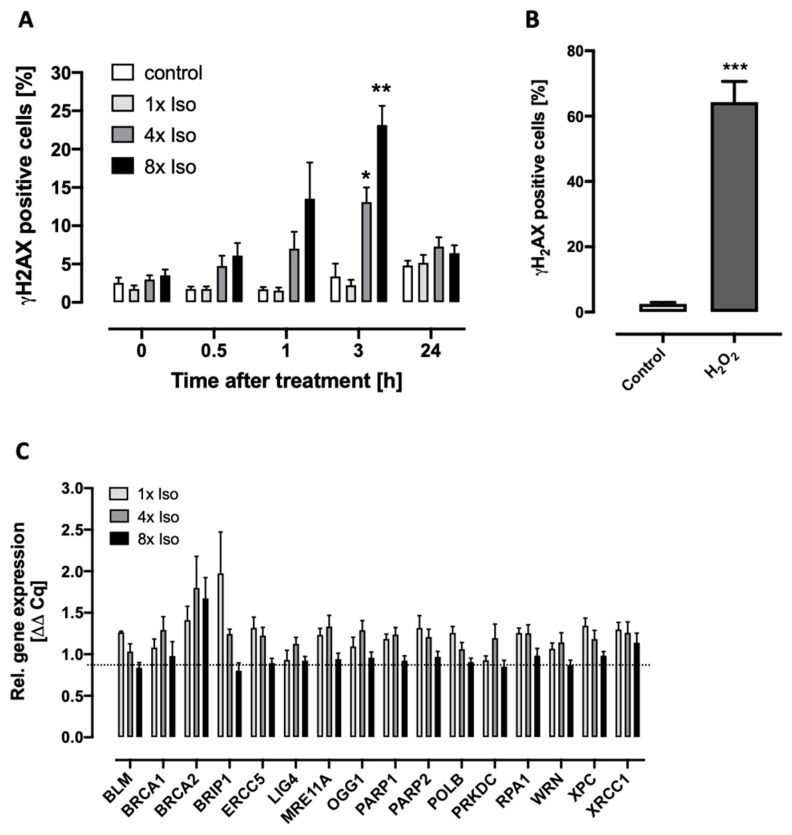
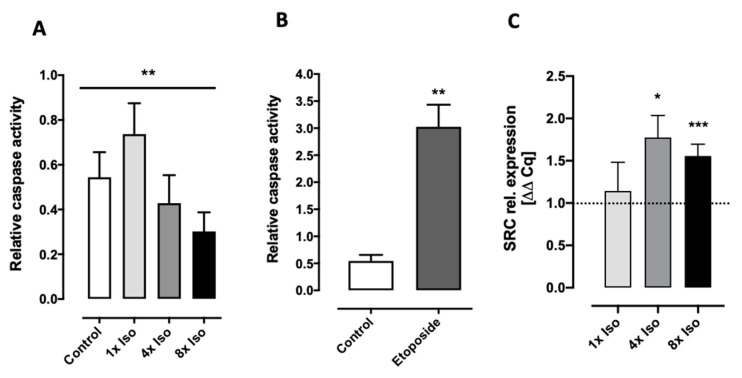
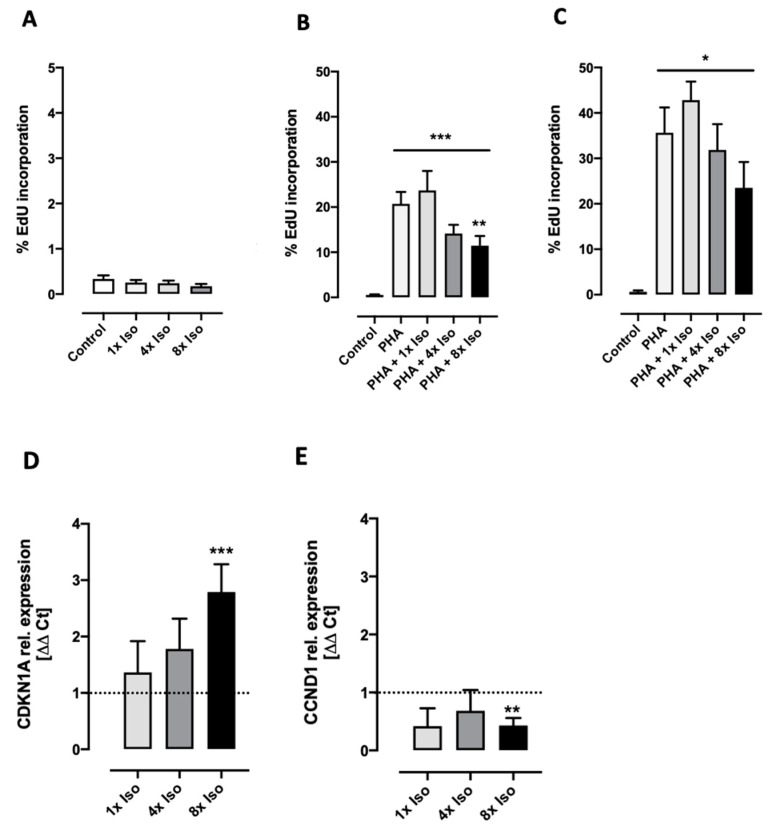
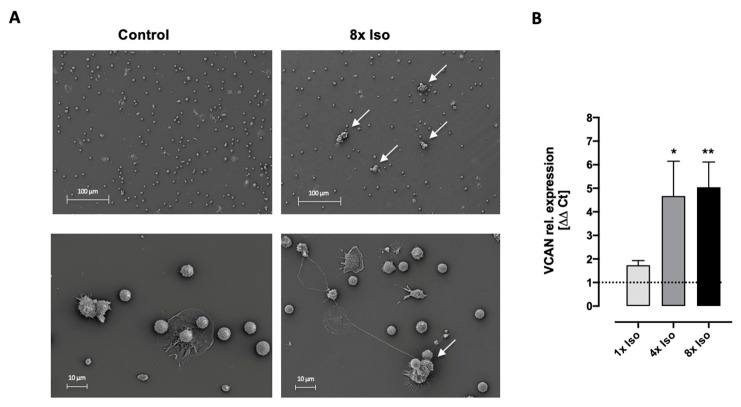
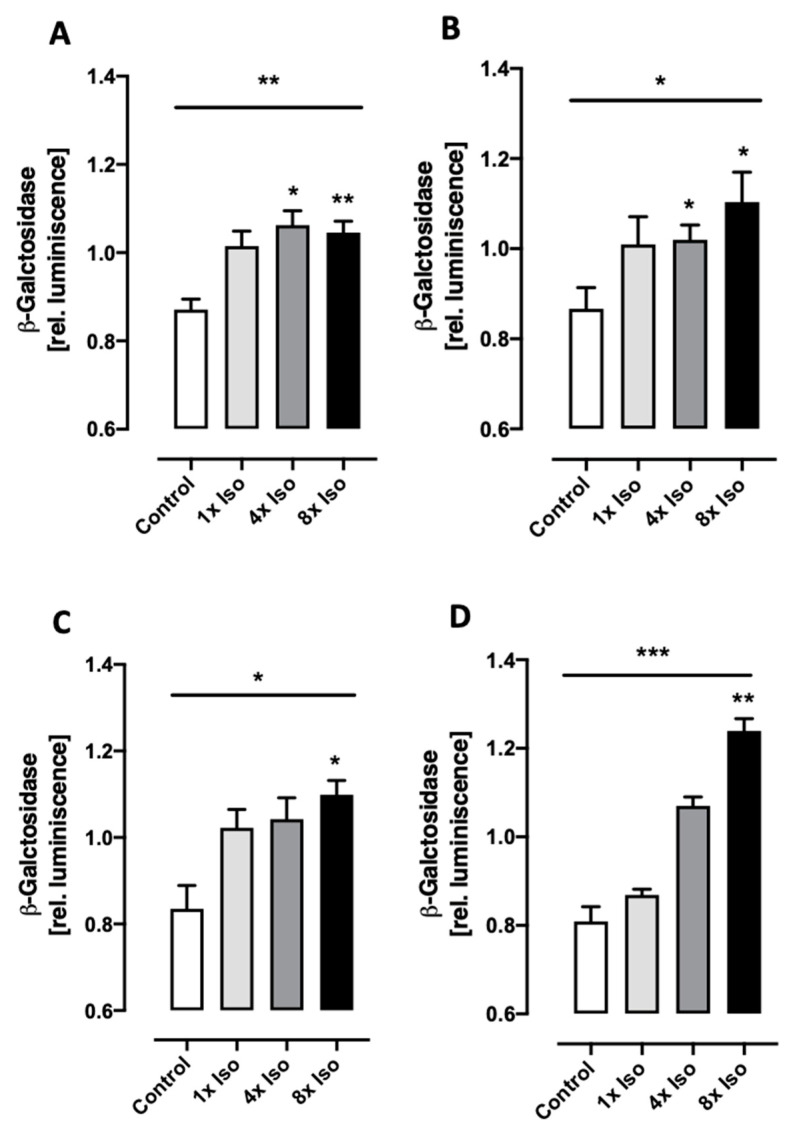
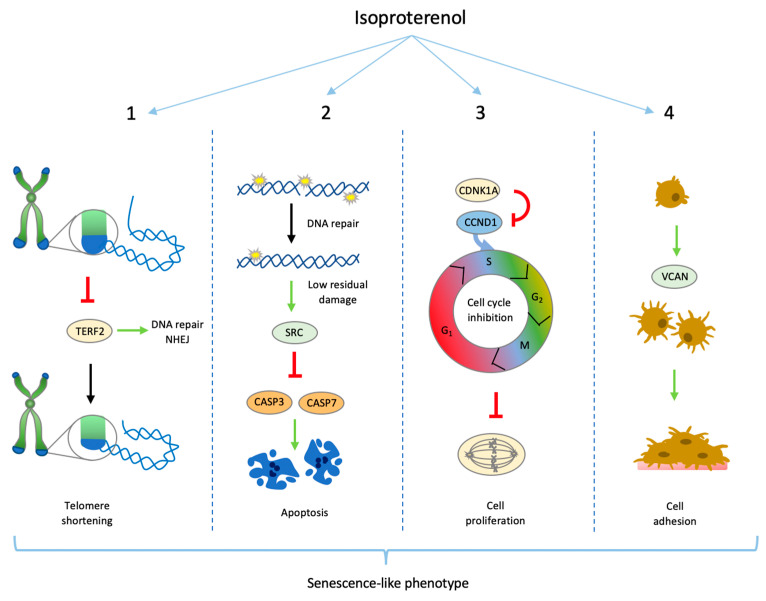
Chronic stress is associated with a higher risk for carcinogenesis as well as age-related diseases and immune dysfunction. There is evidence showing that psychological stress can contribute to premature immunosenescence. Therefore, the question arose whether chronic exposure to catecholamine could drive immune cells into senescence. Peripheral blood mononuclear cells were isolated from whole blood. After repeated ex vivo treatment with isoproterenol, an epinephrine analog, well-established senescence biomarkers were assessed. We found (i) DNA double-strand break induction, (ii) telomere shortening, (iii) failure to proliferate, (iv) higher senescence-associated β-galactosidase activity, (v) decreases in caspases 3 and 7 activity, and (vi) strong upregulation of the proteoglycan versican accompanied by increased cellular adhesion suggesting the induction of a senescence-like phenotype. These results emphasize the complexity of the effect of isoproterenol on multiple cellular processes and provide insights into the molecular mechanisms of stress leading to immunosenescence.

Keywords: DNA strand breaks; catecholamine; cellular senescence; isoproterenol; β-galactosidase activity.


Conflict of interest statement

The authors declare no conflicts of interest.

Figures

Figure 1
Figure 1
Schematic representation of chronic isoproterenol treatment. Isoproterenol was added to the cells 1× (0 h), 4× (0 h, 1 h, 2 h, and 3 h), or 8× (0 h, 0.5 h, 1 h, 1.5 h, 2 h, 2.5 h, 3 h, and 3.5 h). Each isoproterenol treatment led to a final concentration of 10 µM in medium. Measurements were performed after 24, 48, and 72 h incubation at 37 °C.
Figure 2
Figure 2
Measurement of telomere length, telomerase activity, and expression of TERF2 gene in isoproterenol-treated PBMCs. All measurements were performed 24 after the first treatment. (A). Absolute telomere length of lymphocytes treated with either 0×, 1×, 4×, or 8× isoproterenol. With increases in isoproterenol treatment, the kb per diploid genome decreases with statistical significance. Data for each treatment consist of n = 8 independent experiments. (B) Activity of telomerase in total protein extracts of PBMCs treated with either 0×, 4×, or 8× isoproterenol. Telomerase activity is not significantly different between the treatments and the control. Data for each treatment consist of n = 10 independent experiments. (C) Expression of the telomeric repeat binding factor 2 (TERF2) gene after single (1×) and repeated (4× and 8×) isoproterenol treatment. Relative gene expression significantly decreases after 8x isoproterenol treatment. Data for each treatment consist of 1× n = 3, 4× n = 3, and 8× n = 11 independent experiments. Statistical test for A and B: non-parametric Friedman test for dose response (line above all bars) and Dunn’s multiple comparison test for each treatment compared to untreated control (asterisks above corresponding bars). C: Statistical test for C: Wilcoxon signed rank test compared to control value = 1. A, B, and C error bars indicate standard error of the mean (SEM) * p < 0.05, ** p < 0.01.
Figure 3
Figure 3
Analysis of DNA damage and expression of DNA repair genes. (A) DNA strand breaks detected via γH2AX immunofluorescence flow cytometry: Percentage of γH2AX-positive PBMCs treated with either 0×, 1×, 4×, or 8× isoproterenol was quantified after 0.5, 1, 3, and 24 after isoproterenol treatment. Data for each treatment consist of n = 5 independent experiments. The percentage of positive cells significantly changes with time and treatment. Two-way repeated-measure ANOVA shows statistical significance of both treatment (p = 0.0035) and time (p = 0.0065), as well as treatment × time interaction (p = 0.0069). Asterisks indicate statistical significance after Dunnett’s multiple comparisons test. (B) Internal control for γH2AX immunofluorescence. PBMCs were treated with 1mM H2O2 for 10 min, stained, and counted by flow cytometry with treated cells. Paired Student’s t-test shows significant increase in the percentage of γH2AX-positive cells after treatment. Data for each treatment consist of n = 13 independent experiments. (C) Expression of genes involved in DNA strand breaks repair 24 h after 0×, 4×, or 8× isoproterenol treatment relative to non-treated cells. Data consist of 1× n = 3, 4× n = 8, and 8× n = 16 independent experiments. Isoproterenol treatment did not significantly affect gene expression. A, B, and C error bars indicate standard error of the mean (SEM) * p < 0.05, ** p < 0.01, *** p < 0.005.
Figure 4
Figure 4
Determination of caspase activity and SRC gene expression. (A) Caspase activity and gene expression measurements were performed 24 h after the first treatment. Data for each treatment consist of n = 6 independent experiments. Non-parametric Friedman test shows significant changes in caspase activity for dose response (line above all bars), while Dunn’s multiple comparison test for each treatment did not reach statistical significance when compared to untreated cells. Asterisks indicate statistical significance after Dunnett’s multiple comparisons test. (B) Internal control for caspase activity assay. PBMCs were treated with 1mM etoposide for 10 min and analyzed parallel to treated cells. Paired Student’s t-test shows significant increase in caspase relative activity after etoposide treatment. Data represent means with a standard error of the mean of n = 6 independent experiments. (C) Expression of the SRC kinase gene after single (1×) and repeated (4× and 8×) isoproterenol treatment. Relative gene expression significantly increases after 4x and 8x isoproterenol treatment (Wilcoxon signed rank test compared to control value = 1, asterisks above corresponding bars). Data for each treatment consist of 1× n = 3, 4× n = 8, and 8× n = 16 independent experiments. A, B, and C error bars indicate standard error of the mean (SEM) * p < 0.05, ** p < 0.01, *** p < 0.005.
Figure 5
Figure 5
Isoproterenol-dependent inhibition of proliferation in PHA-stimulated PBMCs. (A) DNA synthesis was not induced by isoproterenol treatment. After 48 (A,B) or 72 h (C) incubation, DNA synthesis was increased in PHA-stimulated cells but reduced if cells were previously treated with isoproterenol. Data for each treatment consist of n = 11 and n = 4 independent experiments for B and C, respectively. Non-parametric Friedman test shows significant changes in newly incorporated EdU for dose response (line above all bars), while Dunn’s multiple comparison test was performed to compare each treatment to untreated cells (asterisks above corresponding bars). Expression of CDKN1A (D) and CCND1 (E) after 24 h after single (1×) and repeated (4× and 8×) isoproterenol treatment. CDKN1A relative gene expression significantly increases while CCDN1 significantly decreases after 8x isoproterenol treatment (Wilcoxon signed rank test compared to control value = 1, asterisks above corresponding bars). Data for each treatment consists of n = 3 for 1× treated and 4× n = 8 and 8× n = 16 independent experiments. A, B, and C error bars indicate standard error of the mean (SEM) * p < 0.05, ** p < 0.01, *** p < 0.005.
Figure 6
Figure 6
Treatment of isoproterenol in PBMCs induces cellular adhesion. (A) Representative scanning electron microscope pictures from cultured PBMCs 24 h after 8× isoproterenol treatment. Arrows show cell adhesion. (B) Normalized gene expression of VCAN in PBMCs after single (1×) and repeated treatment (4× and 8×) with isoproterenol. VCAN relative gene expression significantly increased 24 h after 4× and 8× isoproterenol treatment (Wilcoxon signed rank test compared to control value = 1, asterisks above corresponding bars). Data for each treatment consist of n = 3 for 1× treated and 4× n = 8 and 8× n = 16 independent experiments. Error bars indicate standard error of the mean (SEM) * p < 0.05, ** p < 0.01.
Figure 7
Figure 7
Senescence-induced beta-galactosidase activity. (A,B) PBMCs and (C,D) T cells. Luminescence (=amount of β-galactosidase) was measured after 24 h (A,C) and 48 h (B,D). Non-parametric Friedman test shows significant increase in luminescence in a dose-dependent manner (line above all bars), while Dunn’s multiple comparison test was performed to compare each treatment to the control untreated cells (asterisks above corresponding bars). Data for each treatment consist of n = 5 independent experiments. Error bars indicate standard error of the mean (SEM) * p < 0.05, ** p < 0.01, *** p < 0.005.
Figure 8
Figure 8
Schematic representation of main outcomes in the context of previously published results. (1). Inhibition of TNFR2, which might expose telomere to be recognized by non-homologous end-joining (NHEJ) repair proteins resulting in telomere shortening. (2). Low DNA damage induced SRC-mediated activation of p38, reducing CASP activity and promoting cell survival and senescence. (3). Upregulation of CDNK1A induces downregulation of CCND1, leading to suppression of cell proliferation after PHA stimulus. (4). Upregulation of VCAN induces cell adhesion.

Similar articles

References

    1. Godoy L.D., Rossignoli M.T., Delfino-Pereira P., Garcia-Cairasco N., de Lima Umeoka E.H. A Comprehensive Overview on Stress Neurobiology: Basic Concepts and Clinical Implications. Front. Behav. Neurosci. 2018;12:127. doi: 10.3389/fnbeh.2018.00127. - DOI - PMC - PubMed
    1. Goldstein D.S. Adrenal responses to stress. Cell Mol. Neurobiol. 2010;30:1433–1440. doi: 10.1007/s10571-010-9606-9. - DOI - PMC - PubMed
    1. Tank A.W., Lee Wong D. Peripheral and central effects of circulating catecholamines. Compr. Physiol. 2015;5:1–15. doi: 10.1002/cphy.c140007. - DOI - PubMed
    1. Antonini S.R., Stecchini M.F., Ramalho F.S. Development and Function of the Adrenal Cortex and Medulla in the Fetus and Neonate. In: Deal C.S.K.a.C.L., editor. Maternal-Fetal and Neonatal Endocrinology Physiology, Pathophysiology, and Clinical Management. Elsevier; Amsterdam, The Netherlands: 2020. pp. 611–623.
    1. Crary B., Hauser S.L., Borysenko M., Kutz I., Hoban C., Ault K.A., Weiner H.L., Benson H. Epinephrine-induced changes in the distribution of lymphocyte subsets in peripheral blood of humans. J. Immunol. 1983;131:1178–1181. doi: 10.4049/jimmunol.131.3.1178. - DOI - PubMed

LinkOut - more resources