. 2024 Nov 29;14(12):1532.
doi: 10.3390/biom14121532.

Higher-Order DNA Secondary Structures and Their Transformations: The Hidden Complexities of Tetrad and Quadruplex DNA Structures, Complexes, and Modulatory Interactions Induced by Strand Invasion Events

Affiliations

Higher-Order DNA Secondary Structures and Their Transformations: The Hidden Complexities of Tetrad and Quadruplex DNA Structures, Complexes, and Modulatory Interactions Induced by Strand Invasion Events

Jens Völker et al. Biomolecules. .

Abstract

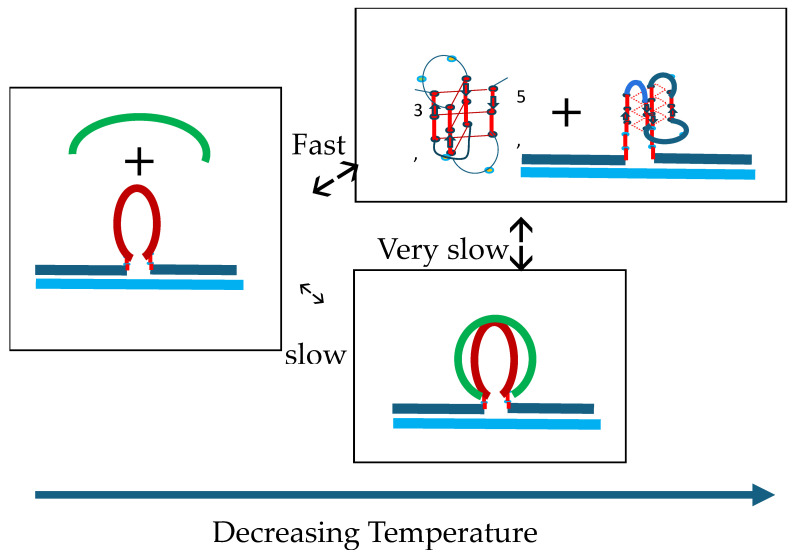
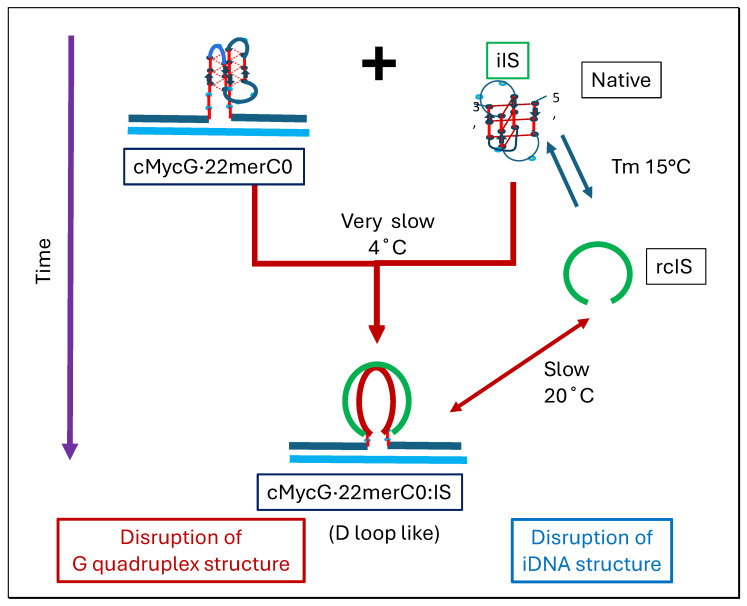
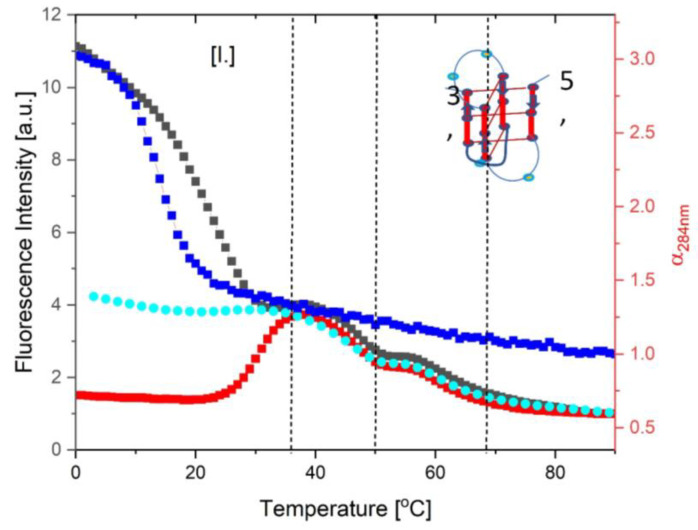
We demonstrate that a short oligonucleotide complementary to a G-quadruplex domain can invade this iconic, noncanonical DNA secondary structure in ways that profoundly influence the properties and differential occupancies of the resulting DNA polymorphic products. Our spectroscopic mapping of the conformational space of the associated reactants and products, both before and after strand invasion, yield unanticipated outcomes which reveal several overarching features. First, strand invasion induces the disruption of DNA secondary structural elements in both the invading strand (which can assume an iDNA tetrad structure) and the invaded species (a G-quadruplex). The resultant cascade of coupled alterations represents a potential pathway for the controlled unfolding of kinetically trapped DNA states, a feature that may be characteristic of biological regulatory mechanisms. Furthermore, the addition of selectively designed, exogenous invading oligonucleotides can enable the manipulation of noncanonical DNA conformations for biomedical applications. Secondly, our results highlight the importance of metastability, including the interplay between slower and faster kinetic processes in determining preferentially populated DNA states. Collectively, our data reveal the importance of sample history in defining state populations, which, in turn, determine preferred pathways for further folding steps, irrespective of the position of the thermodynamic equilibrium. Finally, our spectroscopic data reveal the impact of topological constraints on the differential stabilities of base-paired domains. We discuss how our collective observations yield insights into the coupled and uncoupled cascade of strand-invasion-induced transformations between noncanonical DNA forms, potentially as components of molecular wiring diagrams that regulate biological processes.

Keywords: DNA self-regulation pathways; DNA strand invasion; G-quadruplex/iDNA/duplex interconversions; competing kinetic and thermodynamic states; coupled transformations of higher-order DNA states; metastable DNA states; rough energy landscapes.


Conflict of interest statement

The authors declare no conflicts of interest. The funders had no role in the design of the study; in the collection, analyses, or interpretation of data; in the writing of the manuscript; or in the decision to publish the results.

Figures

Figure 1
Figure 1
Figure 1 shows the CD spectra of the native (0 °C, black) and denatured state (90 °C, red) of the cMycG·22merC0 quadruplex (A), the duplex formed from cMycG·IS (C), and the IS single-strand iDNA complex (E). The corresponding normalized CD melting curves, recorded at the wavelength of the respective CD maximum (black curves), the absorbance melting curves at 270 nm (red curves), and the fluorescence melting curves (blue curves) measured for these 3 constructs, with each shown in (B,D,F). Note the unusual shape of the fluorescence melting curve in (D), where the melting of the G4·C4 duplex initially results in an increase in 2Ap fluorescence, followed by significant quenching at a higher temperature. The initial increase in 2Ap fluorescence is what is expected of melting of a duplex containing a stacked 2Ap·T base pair, while the rapid subsequent quenching of 2Ap fluorescence likely is due to the known rapid dark state quenching of 2Ap by neighboring guanines when both bases are freely mobile. As expected, (E) does not show a fluorescent melting curve, as the free IS does not contain a fluorescent 2Ap base.
Scheme 7
Scheme 7
cMycG·22merC0 plus the IS. The invasion and expulsion of the IS.
Scheme 8
Scheme 8
cMycG·22merC0 plus the IS hysteresis.
Scheme 9
Scheme 9
cMycG·22merC0:IS; the coupled exchange of the IS and 22merC0 bound to cMycG.
Figure 6
Figure 6
An overlay of appropriately scaled fluorescence melting curves for isolated cMycG·22merC0 (blue curve, right Y axis) over the fluorescence melting (black and red, left Y axis) and reannealing curves (cyan, left Y axis) of cMycG·22merC0 with the IS added. The black curve corresponds to the melting of the cMycG·22merC0:IS sample immediately after mixing, whereas the red curve is the melting curve obtained after 2 weeks of incubation at 4 °C. The fluorescence melting curves of cMycG·22merC0 with the IS, added in Figure 6, are identical to those depicted in Figure 3.
Figure 7
Figure 7
Compares, in absolute fluorescence terms, the fluorescent melting curves of the cMycG·22merC0 complex, which never has been exposed to the IS (black dots), to that measured for cMycG·22merC0:IS immediately after mixing (red dots). The small difference in initial fluorescence intensity at 0 °C reflects an inner filter effect, not exceeding 6%, caused by the absorbance of the native IS. This inner filter effect is likely absent at higher temperatures when the IS is denatured, as neither the denatured IS nor cMycG·IS (or native cMycG·22merC0:IS) significantly absorb at 308 nm.
Scheme 10
Scheme 10
cMycG·22merC0 plus IS <-> cMycG· IS plus 22merC0 <-> cMycG plus IS plus 22merC0.
Chart 1
Chart 1
Flowchart 1.
Chart 2
Chart 2
Flowchart 2.
Chart 3
Chart 3
Flowchart 3.
Chart 4
Chart 4
Flowchart 4.
Scheme 1
Scheme 1
Illustrates the relationships between the three DNA oligonucleotides and their mono-, bi-, and/or trimolecular complexes.
Scheme 2
Scheme 2
Pictorial guide of the DNA states and their graphical representations (a) and domain assignments (b).
Chart 1
Chart 1
Flowchart 1.
Chart 2
Chart 2
Flowchart 2.
Chart 3
Chart 3
Flowchart 3.
Chart 4
Chart 4
Flowchart 4.
Scheme 3
Scheme 3
cMycG·22merC0.
Scheme 4
Scheme 4
cMycG·IS.
Scheme 5
Scheme 5
IS.
Figure 2
Figure 2
The native (0 °C) CD spectra (A), UV spectra (C), and fluorescence excitation spectra (E) of a freshly prepared cMycG·22merC0:IS sample (black curves), as well as after incubation at 4 °C for 2 weeks (red curve). Also shown in (A,C,E) are the spectra of both samples under denaturing conditions at 90 °C (dark and light blue). The corresponding CD, UV, and fluorescence melting (black and red) and reannealing (light and dark blue) curves at characteristic wavelengths are shown in (B,D,F), respectively.
Scheme 6
Scheme 6
cMycG·22merC0 plus IS.
Figure 3
Figure 3
An expanded version of Figure 2F. As we show below, the conformational transitions designated 1 and 2 in the temperature domain [I.] are related to one another by the time variable and are discussed together in the text. Vertical lines indicate boundaries between different temperature domains that are defined by clearly distinguishable conformational transformations and are designated by Roman numerals I through IV. Conformational transitions are indicated by Arabic numerals 1 through 4.
Figure 4
Figure 4
The overlay of the CD melting curve at 288 nm, observed for the isolated IS (blue curve, right Y axis) over the fluorescence melting (black and red, left Y axis) and reannealing curves (cyan, left Y axis) of cMycG·22merC0 with the IS added. The black curve corresponds to the melting of the cMycG·22merC0:IS sample immediately after mixing, whereas the red curve is the melting profile obtained after 2 weeks of incubation at 4 °C. The fluorescence melting curves of cMycG·22merC0 with the IS added in Figure 4 are identical with those depicted in Figure 3.
Figure 5
Figure 5
(A) shows the differences in the CD spectrum for cMycG·22merC0:IS at 0 °C obtained immediately after mixing (red curve) and after a 2-week incubation at 4 °C (blue curve). As shown in (B), the CD spectrum of cMycG·22merC0:IS at 0 °C immediately after mixing (red curve) is best approximated by the sum of the spectra of isolated cMycG·22merC0 and the IS (black curve), whereas (C) shows that the CD spectrum of cMycG·22merC0:IS after 2 weeks of incubation at 4 °C (blue) is best approximated by the sum of the CD spectra of the cMycG·i CShort duplex plus the 22merC0·22merG0 duplex minus the 22merG0 single strand (black curve). The subtraction of the 22merG0 single strand is needed to account for the single-stranded overhanging ends in the cMycG·IS duplex.
Figure 8
Figure 8
Comparison between CD spectra for the cMycG·22merC0:IS complex at 36 °C (red: initial heating; blue: following 2 weeks of incubation) versus calculated CD spectra derived by the addition of the IS spectrum at 36 °C to native cMycG·22merC0 in K+ (black) versus the spectrum of isolated 22merC0 36 °C added to the spectrum of cMycG·IS (green). The lack of agreement in the CD spectra compared in Figure 8, especially in terms of the iso-elliptic points between the measured CD spectra and the calculated/expected spectra for cMycG·22merC0 plus the IS and cMycG·IS plus 22merC0 is consistent with the cMycG·22merC0:IS sample at 36 °C not being reflective of a mixture of these two species.
Figure 9
Figure 9
An overlay of the fluorescent melting curves measured for the isolated cMycG·IS complex (blue curve) and the fluorescent melting curves for the 1:1 mixture of preformed cMycG·22merC0 with the IS immediately after mixing (black curve) and after incubation for 2 weeks at 4 °C (red curve). The reannealing curve is shown in cyan. The inspection of Figure 9 reveals a close agreement between the high temperature transitions in all three melting curves. This concurrence suggests that the cMycG·IS complex also is present in the samples consisting of cMycG, 22merC0, and the IS at high temperatures, despite the evidence that the IS is expelled from the G4·C4 loop-duplex at lower temperatures (i.e., see prior discussion of reaction 2).
Figure 10
Figure 10
The comparison of the observed CD spectrum for cMycG·22merC0:IS at 50 °C (red: initial heating; blue: 2 weeks of incubation) versus the calculated CD spectra by the addition of the 22merC0 spectrum at 50 °C to that of native cMycG·IS at 50 °C (black).

Similar articles

Cited by

References

    1. Nussinov R., Wolynes P.G. A second molecular biology revolution? The energy landscapes of biomolecular function. Phys. Chem. Chem. Phys. 2014;16:6321–6322. doi: 10.1039/c4cp90027h. - DOI - PubMed
    1. Wales D.J. Energy Landscapes Applications to Clusters, Biomolecules and Glasses. University of Cambridge; Cambridge, UK: 2004.
    1. Wales D.J. Exploring Energy Landscapes. Annu. Rev. Phys. Chem. 2018;69:401–425. doi: 10.1146/annurev-physchem-050317-021219. - DOI - PubMed
    1. Kim K., Wang J. Potential Energy Landscape and Robustness of a Gene Regulatory Network: Toggle Switch. PLOS Comput. Biol. 2007;3:e60. doi: 10.1371/journal.pcbi.0030060. - DOI - PMC - PubMed
    1. Prada-Gracia D., Gómez-Gardeñes J., Echenique P., Falo F. Exploring the Free Energy Landscape: From Dynamics to Networks and Back. PLOS Comput. Biol. 2009;5:e1000415. doi: 10.1371/journal.pcbi.1000415. - DOI - PMC - PubMed

LinkOut - more resources