. 2024 Dec 10;14(12):1575.
doi: 10.3390/biom14121575.

APOL1 Modulates Renin-Angiotensin System

Affiliations

APOL1 Modulates Renin-Angiotensin System

Vinod Kumar et al. Biomolecules. .

Abstract

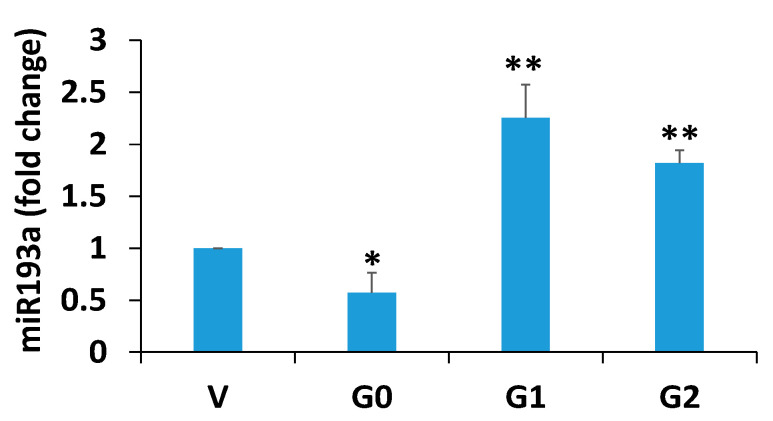
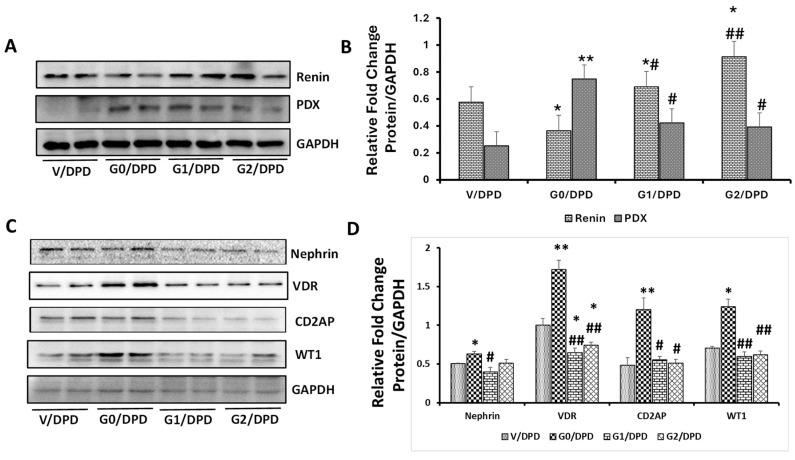
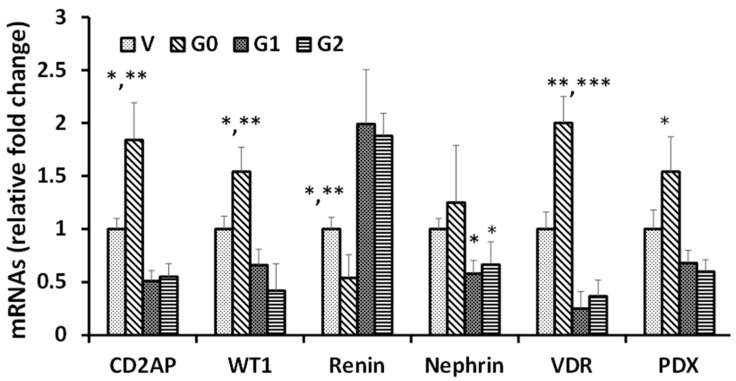
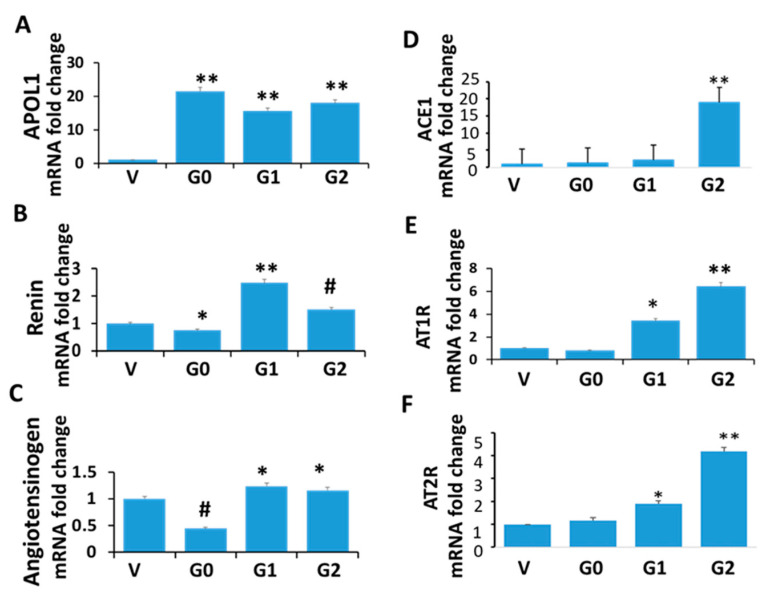
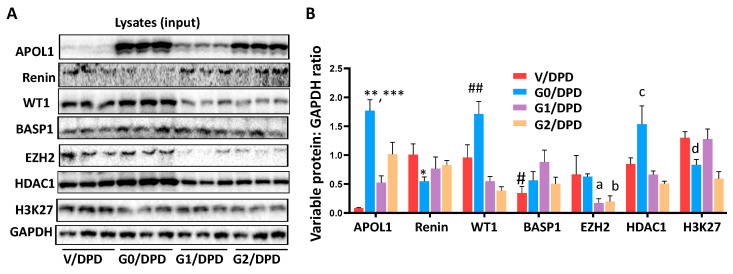
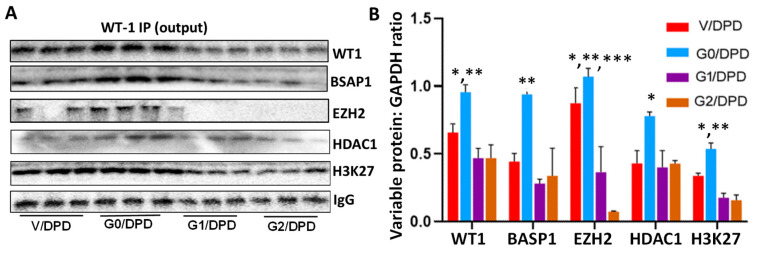
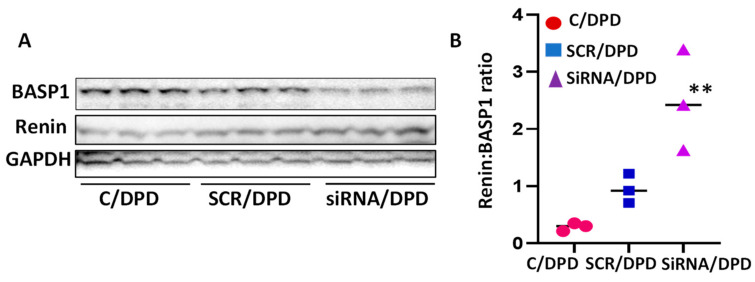
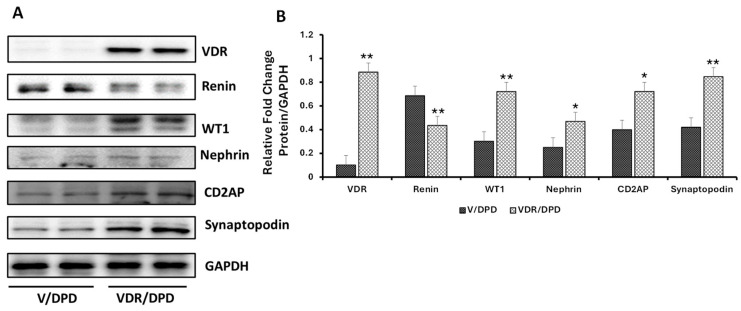
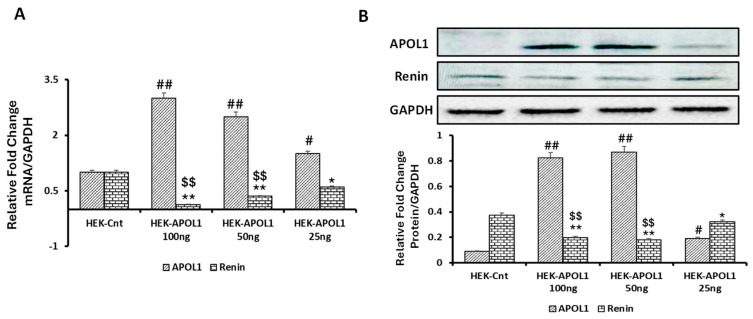
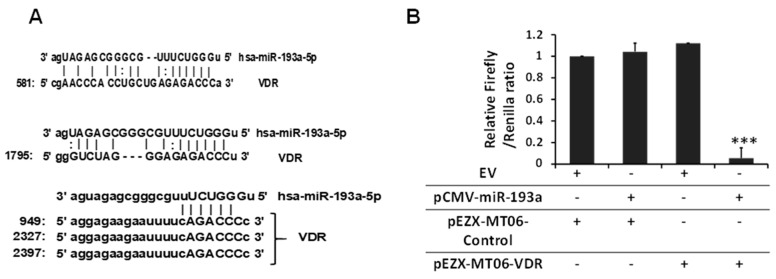
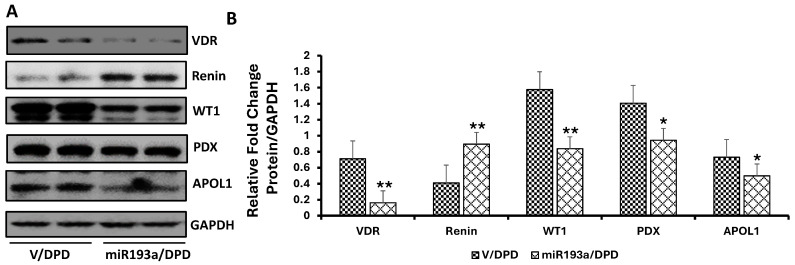
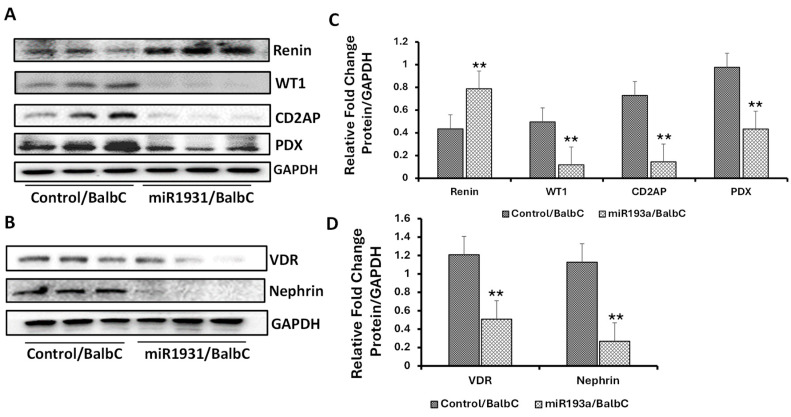
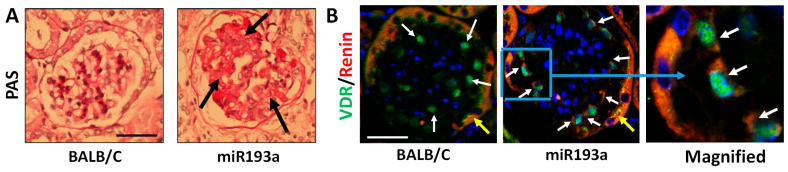
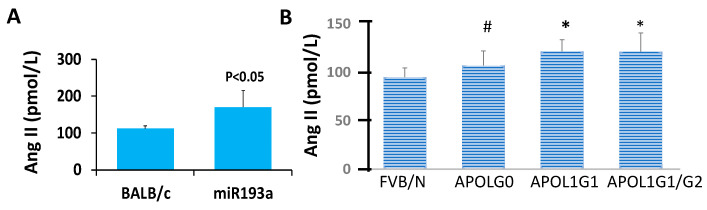
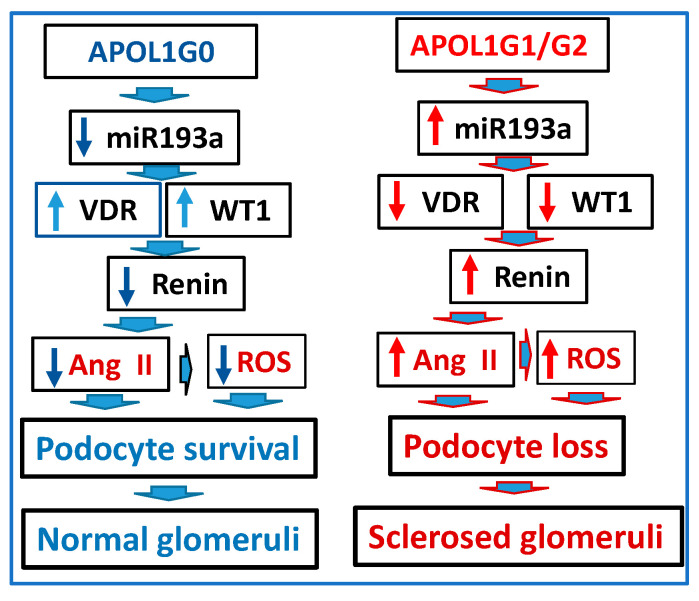
Patients carrying APOL1 risk alleles (G1 and G2) have a higher risk of developing Focal Segmental Glomerulosclerosis (FSGS); we hypothesized that escalated levels of miR193a contribute to kidney injury by activating renin-angiotensin system (RAS) in the APOL1 milieus. Differentiated podocytes (DPDs) stably expressing vector (V/DPD), G0 (G0/DPDs), G1 (G1/DPDs), and G2 (G2/DPDs) were evaluated for renin, Vitamin D receptor (VDR), and podocyte molecular markers (PDMMs, including WT1, Podocalyxin, Nephrin, and Cluster of Differentiation [CD]2 associated protein [AP]). G0/DPDs displayed attenuated renin but an enhanced expression of VDR and Wilms Tumor [WT]1, including other PDMMs; in contrast, G1/DPDs and G2/DPDs exhibited enhanced expression of renin but decreased expression of VDR and WT1, as well as other PDMMs (at both the protein and mRNA levels). G1/DPDs and G2/DPDs also showed increased mRNA expression for Angiotensinogen and Angiotensin II Type 1 (AT1R) and 2 (AT2R) receptors. Protein concentrations of Brain Acid-Soluble Protein [BASP]1, Enhancer of Zeste Homolog [EZH]2, Histone Deacetylase [HDAC]1, and Histone 3 Lysine27 trimethylated [H3K27me3] in WT1-IP (immunoprecipitated proteins with WT1 antibody) fractions were significantly higher in G0/DPDs vs. G1/DPD and G2/DPDs. Moreover, DPD-silenced BASP1 displayed an increased expression of renin. Notably, VDR agonist-treated DPDs showed escalated levels of VDR and a higher expression of PDMMs, but an attenuated expression of renin. Human Embryonic Kidney (HEK) cells transfected with increasing APOL1(G0) plasmid concentrations showed a corresponding reduction in renin mRNA expression. Bioinformatics studies predicted the miR193a target sites in the VDR 3'UTR (untranslated region), and the luciferase assay confirmed the predicted sites. As expected, podocytes transfected with miR193a plasmid displayed a reduced VDR and an enhanced expression of renin. Renal cortical section immunolabeling in miR193a transgenic (Tr) mice showed renin-expressing podocytes. Kidney tissue extracts from miR193aTr mice also showed reduced expression of VDR and PDMMs, but enhanced expression of Renin. Blood Ang II levels were higher in miR193aTr, APOLG1, and APOL1G1/G2 mice when compared to control mice. Based on these findings, miR193a regulates the activation of RAS and podocyte molecular markers through modulation of VDR and WT1 in the APOL1 milieu.

Keywords: APOL1; BASP1; VDR; WT1; miR193a; podocyte; renin-angiotensin system.


Conflict of interest statement

The authors declare no conflicts of interest.

Figures

Figure 3
Figure 3
miR1 93a expression in podocytes expressing Vector (V), APOL1G0, APOL1G1, and APOL1G2. Extracted RNAs (n = 4) were assayed for miR193a. Results (means ± SD) are displayed in a bar diagram. * p < 0.05 vs. V; ** p < 0.01 vs. V and G0.
Figure 1
Figure 1
Effect of APOL1 risk and non-risk alleles on podocyte expression of VDR, renin, and PDMMs. (A) Podocytes expressing Vector, G0, G1, and G2 were differentiated for 10 days. Differentiated podocytes (DPD) were harvested, and proteins were extracted and probed for renin and Podocalyxin (PDX) and reprobed for GAPDH (n = 4). Representative gels from two different lysates are shown. (B) Cumulative densitometric data (n = 4) are shown in bar graphs. Renin: * p < 0.05 vs. V/DPD; # p < 0.05 vs. G2/DPD; ## p < 0.01 vs. G0/DPD.PDX: ** p < 0.01 vs. VD/DPD; # p < 0.05 vs. G0/DPD. (C) The lysates mentioned above (A) were also probed for Nephrin, VDR, CD2AP, WT1, and GAPDH (n = 4). Representative gels from two different lysates are displayed. (D) Cumulative densitometric data (n = 4) are shown in a bar diagram. Nephrin: * p < 0.05 vs. V/DPD, G1/DPD, and G2/DPD; # p < 0.05 vs. V/DPD. VDR: ** p < 0.01 vs. V/DPD, G1/DPD, and G2/DPD; * p < 0.05 vs. V/DPD; # p < 0.05 vs. V/DPD; ## p < 0.01 vs. G0/DPD. CD2AP: ** p < 0.01 vs. V/DPD; # p < 0.05 vs. G0/DPD. WT1: * p < 0.05 vs. V/DPD; ## < 0.01 vs. G0/DPD.
Figure 2
Figure 2
Podocyte mRNA level alterations in APOL1 milieus. To determine mRNA levels of APOL1-expressing podocytes, RNAs were extracted from cellular lysates V/DPDs, G0/DPDs, G1/DPDs, and G2/DPDs (n = 4). cDNAs were amplified using specific primers (CD2AP, WT1, renin, VDR, and PDX [podocalyxin]). CD2AP: * p < 0.05 with respective V and ** p < 0.01 with respective G1 and G2; WT1: * p < 0.05 with respective V and ** p < 0.01 with respective G1 and G2; Renin: * p < 0.05 with respective G0 and ** p < 0.01 with respective G1 and G2; Nephrin: * p < 0.05 with respective V and G0; VDR: ** p < 0.01 with respective V and *** p < 0.001 with respective G1 and G2; PDX: * p < 0.05 with respective V, G1, and G2.
Figure 4
Figure 4
Renin-angiotensin status in APOL1 milieus. RNAs were extracted from V/DPD, G0/DPD, G1/DPD, and G2/DPD (n = 4), and cDNAs were amplified with specific primers for APOL1, renin, angiotensinogen, ACE1, AT1R, and AT2R. (A) APOL1: ** p < 0.01 compared to V. (B) Renin: * p < 0.05 compared to V; ** p < 0.01 compared to V and G0; # p < 0.05 compared to V and G1. (C) # p < 0.05 compared to V, G1, and G2; * p < 0.05 compared to V. (D) ** p < 0.01 compared to V, G0, and G1. (E) AT1R: * p < 0.05 compared to V, G0, and G2; ** p < 0.01 compared to V and G0. (F) AT2R: * p < 0.05 compared to V and G0; ** p < 0.01 compared to V, G0, and G1.
Figure 5
Figure 5
The structural construct of the WT1-BASP1 repressor complex. (A) Homology modeling and docking studies suggested the binding of WT1-BASP1 repressor complex on the renin promoter. (B) A schematic diagram displays the formation of the WT1-BASP1 repressor complex at the renin promoter. WT1 recruits BASP1, EZH2, and HDAC1, inducing methylation at Lysine 27 residues at Histone (H) 3 tail.
Figure 6
Figure 6
Analysis of input lysates of podocytes expressing APOL1 non-risk and risk alleles. (A) Proteins were extracted from the cellular lysates of V/DPDs, G0/DPs, G1/DPDs, and G2/CDPs (n = 3–4). Gels from three independent lysates are displayed. (B) Cumulative densitometric data of proteins displayed in 3A are shown in a bar diagram. APOL1: ** p < 0.01 vs. G1/DPD and G2/DPD; *** p < 0.001 vs. V/DPD; Renin: * p < 0.05 vs. respective variables; WT1: ## p < 0.01 vs. respective variables; BASP1: # p < 0.05 vs. respective variables; EZH2: a p < 0.01 vs. V/DPD and G0/DPD; b p < 0.01 vs. V/DPD and G0/DPD; HDAC1: c p < 0.01 vs. respective other variables; H3K27me3: d p < 0.01 vs. V/DPD, G1/DPD, and G2/DPD.
Figure 7
Figure 7
Analysis of WT1 antibody-bound proteins (output). (A). Cellular lysates from the protocol of Figure 6A were immunoprecipitated (IP) with the WT1 antibody. Protein blots of WT1-IP fractions were probed for WT1, renin, EZH2, HDAC1, H3K27me3, and IgG (n = 3). Gels from 3 independent cellular lysates are displayed. (B). Cumulative densitometric data from blots of the Figure 7A (n = 3). WT1: * p < 0.05 vs. V; ** p < 0.01 vs. G1 and G2. BASP1: ** p < 0.01 vs. respective other variables. EZH2: * p < 0.05 vs. V; ** p < 0.01 vs. G1; *** p < 0.001 vs. G2. HDAC1: * p < 0.05 vs. other variables. H3K27: * p < 0.05 vs. V; ** p < 0.01 vs. G1 and G2.
Figure 8
Figure 8
Effect of BASP1 silencing on the podocyte expression of renin. (A) Cellular lysates of control podocytes (C/DPD), scrambled siRNA- (SCR/DPD), and BASP1-SiRNA-transfected podocytes (SiRNA/DPD) were probed for renin and GAPDH (n = 3). Gels of three independent lysates are shown. (B) Cumulative densitometric data (n = 3) are shown in bar graphs. ** p < 0.01 vs. C/DPD and SCR/DPD.
Figure 9
Figure 9
Effect of VDR overexpression on renin and podocyte molecular markers (PDMMs). (A) DPDs were incubated in media containing either vehicle (DMSO) or VDA (EB 1089, 10 nM) for 48 h (n = 4). Proteins were extracted and probed for VDR, renin, and PDMMs (WT1, Nephrin, CD2AP, and Synaptopodin) and GAPDH. Gels from two different lysates from V/DPD (vehicle-treated) and VDR/DPD (VDA-treated) are shown. (B) Cumulative densitometric data for different variables are shown in bar graphs. * p < 0.0.5 and ** p < 0.01 vs. respective V/DPD.
Figure 10
Figure 10
Dose-response effect of APOL1 induction on renin expression in HEK cells. HEK cells were transfected with either empty vector (control, HEK-Cnt) or APOL1 plasmid (HEK-APOL1) in different concentrations (25, 50, and 100 ng) for 48 h (n = 4). Cells were harvested, and proteins and RNAs were extracted. (A) cDNAs were amplified with specific primers of APOL1 and renin. Cumulative data are shown in a bar diagram. APOL1 expression: # p < 0.05 and ## p < 0.01 vs. HEK-Cnt. Renin: * p < 0.05 and ** p < 0.01 vs. HEK control; $$ p < 0.01 vs. HEK-APOL1, 25 ng. (B) Proteins were probed for APOL1, renin, and GAPDH. Representative gels are displayed in the upper panel. Cumulative densitometric data are shown in bar graphs. APOL1: # p < 0.05 and ## p < 0.01 vs. HEK-Cnt. Renin: * p < 0.05 and ** p < 0.01 vs. HEK-Cnt; $$ p < 0.01 vs. HEK-APOL1, 25 ng.
Figure 11
Figure 11
Validation of miR193a putative binding sites on VDR. (A) Available online in silico analysis tools (microrna.org; mirdb.org and TargetScan). VDR was predicted as a potential target for miR193a-5p. Predicted binding sites are shown. (B) Podocytes were transiently co-transfected by using Lipofectamine 2000 with wild-type or control reporter 3′-UTR plasmids and miR-193a (pCMV-miR-193a) or negative miR (control, AM17110) in combination. After 48 h of co-transfection, the firefly luciferase activities were measured using the duo-luciferase HS assay. The relative luciferase activity was calculated by normalizing it to Renilla luciferase. The presented results are cumulative values of three independent experiments, each performed in triplicate. *** p < 0.001 vs. other variables.
Figure 12
Figure 12
Effect of miR193a on the expression of VDR, renin, and PDMMs. (A) Podocytes were transfected with empty vector or miR19a plasmid and differentiated (n = 4). Cellular lysates were probed for VDR, renin, PDMMs (WT1, PDX, APOL1), and GAPDH. Gels from two different lysates are shown. (B) Cumulative data are shown in bar graphs. * p < 0.05 and ** p < 0.0.01 vs. respective V/DPD.
Figure 13
Figure 13
Renal tissue expression profile of VDR, renin, and PDMMs in control and miR193aTr mice. (A) Renal tissues were harvested from control (Balb/C, wild-type) and miR193aTr mice (n = 3). Proteins were probed for renin, PDMMs (WT1, CD2AP, PDX), and GAPDH. Gels from three different lysates are displayed. (B) Tissue lysates from the above mice were reprobed for VDR, Nephrin, and GAPDH (n = 3). Gels from different lysates are shown. (C) Cumulative densitometric data from gels are shown in panel A in bar graphs. ** p < 0.01 vs. control/Balb C mice. (D) Cumulative densitometric data from gels displayed in Panel B are shown in a bar diagram. ** p < 0.0.01 vs. control/Balb C mice.
Figure 14
Figure 14
Renal histology and VDR/renin expression in control (BALB/C) and miR193aTr mice. (A) Representative glomeruli from a control and miR193aTr mice. Sclerosis is displayed by black arrows in a glomerulus from an miR193aTr mouse. (B) Glomeruli were co-labeled with VDR and renin antibodies. Nuclei were stained with DAPI. A representative glomerulus from a control mouse showed co-labeled (VDR and renin) podocytes (white arrows); podocytes predominantly displayed green fluorescence (VDR) and minimal red fluorescence (renin). A representative glomerulus from an miR193aTr mouse displayed both green (VDR) and red (renin) fluorescence in podocytes (white arrows). Parietal epithelial cells showed orange fluorescence (combination of predominant red and mild green fluorescence, indicated by yellow arrows) in glomeruli from both BALB/C and miR193aTr mice. C. Blue square is magnified to display co-labeling of VDR and renin in podocytes. Scale bar = 50 µM.
Figure 15
Figure 15
Ang II levels were determined in plasma samples of control (BALB/C, n = 6 and FVBN, n = 9) and experimental (miR193aTR, n = 6; APOL1 G0, n = 10; APOL1 G1, n = 9; and APOL1G1/G2, n = 9) mice. Results (means ± SD) are shown in bar diagrams. (A) Plasma Ang II levels in control (BALB/C) and miR193aTr mice. (B) Plasma Ang II levels in control and APOL1 mice. * p < 0.05 vs. FVBN; # p < 0.05 vs. APOL1G1.
Figure 16
Figure 16
A schematic diagram displaying the activation of the RAS contributing to glomerular sclerosis in APOL1 milieus.

References

    1. Kopp J.B., Nelson G.W., Sampath K., Johnson R.C., Genovese G., An P., Friedman D., Briggs W., Dart R., Korbet S., et al. APOL1 genetic variants in focal segmental glomerulosclerosis and HIV-associated nephropath. J. Am. Soc. Nephrol. 2011;22:2129–2137. doi: 10.1681/ASN.2011040388. - DOI - PMC - PubMed
    1. Friedman D.J., Kozlitina J., Genovese G., Jog P., Pollak M.R. Population-based risk assessment of APOL1 on renal disease. J. Am. Soc. Nephrol. 2011;22:2098–2105. doi: 10.1681/ASN.2011050519. - DOI - PMC - PubMed
    1. Kasembeli A.N., Duarte R., Ramsay M., Mosiane P., Dickens C., Dix-Peek T., Limou S., Sezgin E., Nelson G.W., Fogo A.B., et al. APOL1 Risk Variants Are Strongly Associated with HIV-Associated Nephropathy in Black South African. J. Am. Soc. Nephrol. 2015;26:2882–2890. doi: 10.1681/ASN.2014050469. - DOI - PMC - PubMed
    1. Kopp J.B., Heymann J., Winkler C.A. APOL1 Renal Risk Variants: Fertile Soil for HIV-Associated Nephropathy. Semin. Nephrol. 2017;37:514–519. doi: 10.1016/j.semnephrol.2017.07.004. - DOI - PMC - PubMed
    1. Kasembeli A.N., Duarte R., Ramsay M., Naicker S. African origins and chronic kidney disease susceptibility in the human immunodeficiency virus era. World J. Nephrol. 2015;4:295–306. doi: 10.5527/wjn.v4.i2.295. - DOI - PMC - PubMed

MeSH terms

LinkOut - more resources