Meta-Analysis
. 2024 Dec 16;14(12):1607.
doi: 10.3390/biom14121607.

Molecular Pathways Linking High-Fat Diet and PM2.5 Exposure to Metabolically Abnormal Obesity: A Systematic Review and Meta-Analysis

Affiliations
Meta-Analysis

Molecular Pathways Linking High-Fat Diet and PM2.5 Exposure to Metabolically Abnormal Obesity: A Systematic Review and Meta-Analysis

Sagrario Lobato et al. Biomolecules. .

Abstract

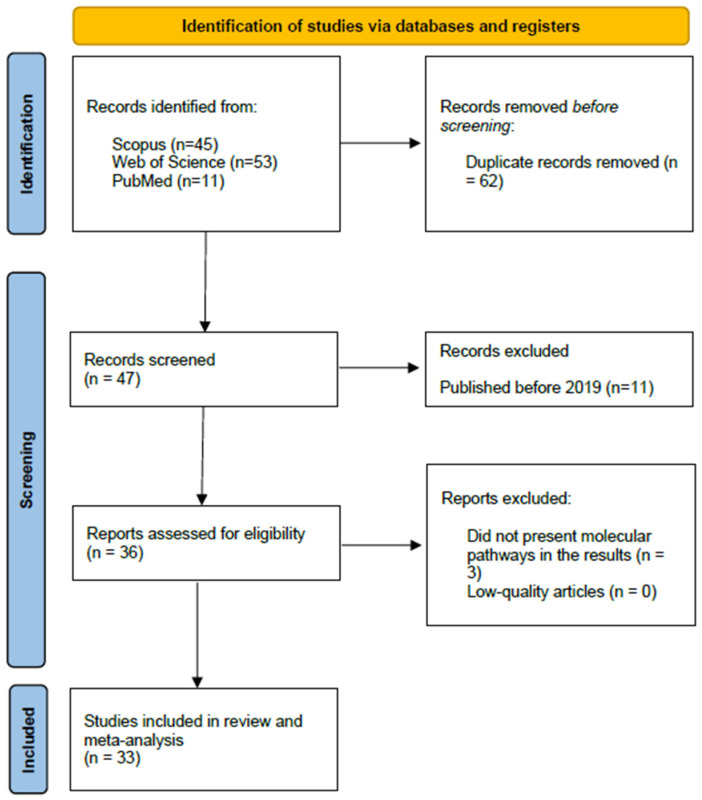
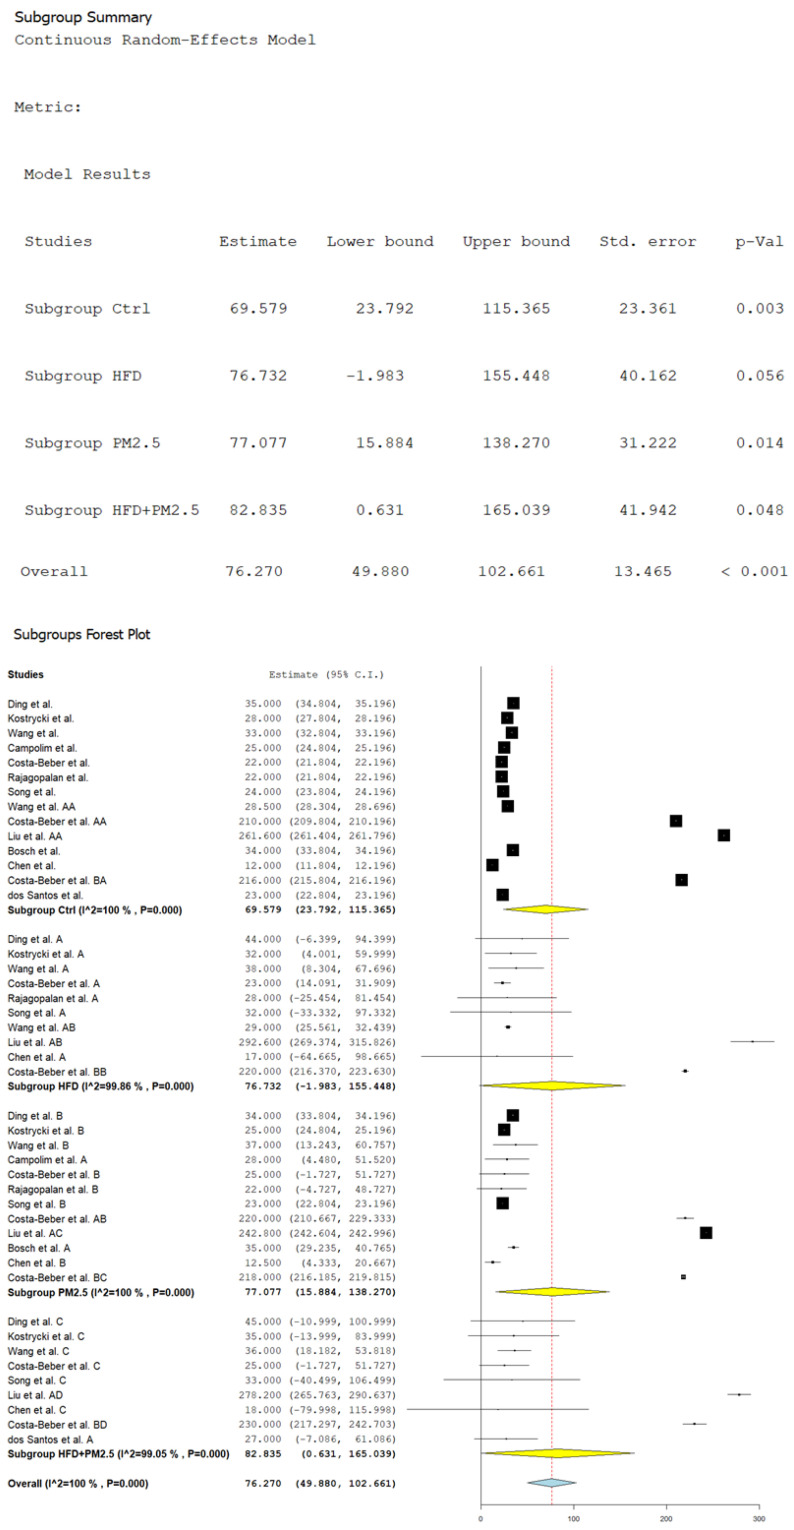
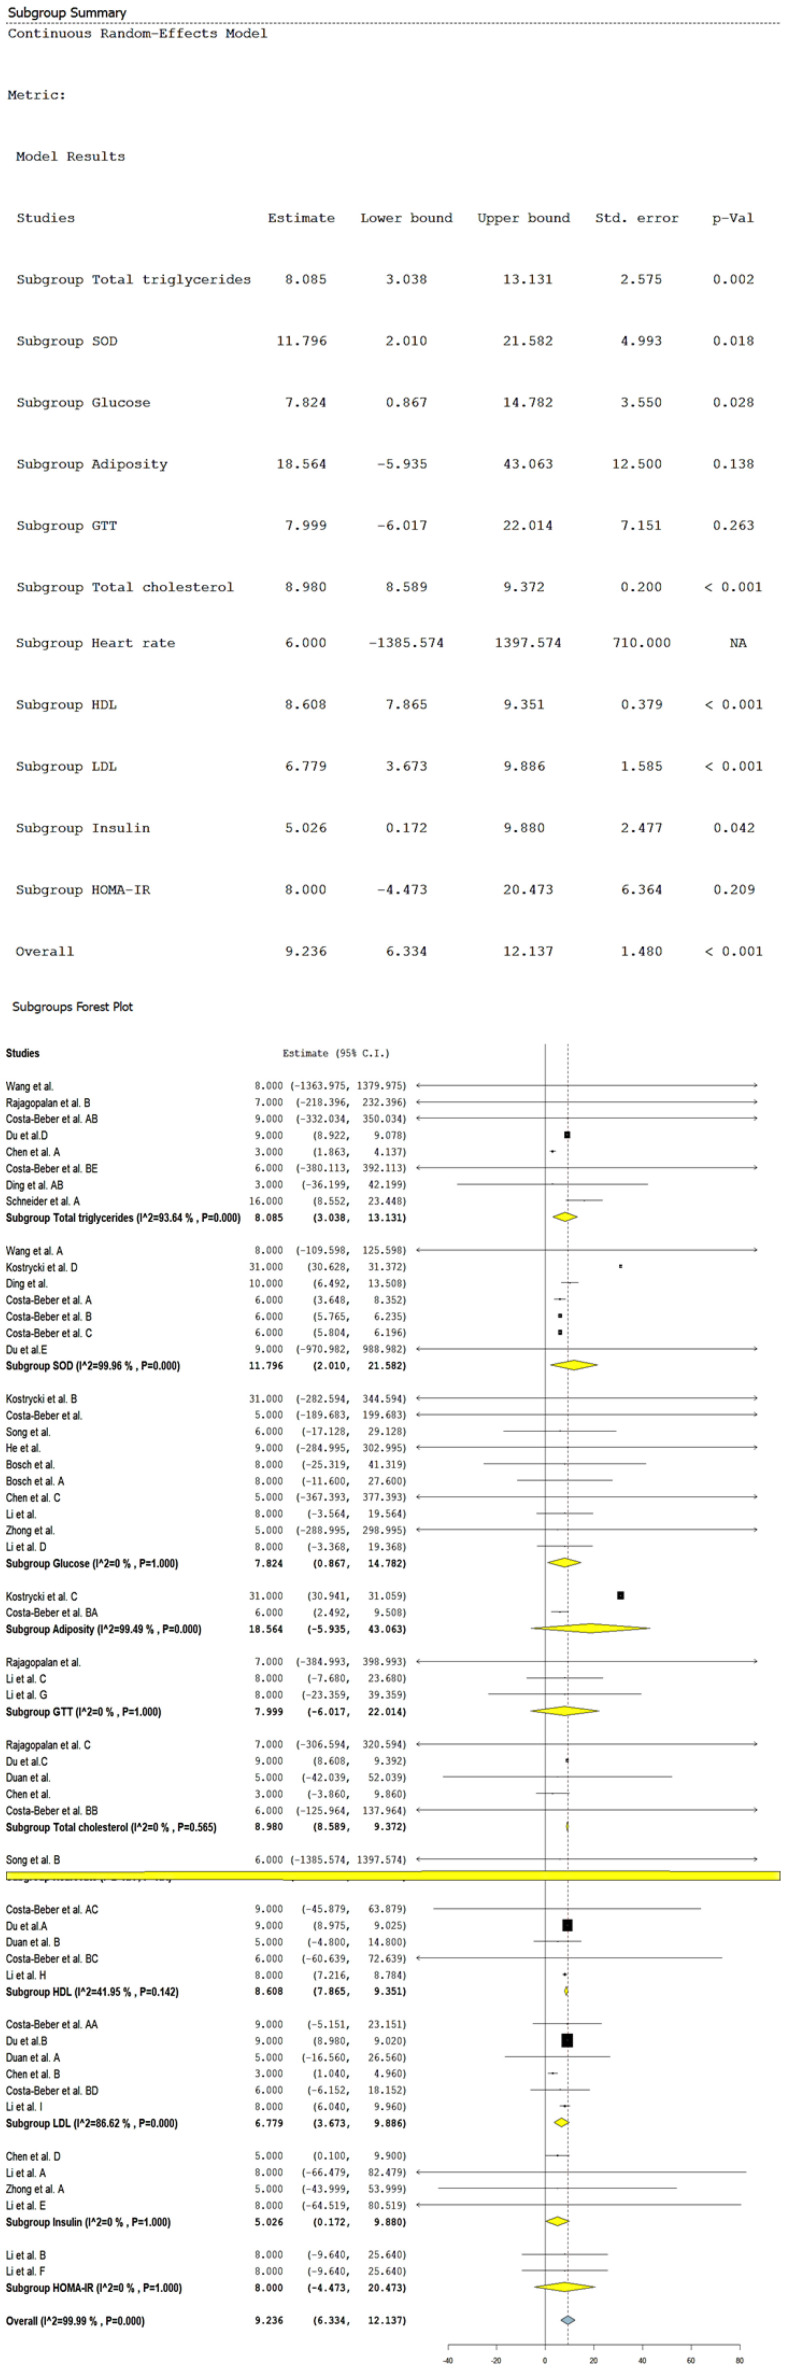
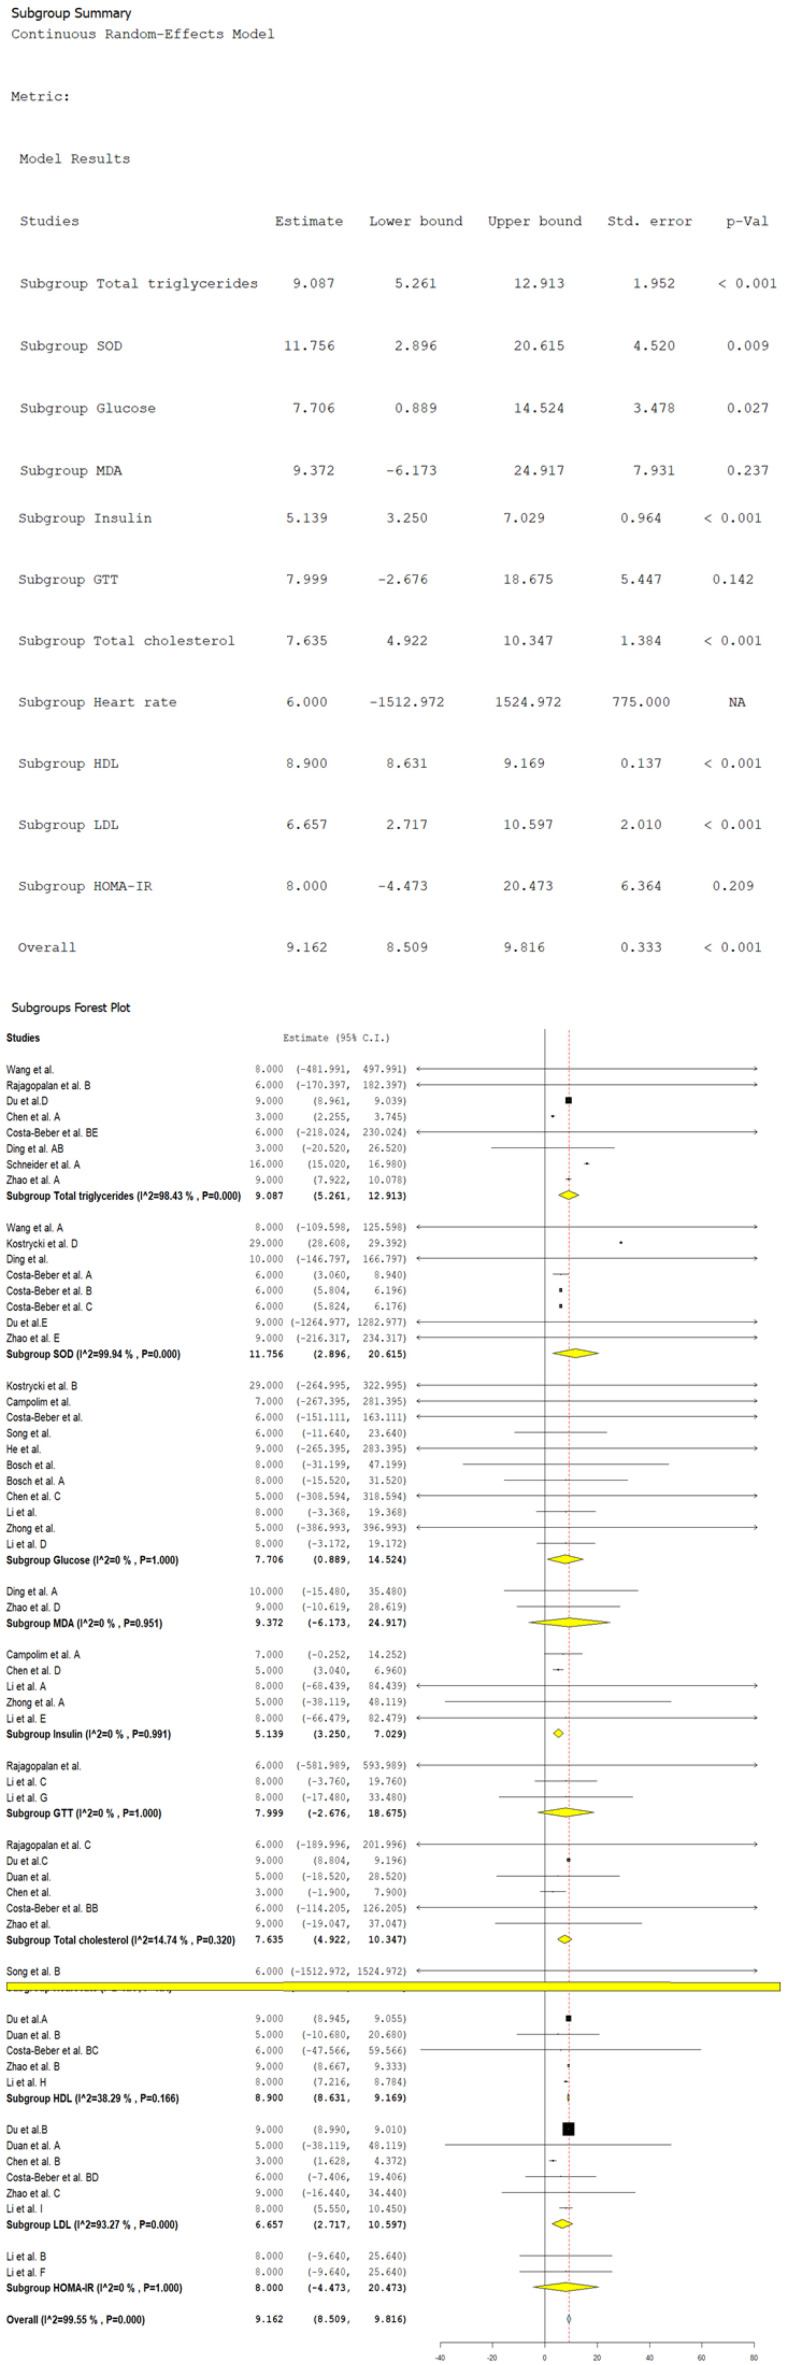
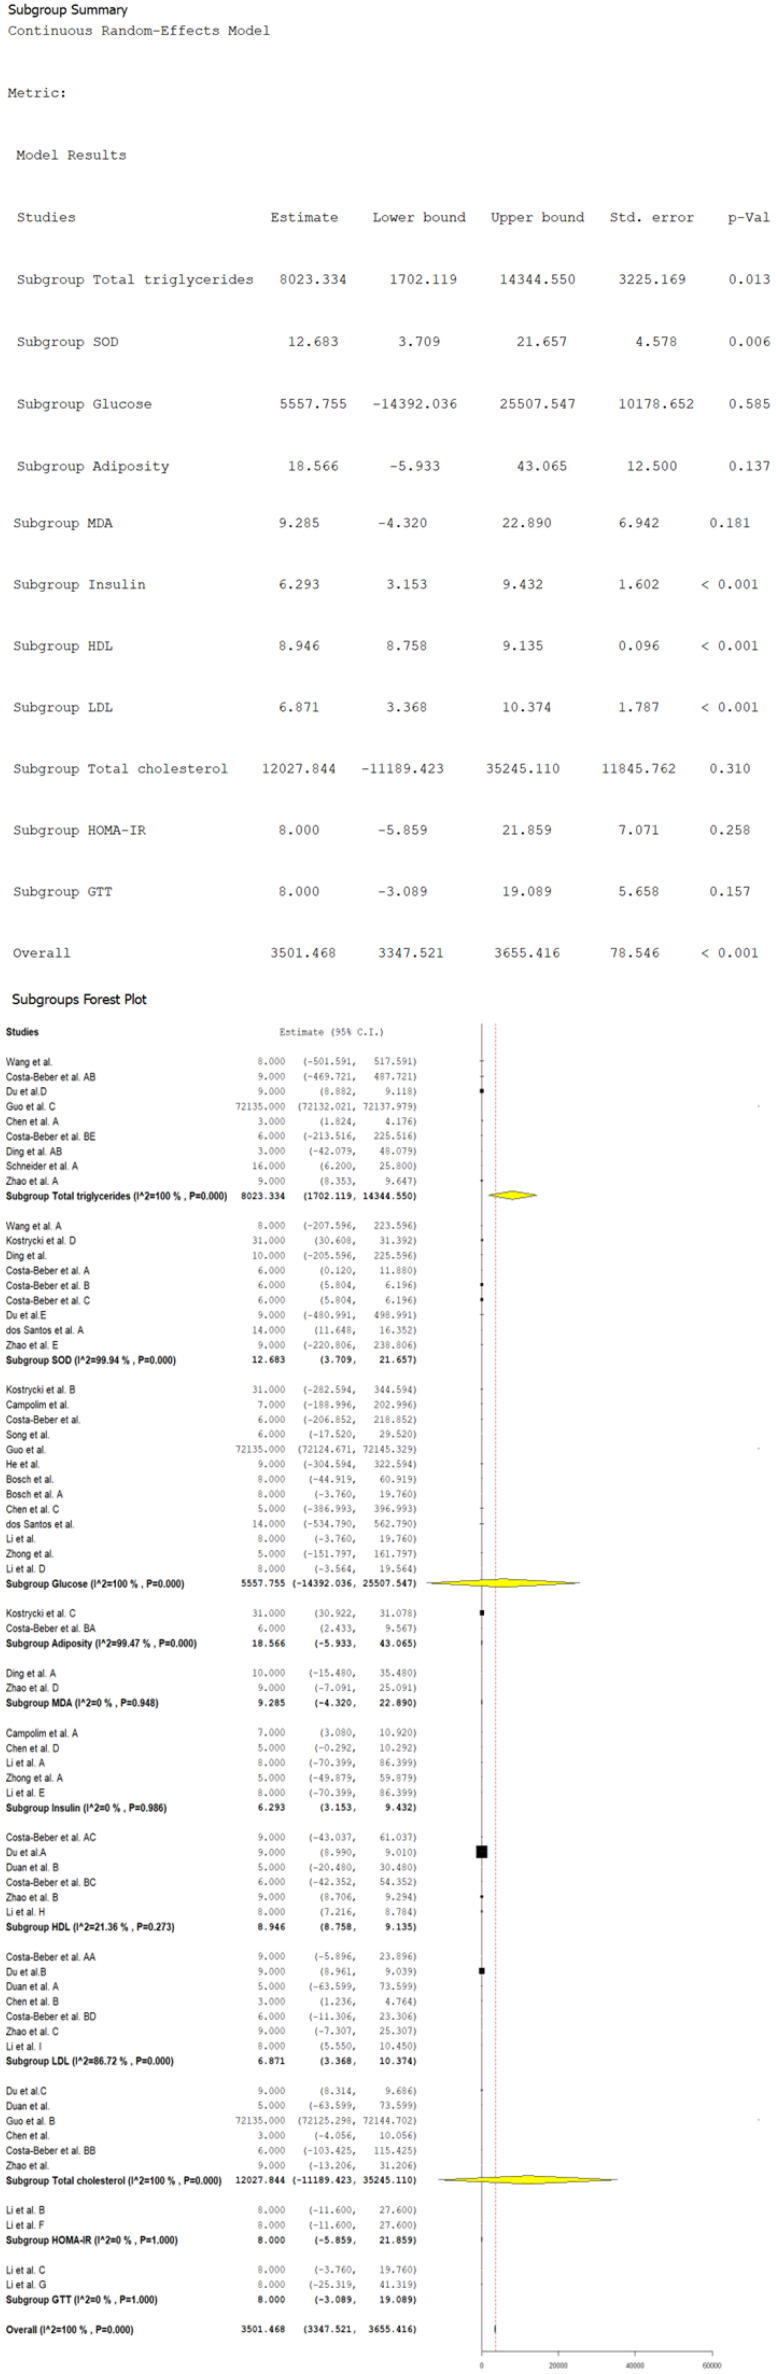
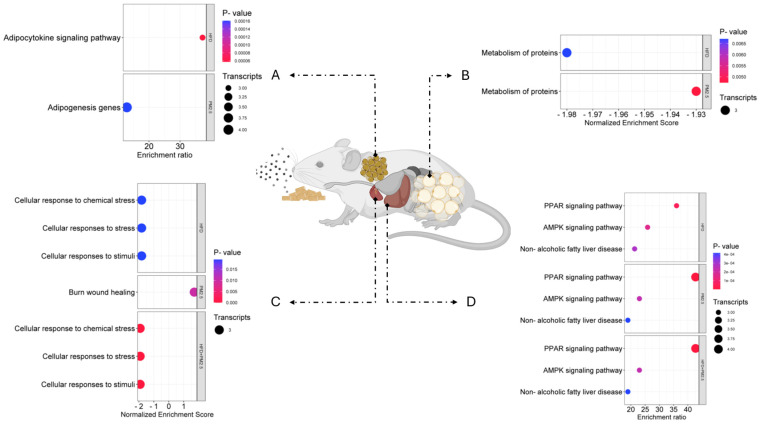
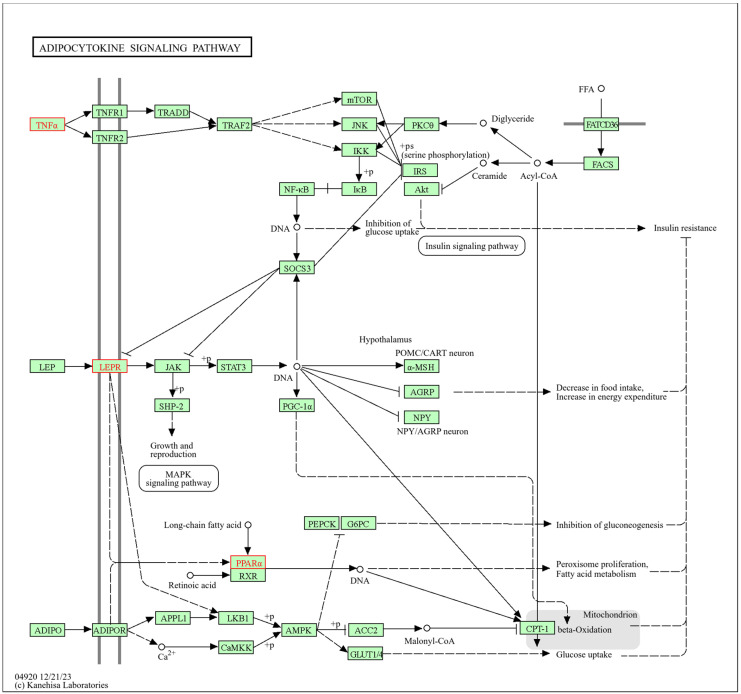
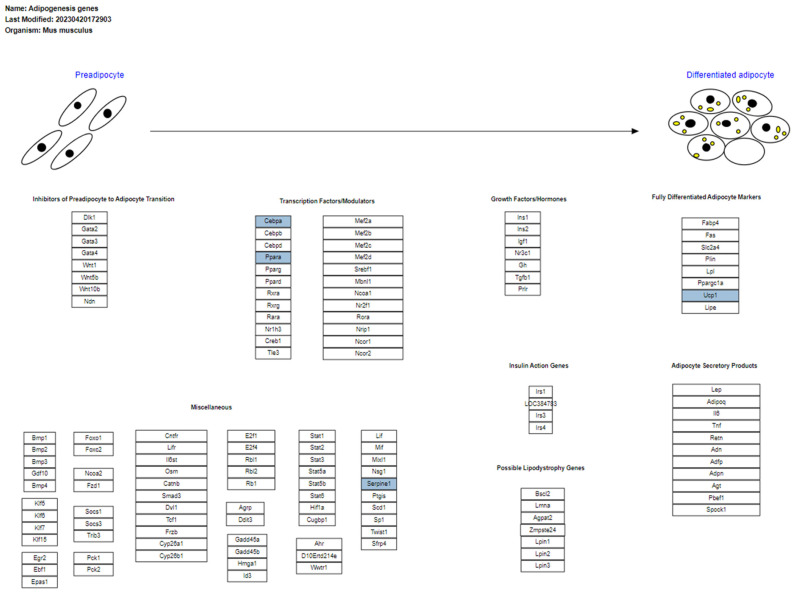
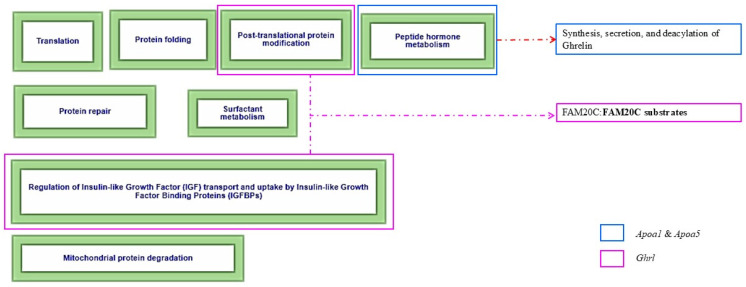
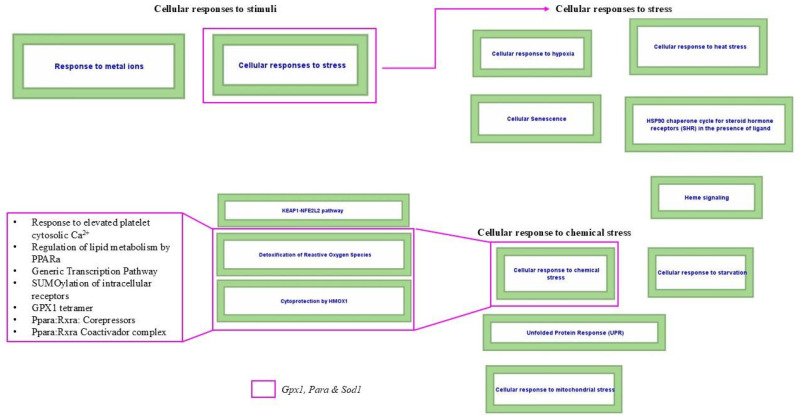
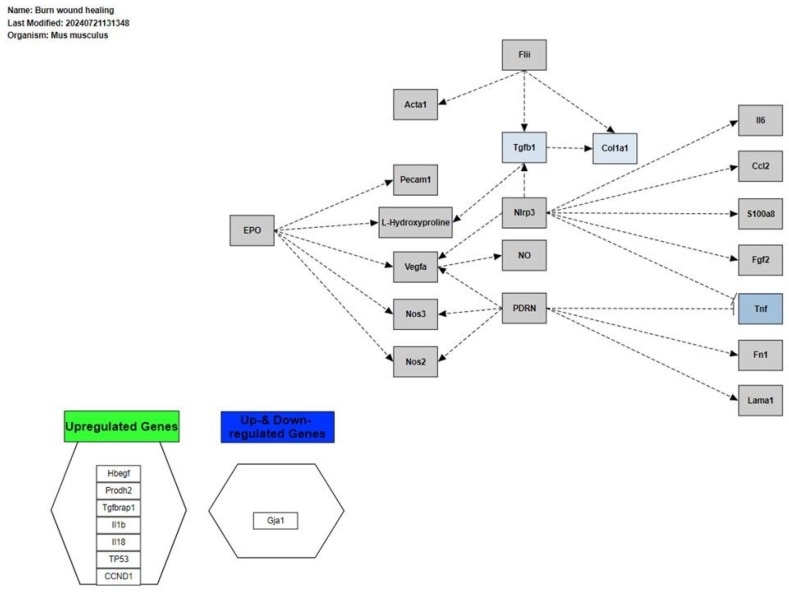
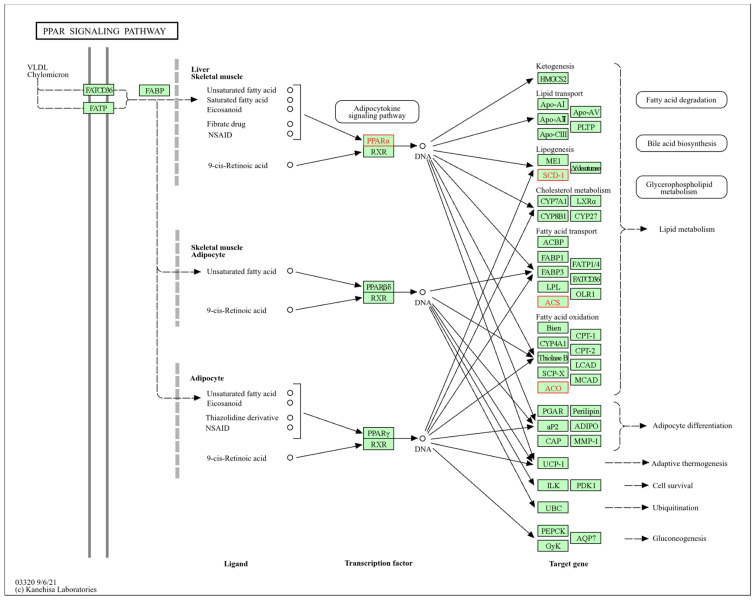
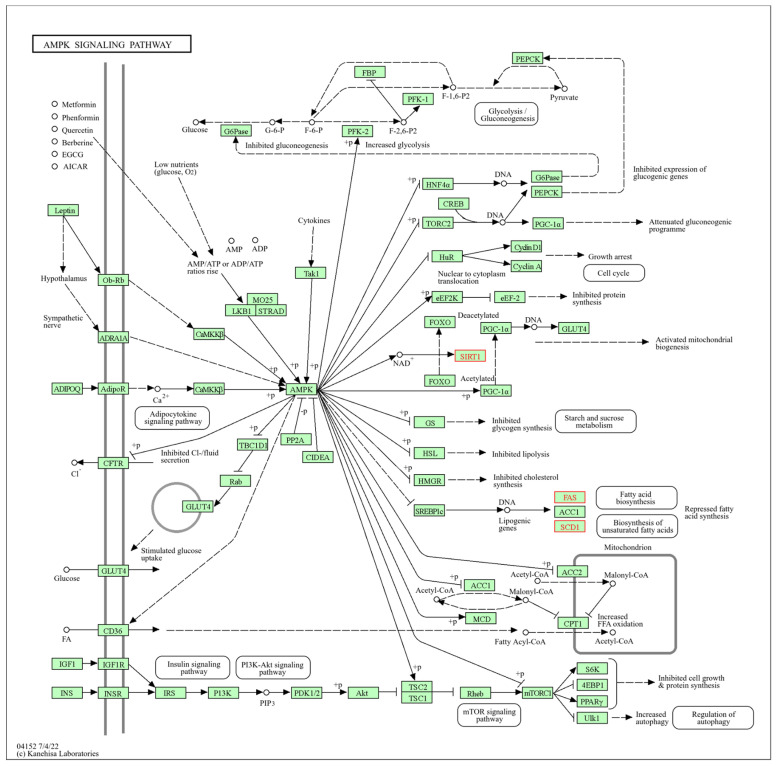
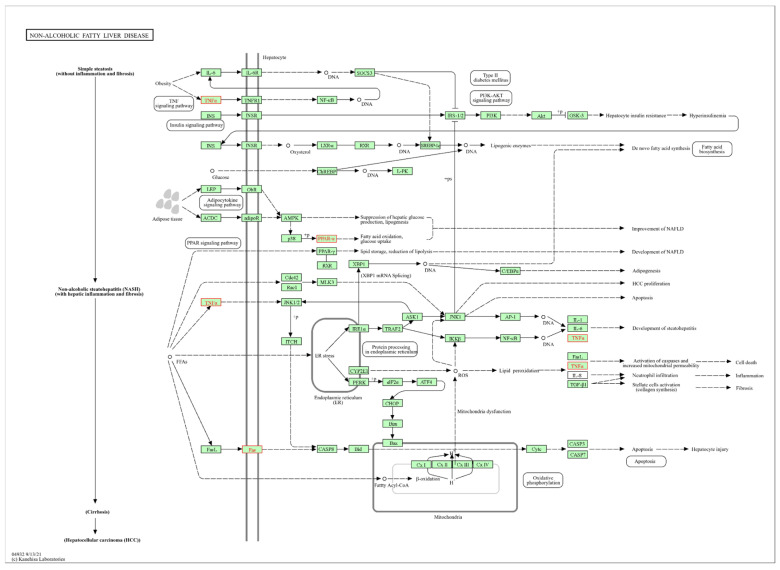
Obesity, influenced by environmental pollutants, can lead to complex metabolic disruptions. This systematic review and meta-analysis examined the molecular mechanisms underlying metabolically abnormal obesity caused by exposure to a high-fat diet (HFD) and fine particulate matter (PM2.5). Following the PRISMA guidelines, articles from 2019 to 2024 were gathered from Scopus, Web of Science, and PubMed, and a random-effects meta-analysis was performed, along with subgroup analyses and pathway enrichment analyses. This study was registered in the Open Science Framework. Thirty-three articles, mainly case-control studies and murine models, were reviewed, and they revealed that combined exposure to HFD and PM2.5 resulted in the greatest weight gain (82.835 g, p = 0.048), alongside increases in high-density lipoproteins, insulin, and the superoxide dismutase. HFD enriched pathways linked to adipocytokine signaling in brown adipose tissue, while PM2.5 impacted genes associated with fat formation. Both exposures downregulated protein metabolism pathways in white adipose tissue and activated stress-response pathways in cardiac tissue. Peroxisome proliferator-activated receptor and AMP-activated protein kinase signaling pathways in the liver were enriched, influencing non-alcoholic fatty liver disease. These findings highlight that combined exposure to HFD and PM2.5 amplifies body weight gain, oxidative stress, and metabolic dysfunction, suggesting a synergistic interaction with significant implications for metabolic health.

Keywords: airborne particulate matter; gene–environment interaction; high-fat diet; metabolic pathways; obesity; oxidative stress; signaling pathways.


Conflict of interest statement

The authors declare no conflicts of interest.

Figures

Figure 1
Figure 1
Flow diagram for study selection.
Figure 2
Figure 2
Random-effects model and subgroup forest plot of body-weight gain by exposure to HFD, PM2.5, and their combination in mice studies. Ding et al., Ding et al. A, Ding et al. B, and Ding et al. C = reference [111]. Kostrycki et al., Kostrycki et al. A, Kostrycki et al. B, and Kostrycki et al. C = reference [112]. Wang et al., Wang et al. A, Wang et al. B, and Wang et al. C = reference [113]. Campolim et al., and Campolim et al. A = reference [115]. Costa-Beber et al., Costa-Beber et al. A, Costa-Beber et al. B, and Costa-Beber et al. C = reference [116]. Rajagopalan et al., Rajagopalan et al. A, and Rajagopalan et al., B = reference [120]. Song et al., Song et al. A, Song et al. B, and Song et al. C = reference [121]. Wang et al. AA, and Wang et al. AB = reference [122]. Costa-Beber et al. AA, and Costa-Beber et al. AB = reference [123]. Liu et al. AA, Liu et al. AB, Liu et al. AC, and Liu et al. AD = reference [125]. Bosch et al., and Bosch et al. A = reference [131]. Chen et al., Chen et al. A, Chen et al. B, and Chen et al. C = reference [132]. Costa-Beber et al. BA, Costa-Beber et al. BB, Costa-Beber et al. BC, and Costa-Beber et al. BD = reference [133]. dos Santos et al., and dos Santos et al. A = reference [135]. Black squares represent the estimated effect size (mean difference) of each individual study, with the size of the square being proportional to the weight of the study in the combined estimate. Black vertical lines indicate the null or no-effect value, which corresponds to 0 for a mean difference analysis, representing no difference between groups. The dotted vertical line represents the overall combined effect size estimate, reflecting the central value of the combined effect across all studies. Horizontal lines represent the confidence intervals (CI) of the estimated effect size for each study, showing the range within which the true effect size is expected to lie with 95% confidence. The length of the line indicates the precision of the estimate. The yellow diamond represents the combined mean difference estimates for each subgroup within the meta-analysis, showing the effect size and its corresponding 95% CI. The blue diamond represents the overall combined effect size across all studies, integrating the results of all subgroups, with its corresponding 95% CI.
Figure 3
Figure 3
Random-effects model and subgroup forest plot of metabolic biomarkers induced by HFD. NA = Not applicable. Wang et al., and Wang et al. A = reference [113]. Rajagopalan et al., Rajagopalan et al. B, and Rajagopalan et al. C = reference [120]. Costa-Beber et al. AA, Costa-Beber et al. AB, Costa-Beber et al. B, and Costa-Beber et al. AC = [123]. Du et al. A, Du et al. B, Du et al. C, Du et al. D, and Du et al. E = reference [126]. Chen et al., Chen et al. A, Chen et al. B, Chen et al. C, and Chen et al. D = reference [132]. Costa-Beber et al. BB, Costa-Beber et al. BC, Costa-Beber et al. BD, and Costa-Beber et al. BE = reference [133]. Ding et al., and Ding et al. AB = reference [134]. Schneider et al. A = reference [138]. Kostrycki et al. B, Kostrycki et al. C, and Kostrycki et al. D = reference [112]. Costa-Beber et al., Costa-Beber et al. A, and Costa-Beber et al. BA = reference [116]. Song et al., and Song et al. B = reference [121]. He et al. = reference [129]. Bosch et al., and Bosch et al. A = reference [131]. Li et al., Li et al. A, Li et al. C, Li et al. G, Li et al. H, and Li et al. I = reference [137]. Zhong et al., and Zhong et al. A = reference [141]. Li et al. B, Li et al. D, Li et al. E, and Li et al. F = reference [142]. Duan et al., Duan et al. A, and Duan et al. B = reference [127]. Black squares represent the estimated effect size (mean difference) of each individual study, with the size of the square being proportional to the weight of the study in the combined estimate. Black vertical lines indicate the null or no-effect value, which corresponds to 0 for a mean difference analysis, representing no difference between groups. The dotted vertical line represents the overall combined effect size estimate, reflecting the central value of the combined effect across all studies. Horizontal lines represent the confidence intervals (CI) of the estimated effect size for each study, showing the range within which the true effect size is expected to lie with 95% confidence. The length of the line indicates the precision of the estimate. The yellow diamond represents the combined mean difference estimates for each subgroup within the meta-analysis, showing the effect size and its corresponding 95% CI. The blue diamond represents the overall combined effect size across all studies, integrating the results of all subgroups, with its corresponding 95% CI.
Figure 4
Figure 4
Random-effects model and subgroup forest plot of metabolic biomarkers induced by PM2.5. NA = Not applicable. Wang et al., and Wang et al. A = reference [113]. Rajagopalan et al., Rajagopalan et al. B, and Rajagopalan et al. C = reference [120]. Du et al. A, Du et al. B, Du et al. C, Du et al. D, and Du et al. E = reference [126]. Chen et al., Chen et al. A, Chen et al. B, Chen et al. C, and Chen et al. D = reference [132]. Costa-Beber et al. C, Costa-Beber et al. BB, Costa-Beber et al. BC, Costa-Beber et al. BD, and Costa-Beber et al. BE = reference [133]. Ding et al. A, and Ding et al. AB = reference [134]. Schneider et al. A = reference [138]. Zhao et al., Zhao et al. A, Zhao et al. B, Zhao et al. C, Zhao et al. D, and Zhao et al. E = reference [140]. Kostrycki et al. B, and Kostrycki et al. D = reference [112]. Ding et al. = reference [111]. Costa-Beber et al., and Costa-Beber et al. A = reference [116]. Costa-Beber et al. B = reference [123]. Campolim et al., and Campolim et al. A = reference [115]. Song et al., and Song et al. B = reference [121]. He et al. = reference [129]. Bosch et al., and Bosch et al. A = reference [131]. Li et al., Li et al. A, Li et al. B, Li et al. C, Li et al. D, Li et al. E, Li et al. F, Li et al. G, Li et al. H, and Li et al. I = reference [137]. Zhong et al., and Zhong et al. A = reference [141]. Duan et al., Duan et al. A, and Duan et al. B = reference [127]. Black squares represent the estimated effect size (mean difference) of each individual study, with the size of the square being proportional to the weight of the study in the combined estimate. Black vertical lines indicate the null or no-effect value, which corresponds to 0 for a mean difference analysis, representing no difference between groups. The dotted vertical line represents the overall combined effect size estimate, reflecting the central value of the combined effect across all studies. Horizontal lines represent the confidence intervals (CI) of the estimated effect size for each study, showing the range within which the true effect size is expected to lie with 95% confidence. The length of the line indicates the precision of the estimate. The yellow diamond represents the combined mean difference estimates for each subgroup within the meta-analysis, showing the effect size and its corresponding 95% CI. The blue diamond represents the overall combined effect size across all studies, integrating the results of all subgroups with its corresponding 95% CI.
Figure 5
Figure 5
Random-effects model and subgroup forest plot of metabolic biomarkers induced by HFD and PM2.5. Wang et al., and Wang et al. A = reference [113]. Costa-Beber et al., Costa-Beber et al. A, Costa-Beber et al. AA, Costa-Beber et al. AB, Costa-Beber et al. AC, and Costa-Beber et al. BA = reference [116]. Du et al. A, Du et al. B, Du et al. C, Du et al. D, and Du et al. E = reference [126]. Guo et al., Guo et al. B, and Guo et al. C = reference [128]. Chen et al., Chen et al. A, Chen et al. B, Chen et al. C, and Chen et al. D = reference [132]. Costa-Beber et al. BB, Costa-Beber et al. BC, Costa-Beber et al. BD, Costa-Beber et al. BE, and Costa-Beber et al. C = reference [133]. Ding et al., Ding et al. A, and Ding et al. AB = reference [134]. Schneider et al. A = reference [138]. Zhao et al., Zhao et al. A, Zhao et al. B, Zhao et al. C, Zhao et al. D, and Zhao et al. E = reference [140]. Kostrycki et al. B, Kostrycki et al. C, and Kostrycki et al. D = reference [112]. Costa-Beber et al. B = reference [123]. Santos et al., and dos Santos et al. A = reference [135]. Campolim et al., Campolim et al. A = reference [115]. Song et al. = reference [121]. He et al. = reference [129]. Bosch et al., and Bosch et al. A = reference [131]. Li et al., Li et al. A, Li et al. B, Li et al. C, Li et al. D, Li et al. E, Li et al. F, Li et al. G, Li et al. H, and Li et al. I = reference [137]. Zhong et al., and Zhong et al. A = reference [141]. Black squares represent the estimated effect size (mean difference) of each individual study, with the size of the square being proportional to the weight of the study in the combined estimate. Black vertical lines indicate the null or no-effect value, which corresponds to 0 for a mean difference analysis, representing no difference between groups. The dotted vertical line represents the overall combined effect size estimate, reflecting the central value of the combined effect across all studies. Horizontal lines represent the confidence intervals (CI) of the estimated effect size for each study, showing the range within which the true effect size is expected to lie with 95% confidence. The length of the line indicates the precision of the estimate. The yellow diamond represents the combined mean difference estimates for each subgroup within the meta-analysis, showing the effect size and its corresponding 95% CI. The blue diamond represents the overall combined effect size across all studies, integrating the results of all subgroups with its corresponding 95% CI.
Figure 6
Figure 6
Gene set enrichment analysis (GSEA) and over-representation analysis (ORA) of biological pathways induced by HFD, PM2.5, and HFD + PM2.5 exposure in different tissues. (A) ORA analysis in BAT. (B) GSEA analysis in WAT. (C) GSEA analysis in cardiac tissue. (D) ORA analysis in hepatic tissue. Graphics were created in SRPlot (1 August 2024, https://www.bioinformatics.com.cn/en), and figures were designed using the BioRender program (15 August 2024, https://app.biorender.com/).
Figure 7
Figure 7
KEGG network diagram of the adipocytokine signaling pathway. White boxes: biological pathway maps. Green boxes: genes or gene products. Circles: molecules. Solid line arrows: direct relationships or molecular interactions. Dashed line arrows: indirect relationships or unknown reactions. Green boxes + arrows + circles + arrows = gene expression relationship. Red indicates differentially expressed transcripts after HFD exposure in brown adipose tissue (BAT).
Figure 8
Figure 8
WikiPathways diagram of adipogenesis genes. The differentially expressed transcripts after PM2.5 exposure in brown adipose tissue (BAT) are in blue.
Figure 9
Figure 9
Reactome diagram of protein metabolism. In violet and blue, biological and transcript processes are differentially expressed after individual exposure to HFD and PM2.5 in white adipose tissue (WAT).
Figure 10
Figure 10
Reactome diagram of the cellular responses to stress, cellular responses to stimuli, and cellular response to chemical stress metabolism of protein pathways. In violet, differentially expressed biological and transcript processes after exposure to HFD and HFD + PM2.5 in cardiac tissue.
Figure 11
Figure 11
WikiPathway outline of burn-wound healing. Blue shading highlights differentially expressed transcripts in cardiac tissue following PM2.5 exposure. The intensity of the blue color indicates the extent of gene dysregulation, with darker shades representing higher levels of dysregulation within the pathway.
Figure 12
Figure 12
KEGG network diagram of the PPAR signaling pathway. White squares: maps of biological pathways. Green boxes: genes or gene products. Circles: molecules. Solid line arrows: direct relationship or molecular interaction. Dashed line arrows: indirect relationship or unknown reaction. Green squares + arrows + circles + arrows = gene expression ratio. In red, the transcripts that show a differential expression in liver tissue after individual and combined exposure to HFD and PM2.5 stand out, except Acsl4, which did not present statistically significant results after exposure to HFD.
Figure 13
Figure 13
Diagram of red KEGG of AMPK signaling pathway. White squares: maps of biological pathways. Green boxes: genes or gene products. Circles: molecules. Solid line arrows: direct relationship or molecular interaction. Dashed line arrows: indirect relationship or unknown reaction. Green squares + arrows + circles + arrows = gene expression ratio. Highlighted in red are transcripts that show differential expression in liver tissue after individual and combined exposure to HFD and PM2.5. FAS is the protein encoded by Fasn.
Figure 14
Figure 14
Diagram of red KEGG of Non-alcoholic fatty liver disease. White squares: maps of biological pathways. Green boxes: genes or gene products. Circles: molecules. Solid line arrows: direct relationship or molecular interaction. Dashed line arrows: indirect relationship or unknown reaction. Green squares + arrows + circles + arrows = gene expression ratio. Highlighted in red are transcripts that show differential expression in liver tissue after individual and combined exposure to HFD and PM2.5.

Similar articles

References

    1. Löffler M.C., Betz M.J., Blondin D.P., Augustin R., Sharma A.K., Tseng Y.-H., Scheele C., Zimdahl H., Mark M., Hennige A.M., et al. Challenges in tackling energy expenditure as obesity therapy: From preclinical models to clinical application. Mol. Metab. 2021;51:101237. doi: 10.1016/j.molmet.2021.101237. - DOI - PMC - PubMed
    1. Kranjac A.W., Kranjac D. Explaining adult obesity, severe obesity, and BMI: Five decades of change. Heliyon. 2023;9:e16210. doi: 10.1016/j.heliyon.2023.e16210. - DOI - PMC - PubMed
    1. Lin X., Li H. Obesity: Epidemiology, Pathophysiology, and Therapeutics. Front. Endocrinol. 2021;12:706978. doi: 10.3389/fendo.2021.706978. - DOI - PMC - PubMed
    1. Mayoral L.P.-C., Andrade G.M., Mayoral E.P.-C., Huerta T.H., Canseco S.P., Rodal Canales F.J., Cabrera-Fuentes H.A., Cruz M.M., Pérez Santiago A.D., Alpuche J.J., et al. Obesity subtypes, related biomarkers & heterogeneity. Indian J. Med. Res. 2020;151:11–21. doi: 10.4103/ijmr.IJMR_1768_17. - DOI - PMC - PubMed
    1. Jeong S.-M., Lee D.H., Rezende L.F.M., Giovannucci E.L. Different correlation of body mass index with body fatness and obesity-related biomarker according to age, sex and race-ethnicity. Sci. Rep. 2023;13:3472. doi: 10.1038/s41598-023-30527-w. - DOI - PMC - PubMed

Substances

LinkOut - more resources