. 2024 Dec 17;14(12):1612.
doi: 10.3390/biom14121612.

UPLC-MS/MS High-Risk Screening for Sphingolipidoses Using Dried Urine Spots

Affiliations

UPLC-MS/MS High-Risk Screening for Sphingolipidoses Using Dried Urine Spots

Tristan Martineau et al. Biomolecules. .

Abstract

Background: Early detection of sphingolipidoses is crucial to prevent irreversible complications and improve patient outcomes. The use of urine samples dried on filter paper (DUS) is a non-invasive strategy that simplifies the collection, storage, and shipping of samples compared to using liquid urine specimens.

Objectives: (1) Develop and validate a multiplex ultra-performance liquid chromatography-tandem mass spectrometry (UPLC-MS/MS) methodology using DUS to quantify twenty-one lysosphingolipids normalized to creatinine for eight different sphingolipidoses. (2) Establish normal reference values to evaluate the clinical utility of the methodology.

Methods: Samples were eluted from a 5 cm filter paper disk (~1 mL of urine) and extracted on Oasis MCX solid-phase extraction cartridges prior to injection in the UPLC-MS/MS system.

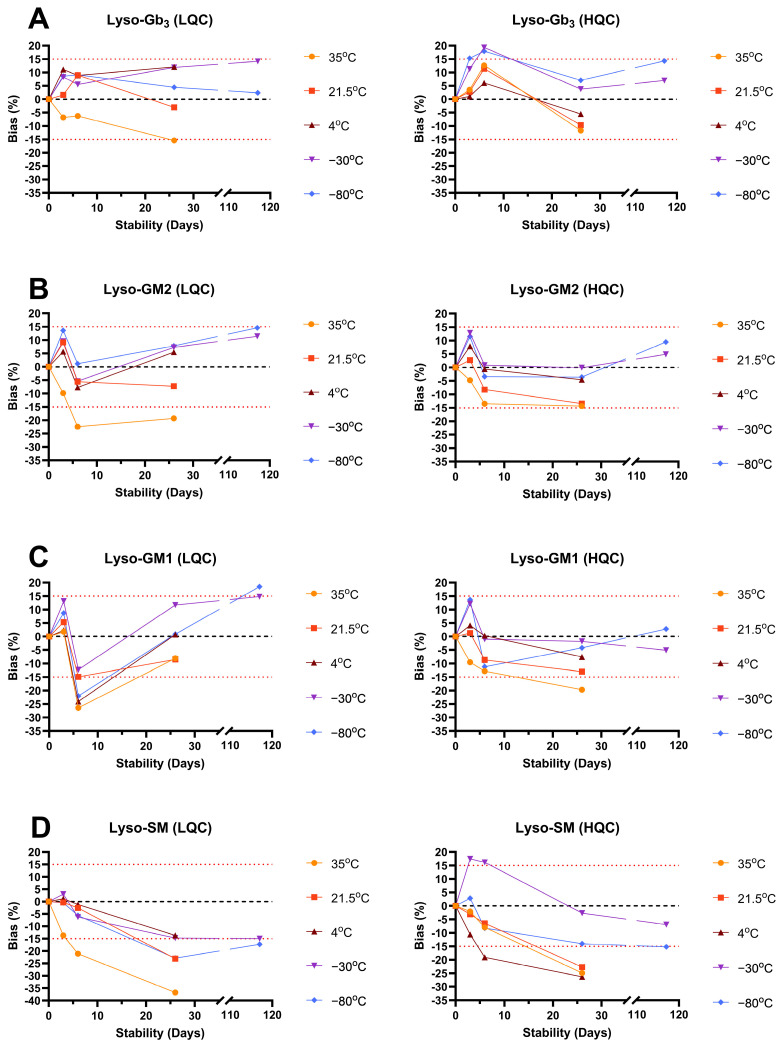
Results: Urinary lysosphingolipids were stable on DUS at -80 °C and -30 °C for 117 days, at 21.5 °C and 4 °C for at least 26 days, and at 35 °C for 3 days. Globotriaosylsphingosine, glucosylsphingosine, and their analogs were elevated in patients with Fabry disease and Gaucher disease, respectively, compared to controls (p-value < 0.0001). The analysis of related analog profiles suggests a better overall reliability in detecting patients early, especially for Fabry patients.

Conclusions: This approach is feasible and might be useful for the early detection, monitoring, and follow-up of patients with sphingolipidoses.

Keywords: Fabry disease; Gaucher disease; lysosomal storage disorders; lysosphingolipids; sphingolipidoses; tandem mass spectrometry; urine dried on filter paper.


Conflict of interest statement

T.M. received a doctoral educational bursary from Sanofi Canada. B.M. declares no conflicts of interest. C. Auray-Blais has received grants, and speaker honoraria from Takeda Pharmaceutical International AG., Sanofi Genzyme, BioMarin Pharmaceuticals Inc., Protalix Biotherapeutics, Amicus Therapeutics, and Avrobio, and traveling expenses from Waters Corp. for lectures given. She has received service agreements from Moderna Therapeutics, Sigilon Therapeutics, and 4D Molecular Therapeutics. The funders had no role in the design of the study; in the collection, analyses, or interpretation of data; in the writing of the manuscript; or in the decision to publish the results.

Figures

Figure 1
Figure 1
Chromatograms of lyso-Sulf using: (A) negative electrospray ionization (ESI−); and (B) positive electrospray ionization (ESI+) at 1 nmol/L. Red lines show chromatogram sections to calculate the signal-to-noise ratio (S/N) and the root mean square (RMS) of lyso-Sulf with the MassLynx software. Cps: counts per second.
Figure 2
Figure 2
Chromatograms of the principal biomarkers analyzed by UPLC-MS/MS. (A) Extracted ion currents from SRM transitions of creatinine, lyso-Sulf, GluSph, GalSph and their internal standards; and (B) extracted ion currents from SRM transitions of lyso-Gb3, lyso-GM2, lyso-GM1, lyso-SM and their internal standards. Cps: counts per second; %: relative abundance; ESI+: positive electrospray ionization; m/z: mass-to-charge ratio; ISTD: internal standard.
Figure 3
Figure 3
Chromatograms of separated (A) Lyso-Gb3 and its analogs (−28, −12, −2, +14, +16, +34, and +50) using UPLC-MS/MS for Fabry disease; and (B) GluSph and its analogs (−28, −26, −12, +2, +14, +16, +30, and +32) by UPLC-MS/MS for Gaucher disease. Cps: counts per second; %: relative abundance; ESI+: positive electrospray ionization; m/z: mass-to-charge ratio.
Figure 4
Figure 4
Long-term stability follow-up for (A) creatinine; (B) lyso-Sulf; (C) GluSph; and (D) GalSph at several temperatures and concentration levels. LQC: low-concentration quality control; HQC: high-concentration quality control; upper red dot line: maximum limit of 15% of bias compared to the nominal concentration; lower red dot line: lower limit of −15% of the bias compared to the nominal concentration.
Figure 5
Figure 5
Long-term stability follow-up for (A) lyso-Gb3, (B) lyso-GM2, (C) lyso-GM1 and (D) lyso-SM at several temperatures and concentration levels. LQC: low-concentration quality control; HQC: high-concentration quality control; upper red dot line: maximum limit of 15% of bias compared to the nominal concentration; lower red dot line: lower limit of −15% of bias compared to the nominal concentration.
Figure 6
Figure 6
Box plots of the urinary levels of GluSph and the eight related analogs normalized to creatinine (pmol/mmol creatinine) in the healthy control group (CTRL, n = 59), pathological control group (LSD, n = 21), other sphingolipidoses group (Sph, n = 105), treated Gaucher patient group (TG, n = 5) and untreated Gaucher patient group (UG, n = 8) from urinary samples dried on filter paper; box plots represent the normalized urinary levels of (A) GluSph levels only; (B) GluSph related analog levels only; and (C) total levels of GluSph and its related analogs. The lower and upper limits shown by the box plots are the 25th and 75th percentiles, respectively. The center horizontal box line is the median. The symbol “+” is the mean. The whiskers correspond to the highest and lowest values at the 95th and 5th percentile, respectively. Values outside the 95th percentile are considered as outliers. Comparison of the CTRL group with other groups with the Kruskal–Wallis post hoc Dunn’s test: ns: non-significant, *: p-value ≤ 0.05; ***: p-value ≤ 0.001; ****: p-value ≤ 0.0001.
Figure 7
Figure 7
Mean distribution of GluSph and its eight related analogs (−28, −26, −12, +2, +14, +16, +30, +32) in the untreated Gaucher disease group (n = 5).
Figure 8
Figure 8
Box plots of the urinary levels of lyso-Gb3 and its eight related analogs normalized to creatinine (pmol/mmol creatinine) in the healthy control group (CTRL, n = 59), pathological control group (LSD, n = 21), other sphingolipidose groups (Sph, n = 20), treated Fabry female patient group (TFF, n = 22 with classical mutations (CM) and n = 2 with late-onset mutations (LO)), untreated Fabry female group (UFF, CM: n = 27, LO: n = 6), treated Fabry male group (TFM: CM: n = 20, LO: n = 2), and untreated Fabry male group (UFM: CM: n = 11, LO: n = 8) from urinary samples dried on filter paper; box plots represent normalized urinary levels of (A1,A2) lyso-Gb3 levels only in controls and patients with (1) CM and (2) LO; (B1,B2) lyso-Gb3 related analog levels only in controls compared to patients with (1) CM and (2) LO; and (C1,C2) total levels of lyso-Gb3 and its related analogs in controls compared to patients with (1) CM and (2) LO. The lower and upper limits shown by the box plots are the 25th and 75th percentiles, respectively. The center horizontal box line is the median. The symbol “+” is the mean. The whiskers correspond to the highest and lowest values at 95th and 5th percentile, respectively. Values outside the 95th percentile are considered as outliers. Comparison of the CTRL group with other groups with Kruskal–Wallis post hoc Dunn’s test: ns: non-significant, **: p-value ≤ 0.01; ***: p-value ≤ 0.001; ****: p-value ≤ 0.0001.
Figure 9
Figure 9
Box plots of the urinary levels of lyso-Gb3 and its eight related analogs (−28, −12, −2, +14, +16, +34, +50) normalized to creatinine (pmol/mmol creatinine) in the untreated Fabry female (UFF) and untreated Fabry male (UFM) groups according to the classical and nonclassical (late-onset phenotype) mutations. (A) Results regrouping all the UFF; (B) results regrouping only UFF with classical mutations; (C) results regrouping only UFF with nonclassical mutations; (D) results regrouping all the UFM; (E) results regrouping only UFM with classical mutations; and (F) results regrouping only UFM with nonclassical mutations. The lower and upper limits shown by the box plots are the 25th and 75th percentiles, respectively. The center horizontal box line is the median. The whiskers correspond to the highest and lowest values.

Similar articles

References

    1. Platt F.M., d’Azzo A., Davidson B.L., Neufeld E.F., Tifft C.J. Lysosomal storage diseases. Nat. Rev. Dis. Prim. 2018;4:27. doi: 10.1038/s41572-018-0025-4. - DOI - PubMed
    1. Lahiri S., Futerman A.H. The metabolism and function of sphingolipids and glycosphingolipids. Cell. Mol Life Sci. 2007;64:2270–2284. doi: 10.1007/s00018-007-7076-0. - DOI - PMC - PubMed
    1. Abed Rabbo M., Khodour Y., Kaguni L.S., Stiban J. Sphingolipid lysosomal storage diseases: From bench to bedside. Lipids Health Dis. 2021;20:44. doi: 10.1186/s12944-021-01466-0. - DOI - PMC - PubMed
    1. Abou-Ghali M., Stiban J. Regulation of ceramide channel formation and disassembly: Insights on the initiation of apoptosis. Saudi J. Biol. Sci. 2015;22:760–772. doi: 10.1016/j.sjbs.2015.03.005. - DOI - PMC - PubMed
    1. Auray-Blais C., Boutin M., Gagnon R., Dupont F.O., Lavoie P., Clarke J.T. Urinary globotriaosylsphingosine-related biomarkers for Fabry disease targeted by metabolomics. Anal. Chem. 2012;84:2745–2753. doi: 10.1021/ac203433e. - DOI - PubMed

LinkOut - more resources