. 2024 Nov 28;15(12):1535.
doi: 10.3390/genes15121535.

Genotypic Influences on Actuators of Aerobic Performance in Tactical Athletes

Affiliations

Genotypic Influences on Actuators of Aerobic Performance in Tactical Athletes

Martin Flück et al. Genes (Basel). .

Abstract

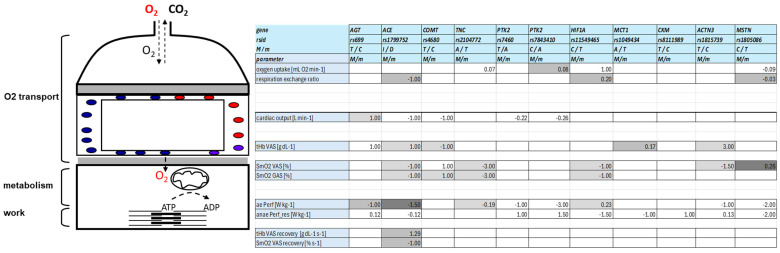
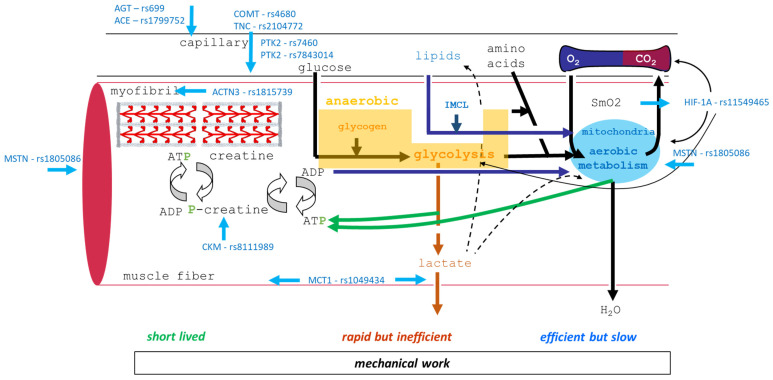
Background: This study examines genetic variations in the systemic oxygen transport cascade during exhaustive exercise in physically trained tactical athletes. Research goal: To update the information on the distribution of influence of eleven polymorphisms in ten genes, namely ACE (rs1799752), AGT (rs699), MCT1 (rs1049434), HIF1A (rs11549465), COMT (rs4680), CKM (rs8111989), TNC (rs2104772), PTK2 (rs7460 and rs7843014), ACTN3 (rs1815739), and MSTN (rs1805086)-on the connected steps of oxygen transport during aerobic muscle work.

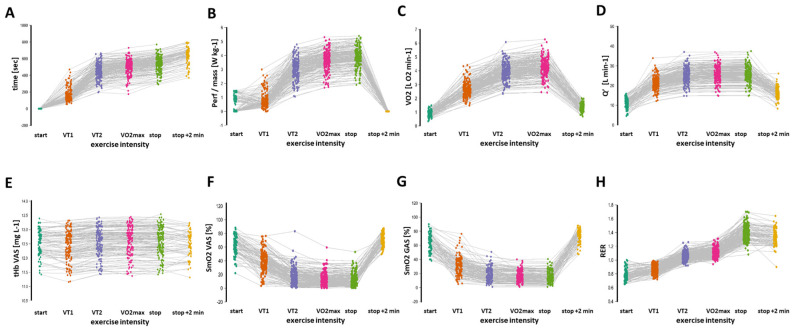
Methods: 251 young, healthy tactical athletes (including 12 females) with a systematic physical training history underwent exercise tests, including standardized endurance running with a 12.6 kg vest. Key endurance performance metrics were assessed using ergospirometry, blood sampling, and near-infrared spectroscopy of knee and ankle extensor muscles. The influence of gene polymorphisms on the above performance metrics was analyzed using Bayesian analysis of variance.

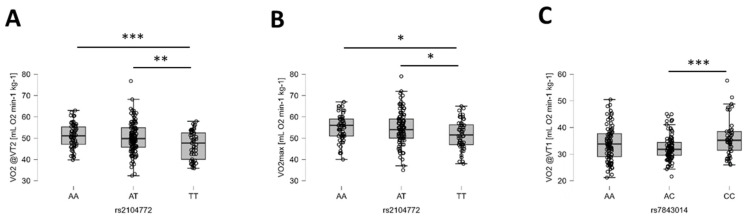
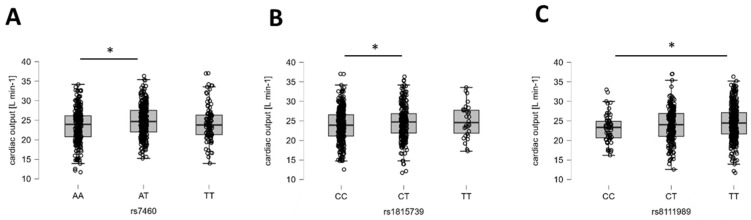
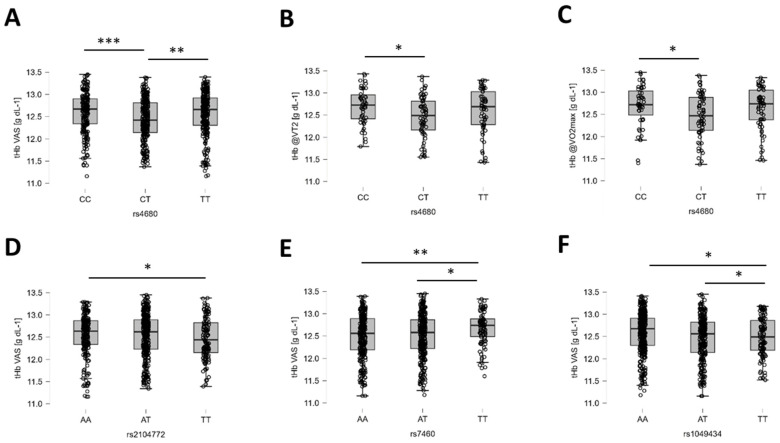
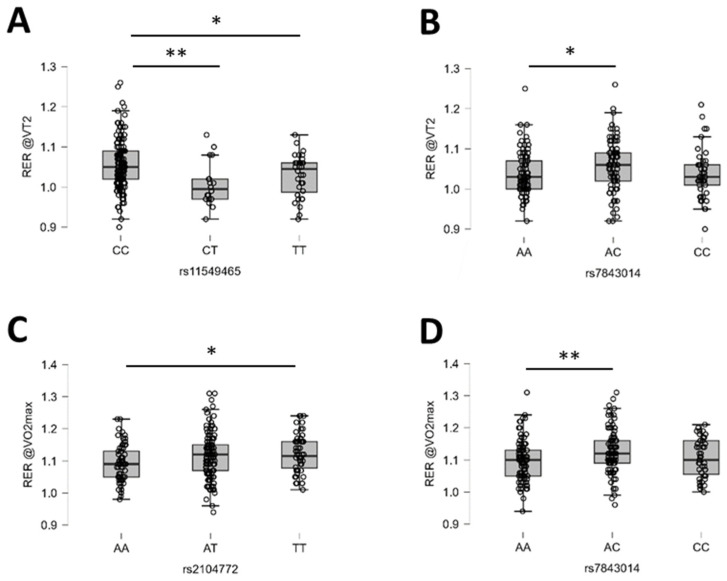
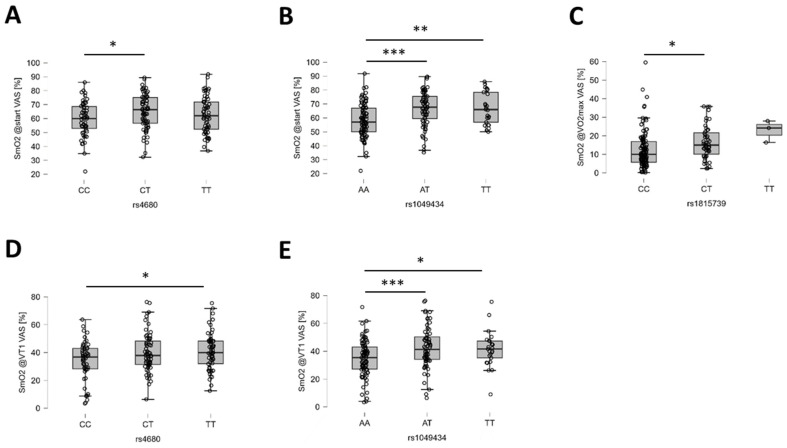
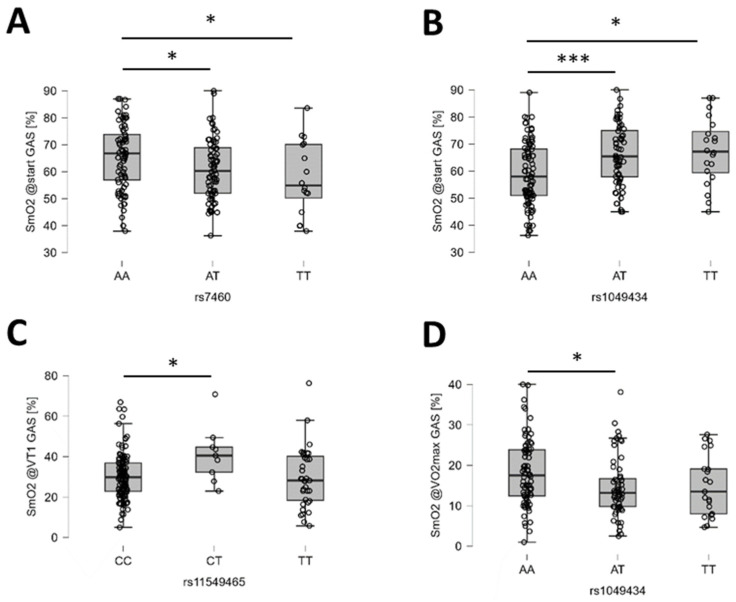
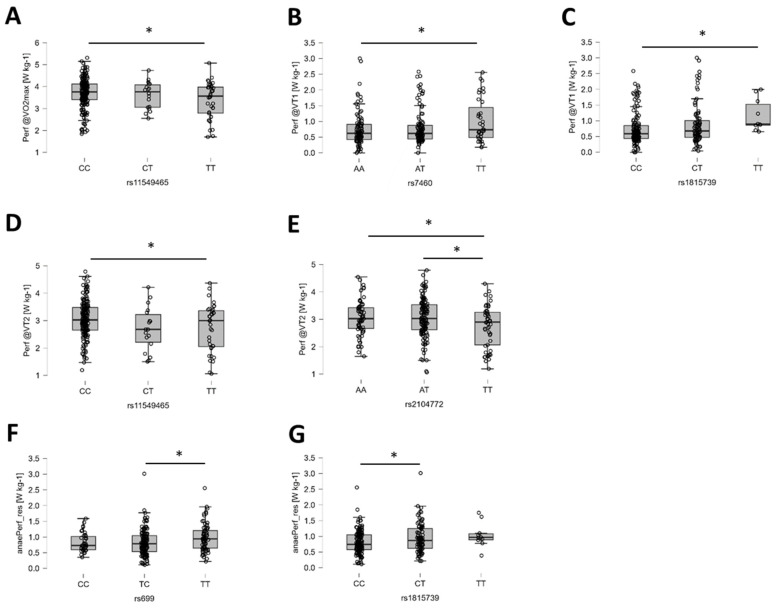
Results: Subjects exhibited good aerobic fitness (maximal oxygen uptake (VO2max): 4.3 ± 0.6 L min-1, peak aerobic power: 3.6 W ± 0.7 W kg-1). Energy supply-related gene polymorphisms rs1799752, rs4680, rs1049434, rs7843014, rs11549465, and rs8111989 did not follow the Hardy-Weinberg equilibrium. Polymorphisms in genes that regulate metabolic and contractile features were strongly associated with variability in oxygen transport and metabolism, such as body mass-related VO2 (rs7843014, rs2104772), cardiac output (rs7460), total muscle hemoglobin content (rs7460, rs4680), oxygen saturation in exercised muscle (rs1049434), and respiration exchange ratio (rs7843014, rs11549465) at first or secondary ventilatory thresholds or VO2max. Moderate influences were found for mass-related power output.

Conclusions: The posterior distribution of effects from genetic modulators of aerobic metabolism and muscle contractility mostly confirmed prior opinions in the direction of association. The observed genetic effects of rs4680 and rs1049434 indicate a crucial role of dopamine- and lactate-modulated muscle perfusion and oxygen metabolism during running, suggesting self-selection in Swiss tactical athletes.

Keywords: exercise; fatigue; gene; heart; muscle; resistance; strength; ventilation.


Conflict of interest statement

Author MF owns stocks in Company Physiogene. The funders had no role in the design of this study, in the collection, analysis, or interpretation of data, in the writing of the manuscript, or in the decision to publish the results.

Figures

Figure 1
Figure 1
Visualized hypotheses. Composite drawing of the research hypothesis of genetic influences on oxygen transport and aerobic performance. (Left) Assessed elements of the oxygen transport cascade during muscle work. (Right) Color-coded listing of the hypothesized effects of gene polymorphism on the assessed parameters of the oxygen transport cascade (prior knowledge). Numbers denote the mean-centered differences (step size) between major and minor alleles for the hypothesized effects of a respective gene polymorphism. Light gray cells indicate hypothesized influences of the intensity of exercise or prior exercise/warm-up. Darkly highlighted cells denote those where the prior available information was contradictory. Empty cells denote instances where no prior information was indicated to formulate a specific hypothesis. Abbreviations: ACE, angiotensin-converting enzyme; ACTN3, alpha actinin-3; ADP, adenosine diphosphate; aePerf, aerobic performance; AGT, angiotensinogen; ATP, adenosine triphosphate; anae Perf_res, anaerobic power reserve; CKM, muscle-type creatine kinase; CO2, carbon dioxide; COMT, catechol-O-methyltransferase; GAS, gastrocnemius (medialis) muscle; HIF1A, hypoxia-inducible factor 1 alpha; m, minor variant of a gene polymorphism; M, major variant of gene polymorphism; MCT1, monocarboxylate transporter 1; MSTN, myostatin; PTK2, protein tyrosine kinase 2 (or focal adhesion kinase); O2, oxygen; rsid, identifier of gene polymorphism; SmO2, muscle oxygen saturation; TNC, tenascin-C; tHb, total hemoglobin concentration; VAS, vastus lateralis muscle.
Figure 2
Figure 2
Physiological characteristics during loaded, graded exercise. Rain cloud line plots of individual values for assessed characteristics of oxygen transport (Y-axes) during the different phases (X-axes) of loaded and graded running exercise into exhaustion for the studied 251 subjects. Cases with missing data for a phase were excluded from the display. (AH) time (A), performance (B), VO2 (C), Q′ (D), tHb in VAS (E), SmO2 in VAS (F), SmO2 in GAS (G), and RER (H). Abbreviations: max, maximal values; stop + 2 min, 120 s into recovery after the cessation of running; VO2, oxygen uptake; VT1, ventilatory threshold 1; VT2, ventilatory threshold 2; Perf, power; Q′, cardiac output.
Figure 3
Figure 3
Examples of the identified genotype effects on body mass-related oxygen uptake. (AC) Box plots (line: median; cross: mean; box: data from first to third quartile; whiskers: ±1.5 × interquartile range) and individual values (circles) for the influence of rs2104772 on VO2 at VT2 (A) and VO2max (B), and rs7843014 at VT1 (C). Y-axes resume the identity of the respective response variable and applicable unit, while the X-axes indicate the respective genotypes of the addressed gene polymorphism. Respective Bayes factors (BF10) for post hoc effects are given as follows: *, 10.0 ≥ BF10 > 2.5; **, 30.0 ≥ BF10 > 10.0; ***, BF10 > 30.0. Abbreviations: VO2@VT1, VO2 at VT1; VO2@VT2, VO2 at VT2.
Figure 4
Figure 4
Examples of the identified genotype effects on cardiac output. (AC) Box plots (line: median; cross: mean; box: data from first to third quartile; whiskers: ±1.5 × interquartile range) with individual values (circles) for the influence of rs7460 (A), rs1815739 (B), and rs8111989 (C) on overall cardiac output. Y- and X-axes resume the identity of the respective response variable, the applicable unit, and the respective genotype. Respective Bayes factors (BF10) for post hoc effects are given as follows: *, 10.0 ≥ BF10 > 2.5.
Figure 5
Figure 5
Examples of the identified genotype effects on total hemoglobin concentration of vastus lateralis muscle. (AF) Box plots (line: median; cross: mean; box: data from first to third quartile; whiskers: ±1.5 × interquartile range) with individual values (circles) for the influence of rs4680 on overall tHb in VAS (A), tHb in VAS at VT2 (B), and tHb in VAS at VO2max (C), as well as rs2104772 (D), rs7460 (E), and rs1049413 (F) on overall tHb in VAS. Y- and X-axes resume the identity of the respective response variable, the applicable unit, and the respective genotype. Respective Bayes factors (BF10) for post hoc effects are given as follows: *, 10.0 ≥ BF10 > 2.5: **, 30.0 ≥ BF10 > 10.0; ***, BF10 > 30.0. Abbreviations: tHb@VT2, tHb at VT2; tHb@VO2max, tHb at VO2max.
Figure 6
Figure 6
Examples of the identified genotype effects on respiration exchange ratio. (AD) Box plots (line: median; cross: mean; box: data from first to third quartile; whiskers: ±1.5 × interquartile range) with individual values (circles) for the influence of rs11549465 (A) and rs7843014 (B) on RER at VT2, and rs2104772 (C) and rs7843014 (D) on RER at VO2max. Y- and X-axes resume the identity of the response variable, the applicable unit, and the respective genotype. Respective Bayes factors (BF10) for post hoc effects are given as follows: *, 10.0 ≥ BF10 > 2.5; **, 30.0 ≥ BF10 > 10.0. Abbreviations: RER@VO2max; RER at VO2max; RER@VT2; RER at VT2.
Figure 7
Figure 7
Examples of the identified genotype effects on oxygen saturation in vastus lateralis muscle. (AE) Box plots (line: median; cross: mean; box: data from first to third quartile; whiskers: ±1.5 × interquartile range) with individual values (circles) for the influence of rs4680 (A) and rs1049434 (B) on SmO2 in VAS at the start of exercise, as well as rs1815739 on SmO2 in VAS at VO2max (C), and rs4680 (D) and rs1049434 (E) SmO2 in VAS at VT1. Y- and X-axes resume the identity of the response variable and the applicable unit, and the respective genotype. Respective Bayes factors (BF10) for post hoc effects are given as follows: *, 10.0 ≥ BF10 > 2.5; **, 30.0 ≥ BF10 > 10.0; ***, BF10 > 30.0. Abbreviations: SmO2@start, SmO2 at start VAS; SmO2@VO2max, SmO2 at VO2max; SmO2@VT1, SmO2 at VT1.
Figure 8
Figure 8
Examples of the identified genotype effects on oxygen saturation in gastrocnemius medialis muscle. (AD) Box plots (line: median; cross: mean; box: data from first to third quartile; whiskers: ±1.5 × interquartile range) with individual values (circles) for the influence of rs7460 (A) and rs1049434 (B) on SmO2 in GAS at the start of exercise, as well as rs11549465 on SmO2 in GAS at VT1 (C) and rs1049434 on SmO2 in GAS at VO2max (D). Respective Bayes factors (BF10) for post hoc effects are given as follows: *, 10.0 ≥ BF10 > 2.5; ***, BF10 > 30.0.
Figure 9
Figure 9
Examples of the identified genotype effects on power output. (AG) Box plots (line: median; cross: mean; box: data from first to third quartile; whiskers: ±1.5 × interquartile range) with individual values (circles) for the influence of rs11549465 on performance at VO2max (A), rs7460 (B), and rs1815739 (C) on performance at VT1, as well as rs11549465 (D) and rs2104772 (E) on performance at VT2, as well as rs699 (F) and rs1815739 (G) on the anaerobic power reserve. Y- and X-axes resume the identity of the response variable, the applicable unit, and the respective genotype. Respective Bayes factors (BF10) for post hoc effects are given as follows: *, 10.0 ≥ BF10 > 2.5. Abbreviations: Perf@VO2max, power at VO2max; Perf@VT1, power at VT1; Perf@VT2, power at VT2.
Figure 10
Figure 10
Sites of interaction of assessed gene polymorphism with metabolic and contractile processes involved in energy provision and force development by muscle fibers. Arrows point to demonstrated points of influence of anatomical/biochemical processes by the connected gene polymorphisms. Drawing of the cellular makeup of skeletal muscle in muscle fibers and capillaries and the embedded myofibrillar and mitochondrial organelles, as well as biochemical processes for fueling energetic requirements during physical work by means of the aerobic combustion of organic substrates. Arrows indicate sites of demonstrated influence of the eleven studied gene polymorphisms. We refer to the other illustrations and tables regarding the abbreviations.

Similar articles

References

    1. van der Zwaard S., Brocherie F., Jaspers R.T. Under the Hood: Skeletal Muscle Determinants of Endurance Performance. Front. Sports Act. Living. 2021;3:719434. doi: 10.3389/fspor.2021.719434. - DOI - PMC - PubMed
    1. Liu Y., Abdullah B.B., Abu Saad H.B. Effects of high-intensity interval training on strength, speed, and endurance performance among racket sports players: A systematic review. PLoS ONE. 2024;19:e0295362. doi: 10.1371/journal.pone.0295362. - DOI - PMC - PubMed
    1. Hornick A., Daniels C.J. Endurance Sports Medicine: A Clinical Guide. 2nd ed. Springer International Publishing; Berlin/Heidelberg, Germany: 2023. Cardiovascular Evaluation and Treatment in the Endurance Athlete; pp. 19–36.
    1. Konopka M.J., Zeegers M.P., Solberg P.A., Delhaije L., Meeusen R., Ruigrok G., Rietjens G., Sperlich B. Factors associated with high-level endurance performance: An expert consensus derived via the Delphi technique. PLoS ONE. 2022;17:e0279492. doi: 10.1371/journal.pone.0279492. - DOI - PMC - PubMed
    1. Hoppeler H., Vogt M., Weibel E.R., Flück M. Response of Skeletal Muscle Mitochondria to Hypoxia. Exp. Physiol. 2003;88:109–119. doi: 10.1113/eph8802513. - DOI - PubMed

LinkOut - more resources