

Haplotype-Based Approach Represents Locus Specificity in the Genomic Diversification Process in Humans (Homo sapiens)
- PMID: 39766821
- PMCID: PMC11675571
- DOI: 10.3390/genes15121554
Haplotype-Based Approach Represents Locus Specificity in the Genomic Diversification Process in Humans (Homo sapiens)
Abstract
Background/objectives: Recent progress in evolutionary genomics on human (Homo sapiens) populations has revealed complex demographic events and genomic changes. These include population expansion with complicated migration, substantial population structure, and ancient introgression from other hominins, as well as human characteristics selections. Nevertheless, the genomic regions in which such evolutionary events took place have remained unclear.
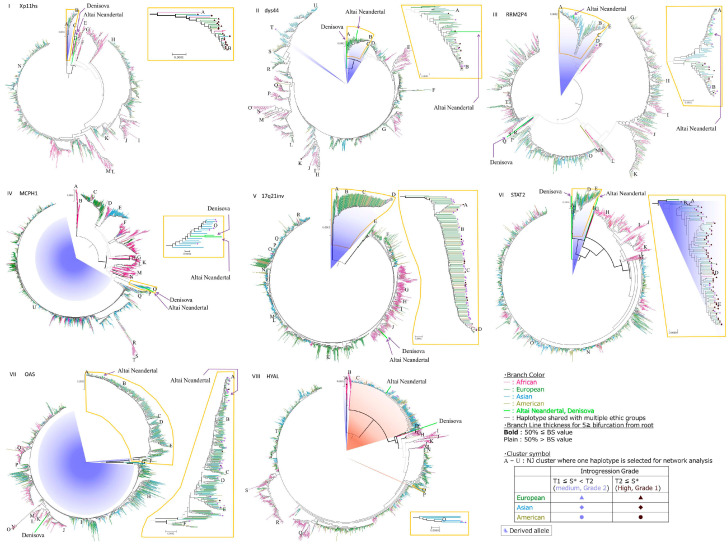
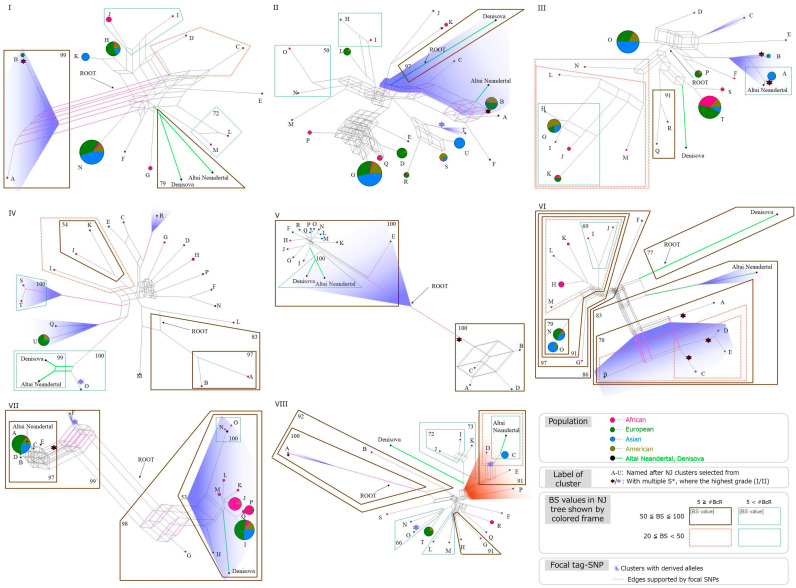
Methods: Here, we focused on eight loci containing the haplotypes that were previously presented as atypical for the mutation pattern in sequence and/or geographic distribution pattern with the model of recent African origin, which constitute two major clusters: African only, and global. This was the consensus model before information regarding introgression from Neanderthal (Homo neanderthalensis) was available. We compared diversity in identical datasets of the modern human population genome, with the 1000 Genomes project among them.
Results/conclusions: This study identified representative genomic regions that show traces of various demographic events and genomic changes that modern humans have undergone by categorizing the relationships in sequence similarity and in worldwide geographic distribution among haplotypes.
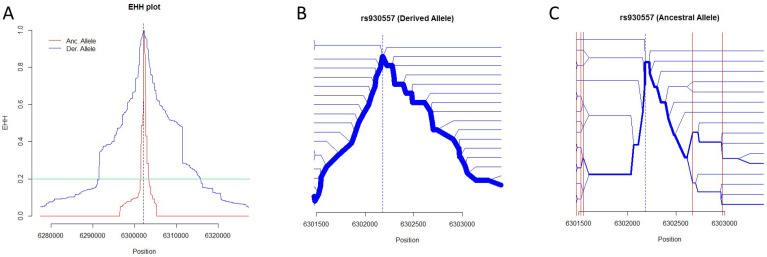
Keywords: S* analysis; ancient; extended haplotype homozygosity (EHH); incomplete lineage sorting (ILS); introgression.
Conflict of interest statement
The authors declare no conflict of interest. The founding bodies did not play any roles in the design of the study and collection, analysis, and interpretation of data, or in writing the manuscript. The authors do not have any conflict of interests between the organizations financially supported.
Figures
Similar articles
-
Analysis of Haplotypic Variation and Deletion Polymorphisms Point to Multiple Archaic Introgression Events, Including from Altai Neanderthal Lineage.Genetics. 2020 Jun;215(2):497-509. doi: 10.1534/genetics.120.303167. Epub 2020 Mar 31. Genetics. 2020. PMID: 32234956 Free PMC article.
-
Diverse African genomes reveal selection on ancient modern human introgressions in Neanderthals.Curr Biol. 2023 Nov 20;33(22):4905-4916.e5. doi: 10.1016/j.cub.2023.09.066. Epub 2023 Oct 13. Curr Biol. 2023. PMID: 37837965 Free PMC article.
-
Archaic human genomics.Am J Phys Anthropol. 2012;149 Suppl 55:24-39. doi: 10.1002/ajpa.22159. Epub 2012 Nov 2. Am J Phys Anthropol. 2012. PMID: 23124308 Review.
-
Local adaptation and archaic introgression shape global diversity at human structural variant loci.Elife. 2021 Sep 16;10:e67615. doi: 10.7554/eLife.67615. Elife. 2021. PMID: 34528508 Free PMC article.
-
Archaic hominin introgression into modern human genomes.Am J Phys Anthropol. 2020 May;171 Suppl 70:60-73. doi: 10.1002/ajpa.23951. Epub 2019 Nov 8. Am J Phys Anthropol. 2020. PMID: 31702050 Review.
References
Publication types
MeSH terms
Grants and funding
LinkOut - more resources
Full Text Sources
