. 2024 Nov 30;15(12):1562.
doi: 10.3390/genes15121562.

Integrative Transcriptomics and Proteomics Analysis Reveals THRSP's Role in Lipid Metabolism

Affiliations

Integrative Transcriptomics and Proteomics Analysis Reveals THRSP's Role in Lipid Metabolism

Yujie Li et al. Genes (Basel). .

Abstract

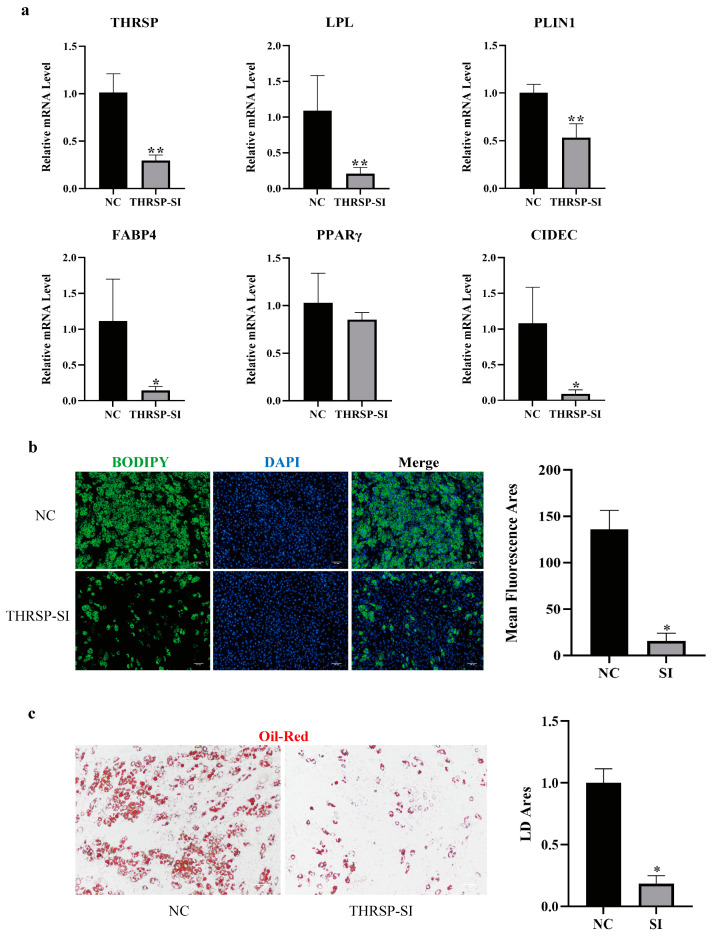
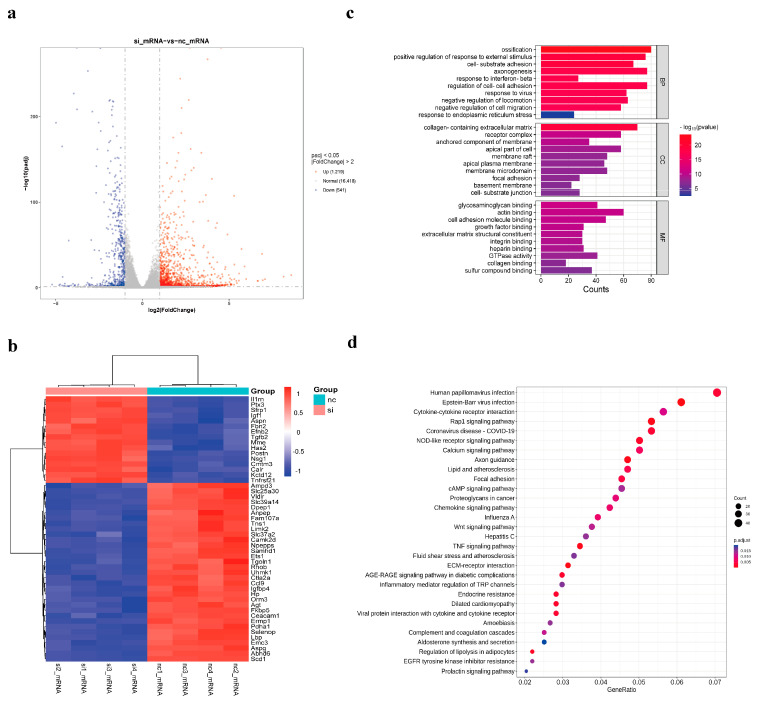
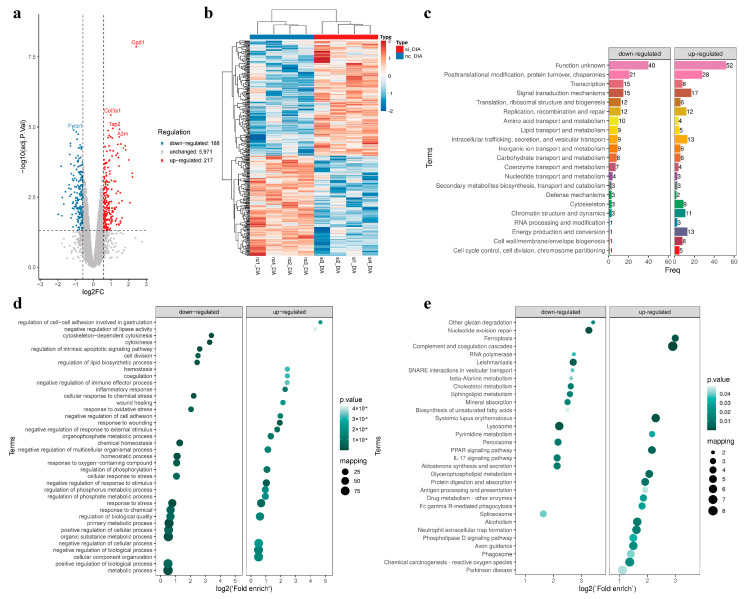
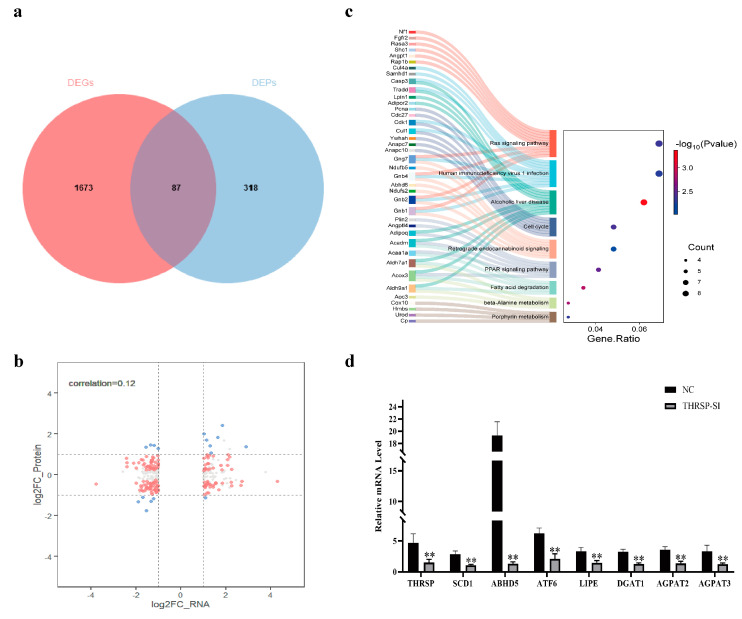
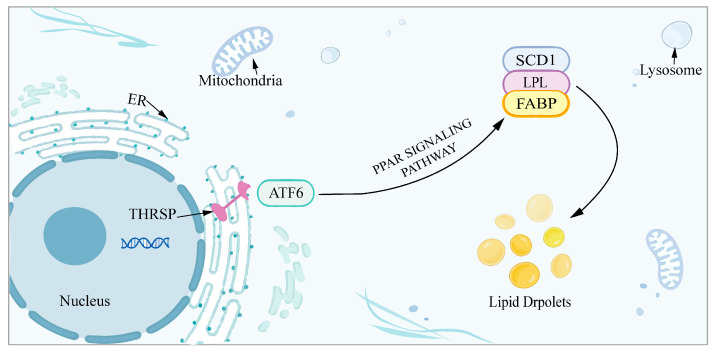
Background/Objectives: Abnormalities in lipid metabolism and endoplasmic reticulum (ER) stress are strongly associated with the development of a multitude of pathological conditions, including nonalcoholic fatty liver disease (NAFLD), diabetes mellitus, and obesity. Previous studies have indicated a potential connection between thyroid hormone responsive (THRSP) and lipid metabolism and that ER stress may participate in the synthesis of key regulators of adipogenesis. However, the specific mechanisms remain to be investigated. Methods: In this study, we explored the roles of THRSP in lipid metabolism by interfering with THRSP gene expression in mouse mesenchymal stem cells, comparing the effects on adipogenesis between control and interfered groups, and by combining transcriptomic and proteomic analysis. Results: Our results showed that the number of lipid droplets was significantly reduced after interfering with THRSP, and the expression levels of key regulators of adipogenesis, such as LPL, FABP4, PLIN1, and CIDEC, were significantly downregulated. Both transcriptomic and proteomic results showed that the differential genes (proteins) were enriched in the processes of lipolytic regulation, ER stress, cholesterol metabolism, sphingolipid metabolism, PPAR signaling pathway, and glycerophospholipid metabolism. The ER stress marker gene, ATF6, was the most significantly downregulated transcription factor. In addition, RT-qPCR validation indicated that the expression levels of PPAR signaling pathway gene SCD1; key genes of lipid droplet generation including LIPE, DGAT1, and AGPAT2; and ER stress marker gene ATF6 were significantly downregulated. Conclusions: These suggest that THRSP is involved in regulating ER stress and the PPAR signaling pathway, which is closely related to lipid synthesis and metabolism. Interfering with the expression of THRSP may be helpful in ameliorating the occurrence of diseases related to abnormalities in lipid metabolism.

Keywords: THRSP; endoplasmic reticulum stress; lipid metabolism; lipid synthesis.


Conflict of interest statement

The authors declare no conflicts of interest.

Figures

Figure 1
Figure 1
(a) Influence of the THRSP gene on the adipogenic process; (b,c) changes in lipid droplet production after interference with THRSP. The green and red colors indicate the presence of lipid droplets, while the blue color indicates the presence of nuclei. Bar graphs indicate the average fluorescence area and lipid droplet area, respectively. ** p < 0.01, * p < 0.05, NC: negative control group, SI: THRSP gene silencing group.
Figure 2
Figure 2
DEGs enrichment analysis by GO and KEGG. (a) Volcano plot of DEGs in si and nc groups. Each dot represents a gene. Blue dots are downregulated, red are upregulated, and grey are non-differentially expressed; (b) Heatmap of the clustering of the first 50 DEGs in the si and nc groups. Columns represent samples and rows represent genes. Colors represent the expression levels of the genes in the samples; the redder the color, the higher the expression, and the bluer the color, the lower the expression; (c) GO analysis of DEGs. The vertical axis is the GO term, the horizontal axis is the number of genes, and the color shows the significance level of the enrichment; (d) KEGG enrichment analysis of DEGs. The horizontal axis is the ratio of KEGG-annotated genes to total genes. The bubble size shows the number of genes in the KEGG pathway, and the color shows how significant the enrichment is.
Figure 3
Figure 3
The identification and functional enrichment analysis of DEPs in the si vs. nc groups is presented herewith. (a,b) DEPs volcano plot and heat map; (c) KOG functional classification statistics of DEPs; (d) GO enrichment analysis of DEPs; (e) KEGG pathway enrichment analysis of DEPs. The size of the bubbles represents the number of members mapped to the KEGG pathway, and the color of the bubbles represents the p value.
Figure 4
Figure 4
Correlation analysis of transcriptomics and proteomics. (a,b) Venn and nine-quadrant plots of DEGs versus DEPs. (The horizontal coordinate is the differential fold of the transcriptome and the vertical coordinate is the differential fold of the proteome. The horizontal/vertical coordinate dashed lines indicate the differential fold thresholds of the transcriptome/proteome. Each dot represents a gene/protein, with gray dots indicating non-differentiated proteins and genes, blue dots indicating genes and proteins that are both significantly different (up-regulated or down-regulated), and red dots indicating genes/proteins for which one histology is significantly different and one is not); (c) Sankey plot showing significant correlation of DEGs with DEPs enriched to the top ten KEGG pathways. The Sankey plot on the left side of the figure shows the genes and their enriched pathways. The bubble plot on the right side depicts the number of genes, with bubble size indicating the relative abundance of each gene. The color shade represents the p value; (d) Validate the expression of differentially expressed genes and key genes through RT-qPCR. ** p < 0.01.
Figure 5
Figure 5
The potential mechanism by which THRSP affects lipogenesis.

Similar articles

References

    1. Natesan V., Kim S.-J. Lipid Metabolism, Disorders and Therapeutic Drugs—Review. Biomol. Ther. 2021;29:596–604. doi: 10.4062/biomolther.2021.122. - DOI - PMC - PubMed
    1. Chen L., Chen X.-W., Huang X., Song B.-L., Wang Y., Wang Y. Regulation of Glucose and Lipid Metabolism in Health and Disease. Sci. China Life Sci. 2019;62:1420–1458. doi: 10.1007/s11427-019-1563-3. - DOI - PubMed
    1. Berná G., López-Bermudo L., Escudero-López B., Martín F. We Are What We Eat: The Role of Lipids in Metabolic Diseases. Adv. Food Nutr. Res. 2023;105:173–219. doi: 10.1016/bs.afnr.2022.11.004. - DOI - PubMed
    1. Poznyak A., Grechko A.V., Poggio P., Myasoedova V.A., Alfieri V., Orekhov A.N. The Diabetes Mellitus–Atherosclerosis Connection: The Role of Lipid and Glucose Metabolism and Chronic Inflammation. Int. J. Mol. Sci. 2020;21:1835. doi: 10.3390/ijms21051835. - DOI - PMC - PubMed
    1. Malekmohammad K., Bezsonov E.E., Rafieian-Kopaei M. Role of Lipid Accumulation and Inflammation in Atherosclerosis: Focus on Molecular and Cellular Mechanisms. Front. Cardiovasc. Med. 2021;8:707529. doi: 10.3389/fcvm.2021.707529. - DOI - PMC - PubMed

MeSH terms

Substances

LinkOut - more resources