. 2024 Dec 10;15(12):1587.
doi: 10.3390/genes15121587.

HROB Is Implicated in DNA Replication

Affiliations

HROB Is Implicated in DNA Replication

Julia Kutz et al. Genes (Basel). .

Abstract

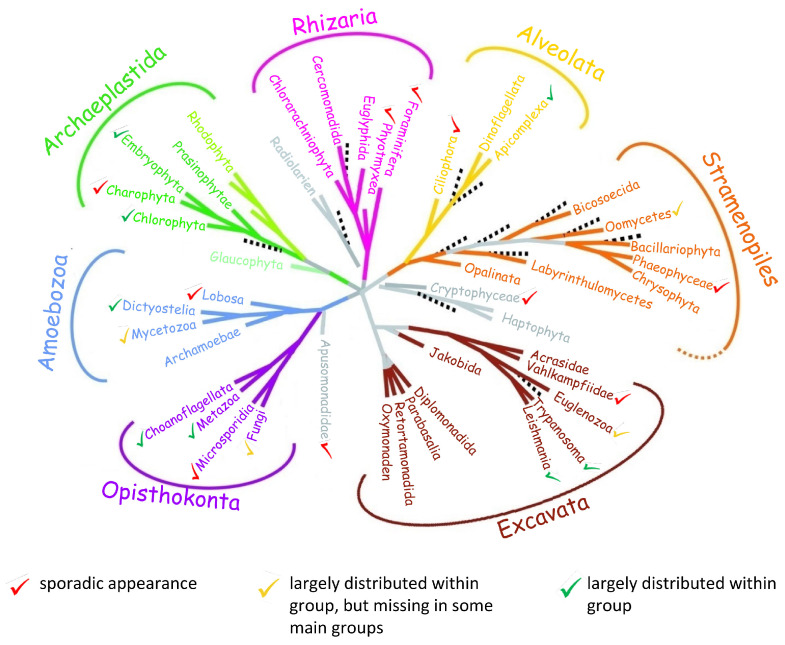
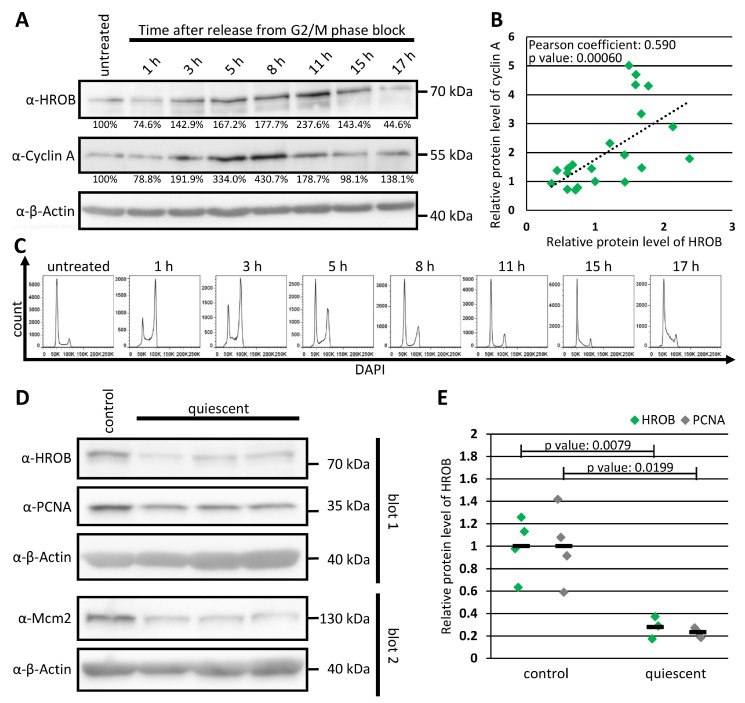
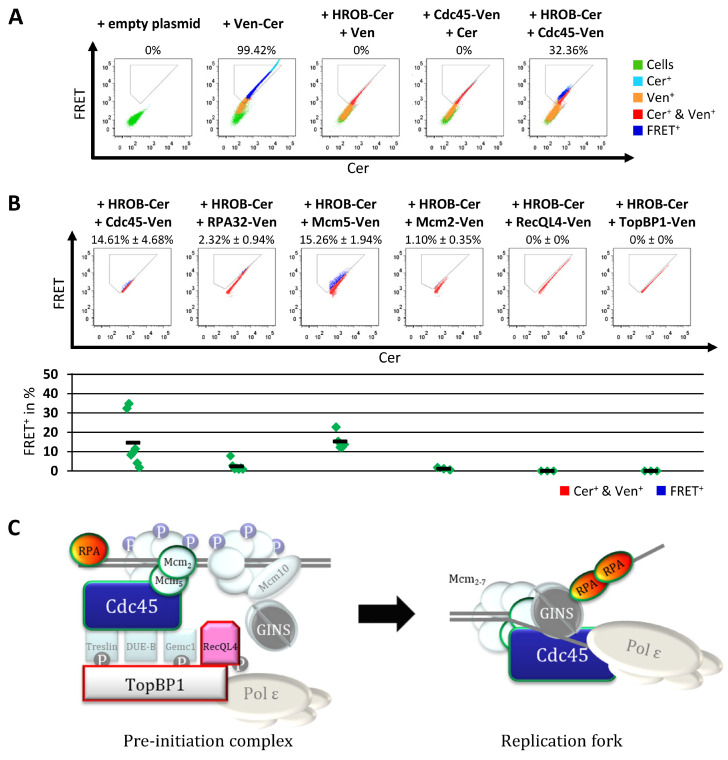
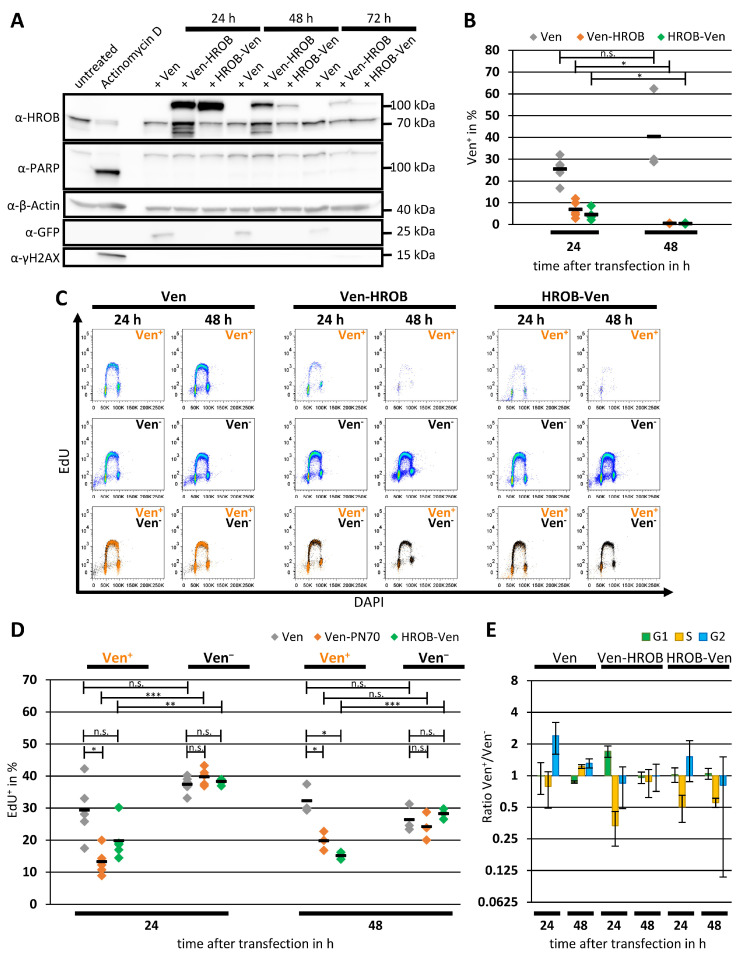
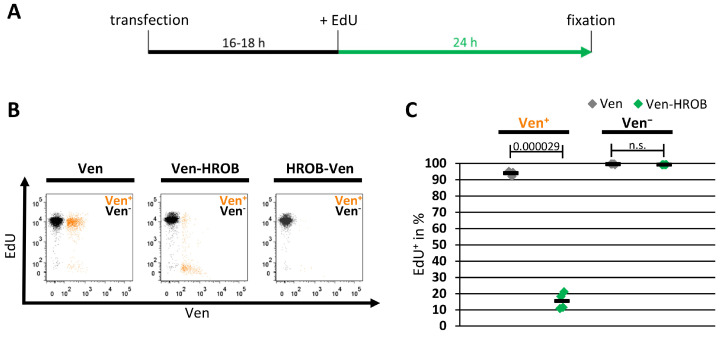
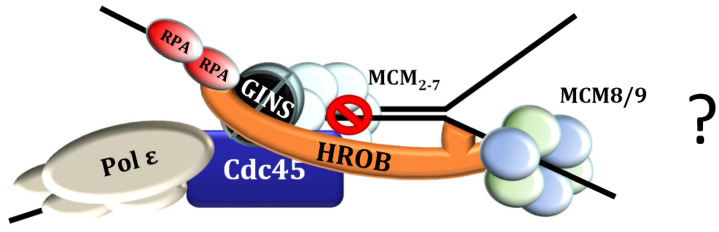
DNA replication represents a series of precisely regulated events performed by a complex protein machinery that guarantees accurate duplication of the genetic information. Since DNA replication is permanently faced by a variety of exogenous and endogenous stressors, DNA damage response, repair and replication must be closely coordinated to maintain genomic integrity. HROB has been identified recently as a binding partner and activator of the Mcm8/9 helicase involved in DNA interstrand crosslink (ICL) repair. We identified HROB independently as a nuclear protein whose expression is co-regulated with various DNA replication factors. Accordingly, the HROB protein level showed a maximum in S phase and a downregulation in quiescence. Structural prediction and homology searches revealed that HROB is a largely intrinsically disordered protein bearing a helix-rich region and a canonical oligonucleotide/oligosaccharide-binding-fold motif that originated early in eukaryotic evolution. Employing a flow cytometry Förster resonance energy transfer (FRET) assay, we detected associations between HROB and proteins of the DNA replication machinery. Moreover, ectopic expression of HROB protein led to an almost complete shutdown of DNA replication. The available data imply a function for HROB during DNA replication across barriers such as ICLs.

Keywords: DNA interstrand crosslink (ICL) repair; DNA replication; Förster resonance energy transfer (FRET); HROB; protein overexpression; soluble protein fragment identification.


Conflict of interest statement

The authors declare no conflicts of interest.

Figures

Figure 1
Figure 1
HROB is a largely disordered conserved nuclear protein bearing an OB-fold. (A) Western blot of total extracts and subcellular fractionated extracts of HEp-2 cells was performed using antibodies recognizing the indicated proteins. TopBP1 and GAPDH were used as a control for an exclusive nuclear and an exclusive cytosolic protein, respectively (abbreviation: α—anti, n = 2). (B) Fluorescence microscopy of transiently transfected HEp-2 cells expressing HROB fusion proteins with Venus (Ven, yellow; co-stained with DAPI, blue) or Cerulean (Cer, turquoise). Cell morphology was captured using differential interference contrast (DIC, grey). Scale bar: 5 µm (n = 2). (C) (top) The intrinsic disorder prediction was created using DISOPRED (version 3) [56]. The number of soluble fragments of different lengths identified using the random PCR screen in eight independent experiments are indicated in green. (bottom) Scheme of the human HROB structure prediction performed with PSIPRED (version 4.0) [57]. The OB-fold (oligonucleotide/oligosaccharide-binding fold motif, domain of unknown function 4539, N493-D576, green) was identified with HMMER (version 3.3) HMMSCAN using Pfam [58]. α-Helices (orange) and β-sheets (blue) outside of the OB-fold were shown from a minimum length of five amino acids. OB-fold-associated helix-rich regions (yellow) were defined as sections with a proportion of at least 40% helices (independent of the length). Disordered regions (gray) were defined as at least 80 amino acid long, undisrupted sections lacking any α-helix or β-sheet predictions. Acidic regions (black) were identified using SAPS [59] with manual post-selection of regions with at least seven and at least 30% of negatively charged amino acids and without any positively charged amino acid. (D) HROB homologs were harvested by PSI-BLAST searches in Ensembl (version 99) and NCBI protein databanks [60,61], as well as from Pfam (version 32.0) [62]. Structure prediction and scheme generation was performed as described for human HROB in (C). The numbers indicate the number of amino acids of the proteins. For taxonomic classification, NCBI Taxonomy (version 12/2019) [63] and Open Tree of Life (version 3.2) [64] were used. The protein-IDs of all shown homologs are listed in Supplementary Table S2 (illustration inspired by [65]).
Figure 2
Figure 2
HROB homologs were identified in all main groups of eukaryotes. Identification of HROB sequence homologs was performed as described in Figure 1 and Section 2. Taxonomic position of Microsporidia is based on [78]. Groups labeled with green check marks show a wide distribution of HROB. In groups labeled with yellow check marks, homologues are also widely distributed but could not be identified in some main groups. A sporadic occurrence of HROB homologs is marked with red check marks (illustration is inspired by [79]).
Figure 3
Figure 3
The cellular expression of HROB varies depending on cell cycle phase and proliferation state. (AC) HEp-2 cells were treated for 18 h with the CDK1 inhibitor RO-3306. Untreated HEp-2 cells served as control. From 1 to 17 h after removal of the inhibitor, the cells were split, and the same samples were analyzed by both Western blot and flow cytometry (abbreviation: α—anti, n = 3). (A) Western blot of full cell extracts was performed using antibodies recognizing the indicated proteins. The percentages indicate the signal intensities of the shown HROB and Cyclin A protein bands to the β-actin loading control. Intensities are presented relative to the untreated (asynchronous) condition. (B) The normalized signal intensities of HROB and Cyclin A Western blot bands of three experiments show a strong correlation. Each green dot represents one sample and time point. The indicated p value was estimated by a classical two-sided Student’s t-test. (C) Verification of the synchronization of cells by DAPI staining and flow cytometric analysis. (D,E) For generation of quiescent cells, BJ cells were cultured for at least four weeks without passaging in medium with reduced FBS supplement (0.5%). Proliferating BJ cells served as control (n = 3–4). (D) Western blot of full cell extracts of control and quiescent BJ cells was performed using antibodies recognizing the indicated proteins. PCNA and Mcm2 served as control for proteins downregulated in quiescent cells (abbreviation: α—anti). (E) The signal intensities of the HROB and PCNA Western blot bands were quantified and corrected to the loading control (β-actin). The data were then normalized to achieve an average of one in the respective control groups. Each data point represents an independent biological sample. The means are shown as black bars. The indicated p values were determined by classical two-sided Student’s t-tests.
Figure 4
Figure 4
HROB shows FRET associations with DNA replication factors. HEp-2 cells were transiently transfected with empty vector or with plasmids encoding the indicated Cerulean (Cer) or Venus (Ven) fluorescent fusion proteins and analyzed by flow cytometry 18–20 h after transfection. (A) Representation of the sample set for each FRET experiment. Cells transfected with empty vector (pcDNA3.1+) served as a non-fluorescent control. Cells expressing the FRET-capable Ven-Cer fusion protein were used as positive control and cells transfected with not-fused Cer or Ven encoding plasmids in combination with a HROB or Cdc45 fluorescent fusion protein were used as negative controls. The intensities in the FRET channel were plotted against the Cer intensities. The populations are shown overlapping in the order cells (green), Cer-positive cells (Cer+, turquoise), Ven-positive cells (Ven+, orange), Cer- and Ven-double-positive cells (Cer+ and Ven+, red) and FRET-positive cells (FRET+, blue). The percentages indicate the respective proportion of FRET+ in the samples shown. (B) Representative images of samples of cells co-expressing HROB-Cer and Ven fusions of the indicated replication factors. The intensities in the FRET channel were plotted against the Cer intensities. The populations are shown overlapping in the order Cer- and Ven-double-positive cells (Cer+ and Ven+, red) and FRET-positive cells (FRET+, blue). The percentages indicate the mean (± SEM, standard error of the mean) of the proportions of FRET+ from at least three independent samples (n = 3–7, Supplementary Tables S4 and S5). (C) Schematic overview of the pre-initiation and elongation complex of the human DNA replication. Replication factors for which FRET to HROB was examined are highlighted. If FRET was detected between the factors and HROB, the factors are marked with a green outline; if not, the outline is colored red (illustration is inspired by [84]).
Figure 5
Figure 5
HROB-overexpressing cells show a depletion of S phase. HEp-2 cells were transiently transfected with plasmids encoding Venus (Ven), Ven-HROB or HROB-Ven. (A) Western blot was performed using full extracts of these cells 24, 48 or 72 h after transfection. Untreated cells or cells treated for 18–23 h with 10 µM Actinomycin D served as control (abbreviation: α—anti, n = 3). (BE) A duration of 24 or 48 h after transfection, the cell cycle was analyzed via flow cytometry after EdU and DAPI staining. For each sample, Ven-positive (Ven+) and Ven-negative (Ven) cells were distinguished, and the proportion of EdU-positive (EdU+) cells was determined (n = 3–5). (B) The cells were analyzed cytometrically for the proportion of Ven+ cells. Each data point represents an independent biological sample. The means are represented by black bars. p values (n.s.—not significant, * p < 0.05) were determined using two-sided Student’s t-tests without corrections for multiple testing. (C) Representative images of the cell cycle analysis diagrams. The EdU intensities were plotted against the DAPI intensities. The upper row shows Ven+ cells and the middle row Ven cells. Ven+ (in yellow) and Ven (in black) cells are overlayed within the diagrams of the bottom row. (D) The Ven+ and Ven cells were cytometrically analyzed for the proportion of EdU+. Each data point represents an independent biological sample. The means are represented by black bars. p values (n.s.—not significant, * p < 0.05, ** p < 0.01, *** p < 0.001) were determined using Student’s t-tests without corrections for multiple testing. (E) The cell cycle distribution of the Ven+ and Ven cells was determined. The means of the ratios of the values for the percentages of G1 (in green), S (in yellow) and G2 phase (in blue) are shown. The error bars indicate the standard deviations. The information on significance was omitted for reasons of clarity.
Figure 6
Figure 6
HROB-overexpressing cells show a dramatic reduction in DNA replication. HEp-2 cells were transiently transfected with plasmids encoding Venus (Ven), Ven-HROB or HROB-Ven. An amount of 16–18 h after transfection, the cells were treated with 10 μM EdU for 24 h and then analyzed by flow cytometry after EdU and DAPI staining (n = 4). (A) Representation of the experimental workflow. (B) The intensities determined for EdU staining and for Ven are plotted against each other. Ven-positive (Ven+) cells are shown in orange, Ven-negative (Ven) cells in black (representative diagrams of one of four independent biological samples). (C) For each sample, Ven+ and Ven were distinguished and analyzed for the proportion of EdU-positive cells (EdU+). Each data point represents an independent biological sample. The means are represented by black bars. The p values were determined using two-sided Student’s t-tests (n.s. – not significant).
Figure 7
Figure 7
A model of HROB facilitating the association of Mcm8/9 and locally restricting its activity by simultaneous interaction to the helicase and to the replisome during ICL traversing. This model is based on the observations and conclusions listed as follows: (i) A major fraction of ICL replication conflicts are resolved via ICL traversal, where the fork passes through the intact ICL, and DNA replication is continued beyond the lesion. This requires the remodeling of the CMG helicase and the reconstruction of the replication fork beyond the ICL. (ii) To prevent over-replication, the cell must ensure that new replication forks are exclusively formed where other forks have been stalled. The establishment of the new replication fork requires the unwinding of the DNA behind/beyond the ICL. Mcm8/9 is a helicase whose knock-out sensitizes cells to ICL, and it is enriched at replisomes and localizes at ICL damage sites. HROB is the Mcm8/9 activator whose knock-out also sensitizes cells to ICL. HROB associates with DNA replication factors and localizes at ICL damage sites. The depletion of HROB abolishes the recruitment of Mcm8 to DNA repair sites. (iii) HROB is an intrinsically disordered protein, and its high structural flexibility may allow the simultaneous interaction to multiple different binding partners. (iv) ICL traversal is dependent on FANCD2. The depletion of FANCD2 diminishes the association of HROB and of Mcm9 with ICL damage sites and the knock-out of HROB leads to the persistence of FANCD2 foci. The question mark on the right-hand side indicate that there are uncertainties in the model that require further research. See text for details and references.

Similar articles

References

    1. Abbas T., Keaton M.A., Dutta A. Genomic Instability in Cancer. Cold Spring Harb. Perspect. Biol. 2013;5:1000165. doi: 10.1101/cshperspect.a012914. - DOI - PMC - PubMed
    1. Gaillard H., García-Muse T., Aguilera A. Replication Stress and Cancer. Nat. Rev. Cancer. 2015;15:276–289. doi: 10.1038/nrc3916. - DOI - PubMed
    1. Saxena S., Zou L. Hallmarks of DNA Replication Stress. Mol. Cell. 2022;82:2298–2314. doi: 10.1016/j.molcel.2022.05.004. - DOI - PMC - PubMed
    1. Fragkos M., Ganier O., Coulombe P., Méchali M. DNA Replication Origin Activation in Space and Time. Nat. Rev. Mol. Cell Biol. 2015;16:360–374. doi: 10.1038/nrm4002. - DOI - PubMed
    1. Lin Y.C., Prasanth S.G. Replication Initiation: Implications in Genome Integrity. DNA Repair. 2021;103:103131. doi: 10.1016/j.dnarep.2021.103131. - DOI - PMC - PubMed

MeSH terms

Substances

LinkOut - more resources