. 2024 Dec 15;15(12):1602.
doi: 10.3390/genes15121602.

Transfer RNA Levels Are Tuned to Support Differentiation During Drosophila Neurogenesis

Affiliations

Transfer RNA Levels Are Tuned to Support Differentiation During Drosophila Neurogenesis

Rhondene Wint et al. Genes (Basel). .

Abstract

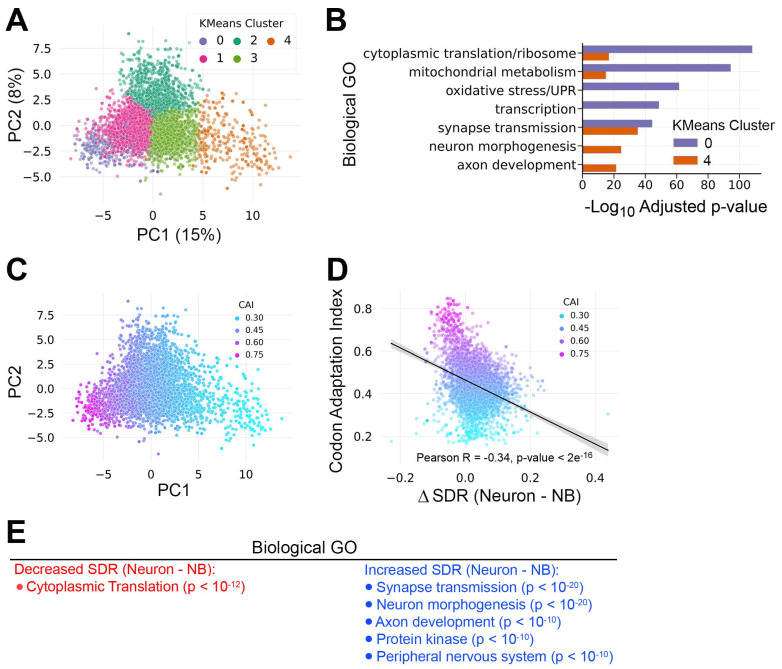
Background/objectives: Neural differentiation requires a multifaceted program to alter gene expression along the proliferation to the differentiation axis. While critical changes occur at the level of transcription, post-transcriptional mechanisms allow fine-tuning of protein output. We investigated the role of tRNAs in regulating gene expression during neural differentiation in Drosophila larval brains.

Methods: We quantified tRNA abundance in neural progenitor-biased and neuron-biased brains using the hydrotRNA-seq method. These tRNA data were combined with cell type-specific mRNA decay measurements and transcriptome profiles in order to model how tRNA abundance affects mRNA stability and translation efficiency.

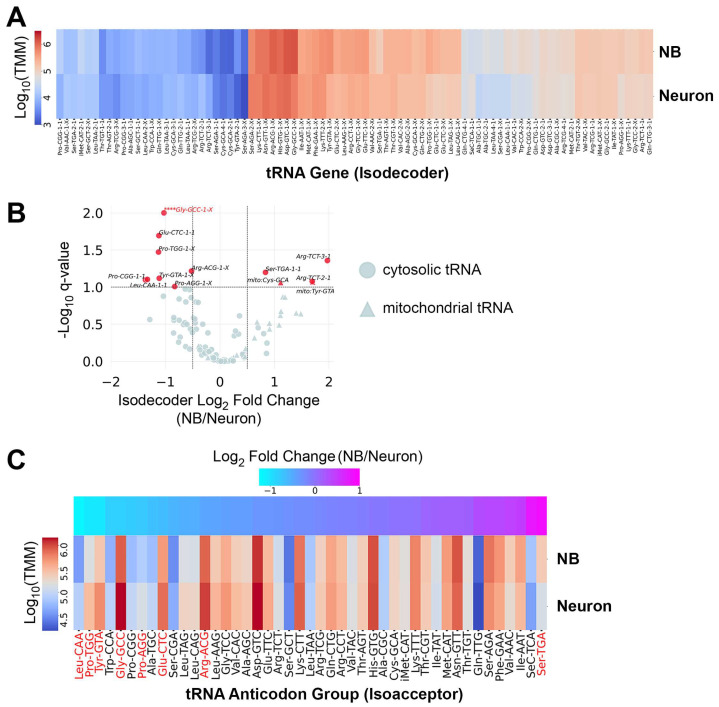
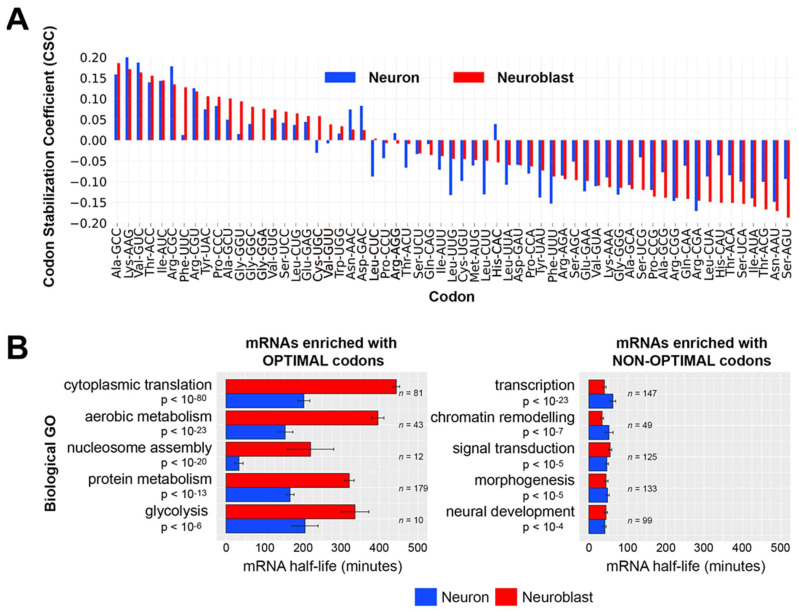
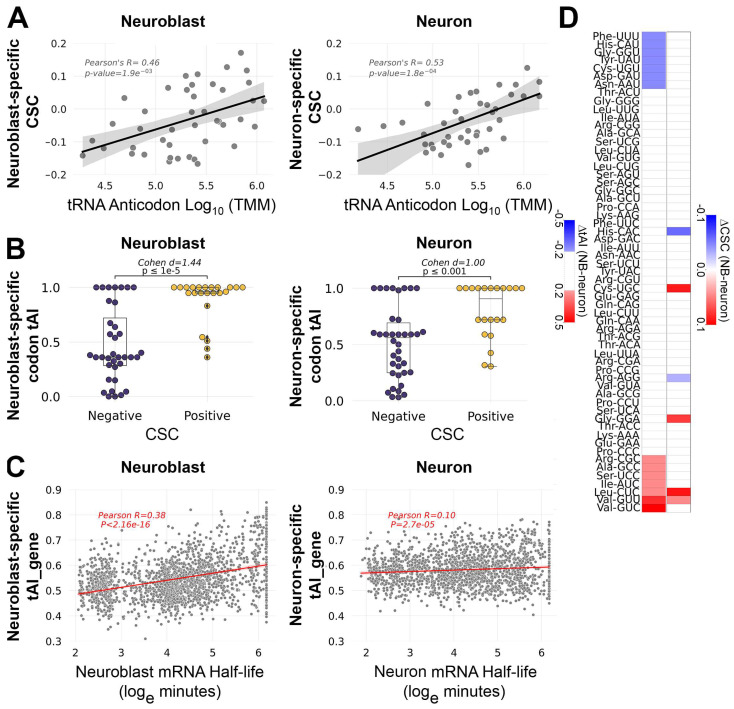
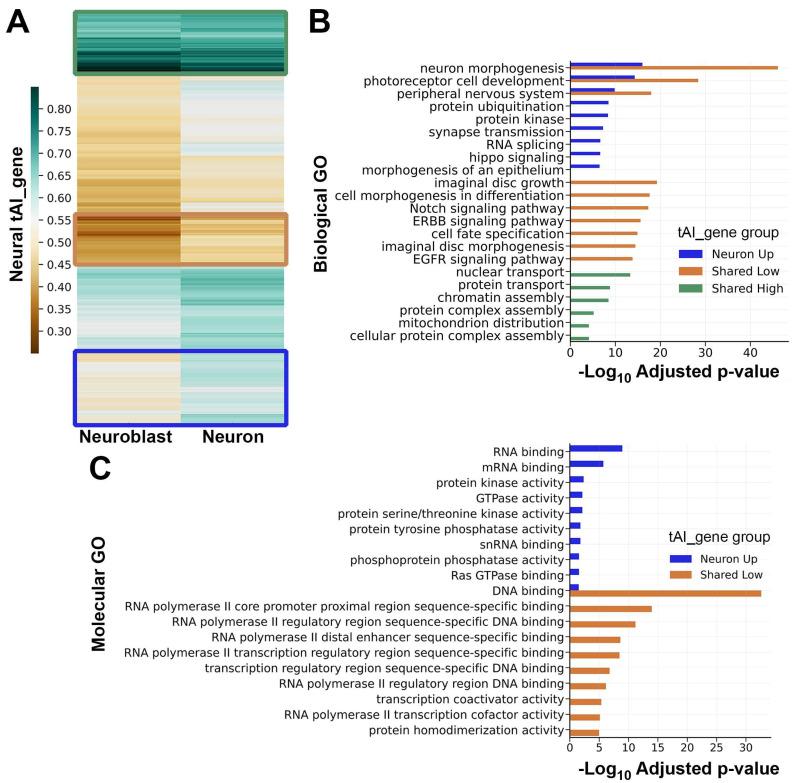
Results: We found that (1) tRNA abundance is largely constant between neural progenitors and neurons but significant variation exists for 10 nuclear tRNA genes and 8 corresponding anticodon groups, (2) tRNA abundance correlates with codon-mediated mRNA decay in neuroblasts and neurons, but does not completely explain the different stabilizing or destabilizing effects of certain codons, and (3) changes in tRNA levels support a shift in translation optimization from a program supporting proliferation to a program supporting differentiation.

Conclusions: These findings reveal coordination between tRNA expression and codon usage in transcripts that regulate neural development.

Keywords: codon usage; mRNA decay; mRNA translation; neurogenesis; tRNA.


Conflict of interest statement

The authors declare no conflicts of interest.

Figures

Figure 1
Figure 1
tRNA levels are largely constant between neuroblast-biased and neuron-biased brains, but variation exists for a subset of anticodon groups. (A) Hierarchically clustered heatmap showing the average expression level of 84 nuclear-encoded Drosophila tRNA genes (isodecoders). Counts were normalized to the Trimmed Mean of M-values (TMM). An X in the isodecoder name indicates that more than one gene encodes that particular isodecoder, and those genes are not distinguishable by mature tRNA sequence. (B) Volcano plot showing the relative isodecoder expression level for nuclear-encoded (cytosolic) and mitochondrial tRNA genes on the x-axis (fold change = average Neuroblast TMM/average Neuron TMM) and the false discovery rate q-value. tRNAs with a log2 fold change ≥ ±0.5 and q-value ≤ 0.1 are highlighted in red. **** denotes that Gly-GCC-1-X is off-scale, with a q-value < 0.001. (C) Hierarchically clustered heatmap showing the average expression level (normalized to Trimmed Mean of M-values (TMM)) for 44 anticodon groups (isoacceptors). Differentially expressed isoacceptors (q-value < 0.1) are highlighted in red.
Figure 2
Figure 2
Codon optimality-mediated decay is similar in neuroblasts and neurons and correlates with the stability of functionally related mRNAs. (A) Codon stabilization coefficients (CSCs) were calculated using neuroblast-specific and neuron-specific transcriptome-wide mRNA decay measurements [24]. (B) Gene ontology (GO) categories of mRNAs enriched with optimal codons or non-optimal codons. A total of 5169 neural transcripts (mRNAs present in neuroblast-biased and neuron-biased brains) were ranked by percent optimal codon content (defined by optimality in neuroblasts): the top 10% optimal codon enriched mRNAs (left panel) and the top 10% non-optimal codon enriched mRNAs (right panel) were used for GO analysis. The top five (ranked by adjusted p-value) non-redundant GO categories and corresponding adjusted p-values are listed. Neuroblast-specific and neuron-specific mRNA decay data [24] for the transcripts within each GO category were used to calculate the average mRNA half-life. The number of transcripts in each GO category is listed to the right of the plot bars. Error marks are standard errors of the mean. The adjusted p-value is based on the Bonferroni correction.
Figure 3
Figure 3
tRNA abundance correlates with codon-mediated mRNA decay in neuroblasts and neurons. (A) Scatter plots comparing tRNA isoacceptor abundance and codon stabilization coefficient (CSC) in each cell type (neuroblast data in the left panel, neuron data in the right panel). (B) Relationship between tRNA adaptation index (tAI) and CSC in each cell type (neuroblast data in left panel, neuron data in right panel). The effect size was measured by Cohen’s d and significance (p-value) was determined by Welch’s t-test. (C) Scatterplot comparing tAI_gene and mRNA half-life for 5169 transcripts present in neuroblast-biased and neuron-biased brains. (D) Heatmaps comparing differential tAI (left column) and differential CSC (right column). Only absolute D tAI values ≥ 0.2 are shown. Only CSCs that differed in category (optimal, neutral, non-optimal) are shown, according to the following criteria: optimal (CSC ≥ 0.01) in one cell type but neutral (0.01 > CSC > −0.01) or non-optimal (CSC ≤ −0.01) in the other.
Figure 4
Figure 4
tRNA adaptation during neural differentiation supports distinct translation programs. (A) Hierarchically clustered heatmap showing neuroblast-specific and neuron-specific tAI_gene values for 5169 neural mRNAs. Three emergent patterns are outlined in colored boxes: green for high tAI_gene in neuroblasts and neurons (“shared high”, n = 517 mRNAs), tan for low tAI_gene in neuroblasts and neurons (“shared low”, n = 411 mRNAs), and blue for increased tAI_gene in neurons compared to neuroblasts (“neuron up”, n = 965 mRNAs). (B) Biological function gene ontology (GO) category enrichment in each of the tAI_gene groups identified in part A. The bar color matches the group color in part A. Up to ten of the most significantly enriched GO categories, with adjusted p-value ≤ 0.0001, are listed (fewer categories if the p-value cutoff was not met). Adjusted p-values are based on the Bonferroni correction. (C) Molecular function GO category enrichment for transcripts present in the “neuron morphogenesis”, “photoreceptor cell development”, and “peripheral nervous development” Biological GO categories shown in part B. The ten most significantly enriched Molecular GO categories for each group (neuron up, shared low) are listed. The adjusted p-value is based on the Bonferroni correction.
Figure 5
Figure 5
mRNAs enriched in proliferation-associated codons are poorly adapted for translation by the post-differentiation tRNA pool. (A) Principal component analysis (PCA) on the normalized codon frequencies of 5169 mRNAs present in neuroblast-biased brains and neuron-biased brains. PCA captured a total variation of 23%, with 15% of the variance in principal component 1 (PC1). Unsupervised clustering by kmeans grouped the mRNAs into 5 clusters. (B) GO analysis of mRNAs within kmeans clusters at opposite ends of PC1: cluster 0 and cluster 4. (C) PCA plot from part A recolored with the Codon Adaptation Index (CAI) of each mRNA. (D) Scatterplot comparing CAI and the change in Supply Demand Ratio (SDR) between neurons and neuroblasts (DSDR = Neuron SDR—Neuroblast SDR). The Pearson R-value and the line of best fit show the inverse relationship between CAI and neuron-optimal SDR. (E) The 5169 neural mRNAs were ranked by ∆SDR (Neuron SDR—Neuroblast SDR) and the top 10% (increased SDR) and bottom 10% (decreased SDR) were subject to GO analysis. Significantly enriched GO categories with a Bonferroni adjusted p-value < 10−5 are listed.

Update of

Similar articles

References

    1. Teixeira F.K., Lehmann R. Translational Control during Developmental Transitions. Cold Spring Harb. Perspect. Biol. 2018;11:a032987. doi: 10.1101/cshperspect.a032987. - DOI - PMC - PubMed
    1. Pinzaru A.M., Tavazoie S.F. Transfer RNAs as dynamic and critical regulators of cancer progression. Nat. Rev. Cancer. 2023;23:746–761. doi: 10.1038/s41568-023-00611-4. - DOI - PubMed
    1. Orellana E.A., Siegal E., Gregory R.I. tRNA dysregulation and disease. Nat. Rev. Genet. 2022;23:651–664. doi: 10.1038/s41576-022-00501-9. - DOI - PMC - PubMed
    1. Advani V.M., Ivanov P. Translational Control under Stress: Reshaping the Translatome. BioEssays. 2019;41:e1900009. doi: 10.1002/bies.201900009. - DOI - PMC - PubMed
    1. Torrent M., Chalancon G., de Groot N.S., Wuster A., Babu M.M. Cells alter their tRNA abundance to selectively regulate protein synthesis during stress conditions. Sci. Signal. 2018;11:eaat6409. doi: 10.1126/scisignal.aat6409. - DOI - PMC - PubMed

MeSH terms